

Key Takeaways
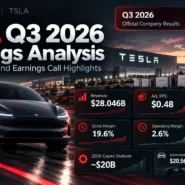
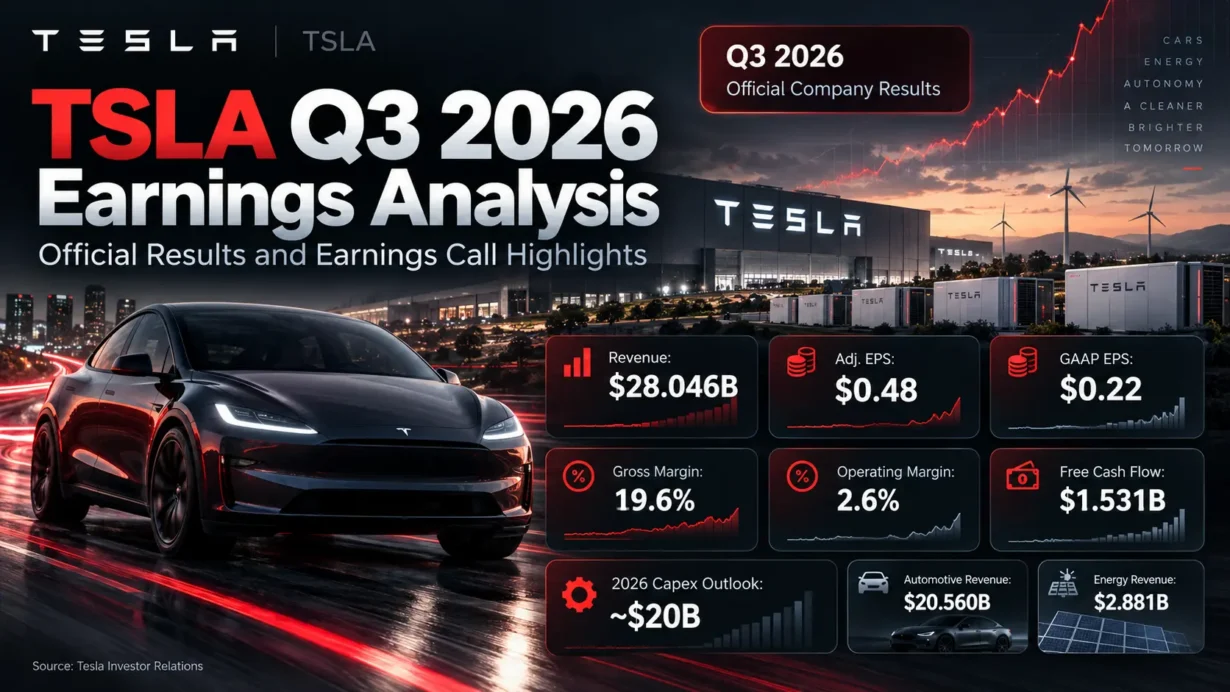
- Tesla reported $28.046 billion of Q3 2026 revenue, down 0.2% year over year and $295 million below Tesla’s own company-compiled sell-side consensus. Energy storage accounted for the largest revenue shortfall.
- Non-GAAP diluted EPS reached $0.48 versus $0.45 expected, but GAAP diluted EPS of $0.22 missed the $0.23 consensus. Gross margin rose to 19.6%, while operating margin remained only 2.6%.
- Free cash flow reached positive $1.531 billion versus a negative $4.506 billion consensus, partly because capital expenditure was materially below expectations. Management cut its 2026 capital spending outlook to approximately $20 billion.
- Paid active FSD customers reached 1.74 million, and cumulative unsupervised Robotaxi miles approached two million. Neither metric establishes profitable, scalable autonomous operations.
- TSLA closed at $386.47 on October 21, 2026, before the release and was $373.65 in late after-hours trading. The disconnect underscores how much future autonomy and robotics success the valuation already assumes.
Tesla’s third-quarter report, released on October 21, 2026, is best understood as two businesses moving at different speeds. Its established vehicle operation is still absorbing significant investments in artificial intelligence, autonomy, and robotics, while software adoption and parts of the service ecosystem are showing signs of economic leverage. The quarter offered unusually strong cash generation relative to expectations, but it did not demonstrate a sustainable recovery in operating profitability. That distinction matters more to long-term shareholders than a simple earnings-beat headline.
This TSLA Q3 2026 earnings analysis uses Tesla’s official Q3 update deck and its October 19 company-compiled analyst consensus. Management commentary is checked against a published third-party transcription of the October 21 earnings call; the official Investor Relations site hosts the webcast replay. All financial figures below are actual reported results unless expressly identified as consensus estimates, management targets, or calculations.
1. Core Earnings Breakdown
Revenue and Profitability Analysis
Tesla generated $28.046 billion in revenue, compared with $28.095 billion in Q3 2025, a decrease of approximately 0.17%. The company rounds the annual change to 0%. Its three reported revenue categories reveal a very different picture beneath that nearly flat consolidated result:
- Automotive: $20.560 billion, down 3% year over year and representing approximately 73.3% of total sales (20.560 / 28.046). This remains the earnings engine and the principal source of customer relationships for FSD, but declining automotive revenue shows that the autonomy narrative has not yet restored broad-based vehicle sales growth.
- Energy generation and storage: $2.881 billion, down 16% year over year and representing approximately 10.3% of sales (2.881 / 28.046). Storage deployments nevertheless increased to 13.7 GWh from 12.5 GWh a year earlier. The divergence makes revenue timing, product mix, and the durability of energy margins more important than headline deployment growth.
- Services and other: $4.605 billion, up 33% year over year and representing approximately 16.4% of sales (4.605 / 28.046). Charging, insurance, and parts sales supported expansion; a growing installed vehicle base gives this business recurring customer touchpoints that are less dependent on each quarter’s new vehicle deliveries.
Total GAAP gross profit rose 9% to $5.494 billion, lifting gross margin to 19.6% from 18.0% a year earlier, an improvement of 160 basis points. Automotive gross margin excluding regulatory credits rose sequentially from 16.3% to 18.1%, a positive sign for vehicle mix and underlying unit economics. However, it would be a mistake to extrapolate the entire consolidated gross-margin improvement. The energy segment’s 33.1% gross margin, up from 20.4% in Q2, benefited materially from tariff refunds and warranty reserve adjustments linked to vendor reimbursements, according to CFO Vaibhav Taneja.
The operating-income picture is much weaker. Operating expenses reached $4.776 billion, up 39% year over year, including $2.761 billion of research and development expense versus $1.630 billion a year earlier. Operating profit fell 56% to $718 million, and operating margin compressed to 2.6% from 5.8%. Put differently, $5.494 billion of gross profit less $4.776 billion of operating expenses left just $718 million of operating income. Tesla is investing aggressively enough that better product-level margins have not yet translated into strong company-level earnings.
GAAP net income attributable to common shareholders declined 43% to $787 million, with diluted GAAP EPS falling 44% to $0.22 from $0.39. Adjusted net income was $1.697 billion, or $0.48 per diluted share, compared with $0.50 a year ago. Investors should not treat the difference between GAAP and adjusted profitability as irrelevant: Tesla’s reconciliation adds back substantial stock-based compensation and adjusts for mark-to-market movements in digital assets and its SpaceX investment. These reconciliations are legitimate disclosures, but stock-based pay still matters economically to shareholders.
Operating cash flow totaled $6.263 billion, compared with $6.238 billion a year earlier. After $4.732 billion of capital spending, free cash flow was $1.531 billion, down 62% from $3.990 billion a year ago but sharply improved from negative $1.092 billion in Q2 2026. Cash, cash equivalents, and short-term investments ended the quarter at $45.447 billion. The liquidity position provides strategic flexibility; the weaker year-over-year free-cash-flow comparison cautions against confusing a consensus beat with a historical peak.
Expectations vs. Actual Results
The relevant benchmark here is the average of sell-side analyst estimates compiled and published by Tesla on October 19, not a company operating forecast. Other data vendors can report different averages, explaining why some headlines describe a revenue beat while this consistent, documented benchmark shows a miss. The following comparisons use actual Q3 results, not projections:
- ❌ Revenue: $28.046 billion actual versus $28.341 billion expected; missed by $295 million, or approximately 1.0%.
- ✅ Non-GAAP diluted EPS: $0.48 actual versus $0.45 expected; beat by $0.03 per share, or 6.7%.
- ❌ GAAP diluted EPS: $0.22 actual versus $0.23 expected; missed by $0.01 per share.
- ✅ GAAP gross margin: 19.6% actual versus 17.9% expected; beat by approximately 170 basis points.
- ➖ GAAP operating margin: 2.6% actual versus 2.5% expected; approximately in line, with a 0.1-percentage-point positive difference in the rounded figures. Actual operating income of $718 million was slightly below the $721 million consensus.
- ✅ Free cash flow: positive $1.531 billion actual versus negative $4.506 billion expected; a favorable $6.037 billion difference.
- ✅ Capital expenditure: $4.732 billion spent versus $7.771 billion expected to be spent; approximately $3.039 billion lower than the analyst average.
The revenue miss has a clear mathematical explanation. Actual automotive revenue exceeded the segment consensus by $288 million ($20.560 billion versus $20.272 billion), and services exceeded it by $256 million ($4.605 billion versus $4.349 billion). Energy revenue missed by $839 million ($2.881 billion versus $3.720 billion). Combining the three differences gives $288 million + $256 million − $839 million = −$295 million, exactly the consolidated gap. The shortfall therefore came from energy revenue, not a uniform collapse across Tesla’s operations.
A similarly revealing bridge explains why the 170-basis-point gross-margin beat did not deliver a major operating-earnings beat. Actual gross profit of $5.494 billion exceeded the $5.061 billion consensus by $433 million, but actual operating expenses of $4.776 billion exceeded the $4.340 billion estimate by $436 million. Nearly all of the gross-profit upside was absorbed by additional expenses, leaving operating profit $3 million below expectations. This is the central earnings-quality question: how quickly can investments in compute, AI chips, robotics, and new factories become monetizable revenue rather than persistent overhead?
The free-cash-flow surprise also requires disaggregation. Operating cash flow was $6.263 billion versus $3.267 billion expected, a favorable difference of $2.996 billion. Spending on property, plant, equipment, and other capital items was $3.039 billion below the consensus. Roughly half of the cash-flow surprise thus came from higher operating inflows and half from spending less than anticipated, subject to differences in which analysts contributed to each consensus line. Lower capital expenditure improves current liquidity but is not automatically evidence of stronger long-run earning power.
As for guidance, CFO Vaibhav Taneja reduced the 2026 full-year capital expenditure outlook to approximately $20 billion, down from a previously discussed level exceeding $25 billion. Management expects to fund this spending primarily through operating cash flow and said it does not plan to draw on newly arranged borrowing capacity during calendar 2026. Tesla provided no numerical Q4 2026 revenue, delivery, EPS, or operating-margin guidance in the official Q3 update. Its published outlook instead emphasizes factory utilization, supply-chain readiness, liquidity, and the longer-term shift toward software and fleet-based income. The approximately five-million-vehicles-per-year ambition around 2030 is a management aspiration, not next-quarter guidance or a reported outcome.
The share-price response illustrates the difference between accounting surprises and valuation expectations. TSLA closed the regular session on October 21 at $386.47, up 3.41%, before the earnings announcement. In a recorded late after-hours snapshot at 7:59 p.m. Eastern Time, it traded at $373.65, down 3.32% from that regular close. The pre-report session’s gain should not be presented as a response to the Q3 numbers; it occurred amid separate Tesla–SpaceX merger speculation. After the results and call, investors had to weigh the adjusted EPS beat and improved cash flow against weak consolidated operating earnings, lower capital spending than anticipated, extended commercialization schedules, and a lack of concrete merger terms. The smaller energy business’s revenue miss and the mismatch between today’s operating margins and Tesla’s long-duration AI valuation are more analytically useful explanations than calling the move merely “sell the news.” After-hours quotes are snapshots, not the next regular-session closing price.
Earnings Call Highlights
The following five themes are accurate strategic paraphrases of management’s October 21 remarks, rather than purported verbatim quotations. Forward-looking statements are identified as targets or expectations.
- Elon Musk and Vaibhav Taneja said vehicle demand and the four-year-high order backlog were being constrained by production and battery availability; FSD adoption is an increasingly important demand driver.
💡 Reading Between the Lines: The immediate challenge is converting claimed demand into deliveries without eroding vehicle pricing. Strong software attachment increases potential lifetime value, but a backlog is not revenue and does not remove battery or regulatory constraints. - Taneja said paid FSD adoption had expanded to roughly 1.74 million active customers, approximately half using monthly subscriptions, while over 75% of new North American deliveries included paid FSD.
💡 Reading Between the Lines: Tesla is building a software relationship on top of its installed vehicle base, a potentially attractive source of recurring gross profit. Subscription retention, geographic mix, and the transition from supervised assistance to commercial autonomy remain unreported or unresolved. - Taneja revised full-year 2026 capital expenditure guidance to approximately $20 billion, reported positive quarterly free cash flow, and described up to $30 billion in additional borrowing capacity without planned 2026 draws.
💡 Reading Between the Lines: Financial flexibility reduces near-term funding pressure, but the reduction in spending also raises questions about the delivery schedule for AI infrastructure and industrial capacity. Secured borrowing availability should not be mistaken for borrowing already drawn or a guarantee of future returns. - Musk described Megapack demand as approaching a sold-out position for 2027, while Taneja attributed much of the latest energy gross-margin improvement to tariff refunds and warranty-related vendor adjustments.
💡 Reading Between the Lines: Grid infrastructure and data-center demand could support an attractive backlog, but the quarter’s energy revenue miss shows that bookings, deployments, recognized revenue, and margin realization are distinct. A 33.1% quarterly energy gross margin should not be assumed to recur unchanged. - Musk outlined early Optimus production and a prospective late-2027 external-customer timetable; Ashok Elluswamy described a possible 2027 extension of unsupervised fleet operations to selected customer vehicles, while Taneja acknowledged Robotaxi had not reached its $0.30-per-mile cost goal.
💡 Reading Between the Lines: Tesla is progressing toward multiple capital-intensive business models that could carry radically different margins from vehicle manufacturing. Their contribution to intrinsic value is still contingent on reliability, safety approval, throughput, utilization, unit economics, and ultimately audited revenue—not the size of the addressable-market narrative.
One additional board-level issue deserves separate attention. On the possible combination of Tesla and SpaceX, Musk declined to provide transaction details during the Q3 call. Independent committees were reportedly examining a potential transaction, but no completed merger, exchange ratio, shareholder dilution, or final timetable had been announced. Investors should distinguish any hypothetical cross-company manufacturing or compute synergies from the unquantified risks of integration, governance, and minority-shareholder economics.
2. Deep Business Insights
Hidden Metrics That Matter
The most decision-useful leading indicators are not necessarily the most frequently quoted items in an earnings headline. Two calculations help test whether Tesla’s competitive advantages are actually reaching the financial statements.
- FSD’s emerging recurring relationship: Tesla reported 1.74 million active paid FSD customers at quarter-end, up from 1.04 million a year earlier and 1.48 million in Q2 2026. Its CFO described approximately 50% as subscriptions. Therefore, 1.74 million × 50% ≈ 870,000 monthly subscribers (calculated from company-reported figures and management’s rounded subscription share). This is an approximate customer count, not revenue or annual recurring revenue. The reported category includes upfront purchases and monthly subscriptions but excludes free trials, and Tesla has not published a directly comparable FSD churn rate. FSD (Supervised) still requires active driver supervision and is not itself an unsupervised Robotaxi product.
- Working-capital sensitivity behind cash generation: The cash-flow statement includes a positive $3.991 billion movement in accounts payable, accrued expenses, and other liabilities, plus a positive $1.255 billion movement in deferred revenue. Their combined positive cash-flow contribution of $5.246 billion, divided by $6.263 billion in quarterly operating cash flow, equals approximately 83.8% (calculated from company-reported figures). This is a scale comparison of two positive working-capital lines—not a claim that 83.8% of cash flow is artificial or that these items are the sole drivers. Other cash-flow movements offset part of these benefits, while timing and deferred-revenue recognition can change substantially next quarter. Monitoring payable days, advance collections, actual vehicle deliveries, and the conversion of deferred revenue into recognized revenue is therefore essential.
Why do customers select Tesla rather than a rival? For individual drivers, the proposition increasingly combines the vehicle, charging access, over-the-air software updates, and FSD functionality in one continuously updated product. The company’s Q3 disclosure of 84,465 Supercharger connectors is evidence of a supporting network that can reinforce convenience and repeat engagement. For utilities and data-center operators, Tesla’s integrated Megapack hardware, battery management, grid integration, and domestic manufacturing strategy may simplify deployment and support needs. These attributes can create meaningful differentiation and potential switching costs, but the company has not disclosed an independent, audited metric isolating the incremental return on those advantages. The investment test is whether they ultimately produce durable pricing power, renewals, high utilization, and cash margins—not simply a larger installed base.
Industry Chain Reactions
- ✅ Benefit — Micron Technology (NASDAQ: MU): Tesla’s rising AI compute and robot-related memory needs could sustain demand for advanced memory, and Musk explicitly thanked Micron for committing memory allocation in the Q2 2026 earnings call. The Q3 discussion of a more ambitious semiconductor manufacturing program reinforces the strategic relevance of memory supply. This is a conditional supplier opportunity, not a claim that Tesla disclosed new Q3 Micron purchase orders, revenue, or contract value. Longer term, Tesla’s proposed in-house semiconductor capacity could change the balance between external procurement and internal production.
- ❌ Face Pressure — Uber Technologies (NYSE: UBER): Musk reiterated that most Cybercabs are intended for Tesla-owned transportation-as-a-service fleets, rather than merely for sale as privately owned vehicles. If Tesla achieves safe autonomous scale, commercially attractive per-mile costs, and high vehicle utilization, it could compete for urban trips and weaken the value of traditional ride-hailing intermediation in overlapping markets. Tesla has not disclosed Robotaxi revenue, ride profitability, or sufficient fleet economics to establish a measurable current hit to Uber; the competitive pressure remains a scenario, not a reported result.
The wider industry implication is a potential shift in value capture from selling vehicles to operating the mobility network and its software stack. That remains a strategic thesis, not a verified 2026 profit source. Suppliers may benefit from the buildout even if Tesla’s shareholders endure an extended period of heavy investment before platform economics become visible.
Valuation Framework and Key Risks
Using the October 21, 2026, regular-session closing price of $386.47 per share, Tesla carried a market capitalization of approximately $1.53 trillion. A simple trailing earnings check exposes the valuation hurdle. Reported quarterly GAAP diluted EPS for Q4 2025 through Q3 2026 was $0.24 + $0.13 + $0.32 + $0.22 = approximately $0.91 per share. At $386.47, the price-to-trailing-GAAP-EPS ratio was therefore about 425 times ($386.47 / $0.91; calculated from company-reported figures and the cited share-price snapshot). Using non-GAAP EPS of $0.50 + $0.41 + $0.33 + $0.48 = $1.72 over the same period produces an adjusted trailing multiple of approximately 225 times. These are approximations because published quarterly EPS figures are rounded, and adjusted measures remove certain costs.
Neither multiple is compatible with valuing Tesla exclusively as a mature manufacturer earning a 2.6% operating margin. The equity price embeds substantial expectations for monetizable autonomy, software, storage, and robotics—businesses that management expects to scale but whose final margins and capital requirements have not been established. A traditional one-year forward P/E based on analyst forecasts would add assumptions rather than independently verify their fulfillment, so it is intentionally not presented as realized earnings.
A disciplined valuation model should separate observable businesses from contingent opportunities. For the core vehicle business, use reported deliveries, realized automotive revenue per vehicle, gross margin excluding credits, and recurring factory investment. For energy, emphasize contract conversion, project revenue recognition, and gross margin normalized for tariff and warranty adjustments. For FSD, evaluate subscribers and renewals while explicitly modeling supervision and jurisdictional restrictions. For Robotaxi, require evidence of paid rides, cost per mile, fleet size, insurance and cleaning costs, safety performance, and city-level utilization before treating projected platform income as a base-case certainty. For Optimus and Terafab, place material value on execution only as outside-customer orders, repeatable production yields, and return-on-capital evidence emerge.
The major risks are closely connected rather than independent:
- Execution and capitalization risk: AI compute, factory capacity, vehicle batteries, Optimus manufacturing, and a possible semiconductor fab compete for cash and managerial attention. Tesla’s 2026 spending reduction may reflect discipline, but potential future semiconductor investments remain very large and their allocation between Tesla and SpaceX is not finalized.
- Margin-quality risk: A portion of the energy gross-margin expansion reflected refunds and warranty adjustments. Overall operating profit remains small relative to revenue because of ongoing AI and R&D expenditures.
- Regulatory and safety risk: FSD (Supervised) is not driverless autonomy, and scaling Robotaxi requires jurisdiction-by-jurisdiction approvals as well as reliable real-world operations. Technical progress alone does not guarantee commercial permission or attractive insurance costs.
- Competitive and demand risk: Other manufacturers and autonomous mobility operators may respond with better software, lower prices, alternative sensors, or more capital-efficient distribution. Tesla also remains exposed to interest rates, financing incentives, tariffs, battery availability, and changes in consumer preferences.
- Governance and transaction risk: The Tesla–SpaceX merger discussion remains preliminary. Any eventual transaction could introduce material strategic benefits or substantial dilution and conflicts, but no exchange terms or actual dilution are available to quantify today.
The bull case would strengthen if FSD retention and paid Robotaxi unit economics improve while automotive margins recover and investment converts into higher operating profits. The bear case would become more persuasive if capex is merely deferred, software adoption fails to support incremental profit, energy margins normalize sharply lower, or autonomy timelines slip while the stock continues to price in transformative success. The next decisive data points are audited autonomy revenue or unit economics, recurring subscription behavior, energy gross margin without one-off benefits, and operating-cash-flow quality across multiple quarters.
3. Key FAQs
Did Tesla beat Q3 2026 earnings estimates on revenue and EPS?
Tesla reported Q3 2026 revenue of $28.046 billion, $295 million below the $28.341 billion average of estimates published in its company-compiled consensus. Non-GAAP diluted EPS of $0.48 beat the $0.45 consensus by $0.03, while GAAP diluted EPS of $0.22 fell short of the $0.23 estimate. Gross margin beat expectations, but the improvement was substantially offset by higher operating expenses. Whether revenue is described as a beat elsewhere depends on the particular analyst-consensus provider used.
Why did TSLA stock fall after the Q3 2026 earnings call despite positive free cash flow?
TSLA was down approximately 3.32% versus its $386.47 regular-session close at a 7:59 p.m. Eastern Time after-hours snapshot on October 21. The mixed reaction was consistent with a large free-cash-flow beat that depended partly on lower capital spending, alongside softer energy revenue, a 2.6% operating margin, a lack of quantitative Q4 earnings guidance, and uncertainty surrounding AI monetization and a possible SpaceX merger. These are plausible contributors rather than a proven attribution of every trading decision; no merger agreement or dilution figure was disclosed.
What did Tesla guide for Q4 2026 and the rest of 2026 after its earnings report?
Tesla did not issue numerical Q4 2026 revenue, EPS, or operating-margin guidance in its published third-quarter update. The explicit quantitative change discussed on the call was a reduction in projected full-year 2026 capital expenditures to approximately $20 billion, from a previously discussed level above $25 billion. Management also discussed longer-dated targets for vehicle scale, Robotaxi expansion, Optimus, and semiconductor manufacturing. Those milestones are forward-looking ambitions and should not be reported as booked revenue, confirmed deliveries, or achieved profitability.
Sources: Tesla’s official Q3 2026 earnings press release, Q3 2026 shareholder update and financial statements, Tesla’s company-compiled Q3 analyst consensus, Tesla Investor Relations earnings webcast archive, third-party Q3 earnings-call transcript, Q2 management remarks on Micron, and dated TSLA price snapshots. Figures are current to the October 21, 2026 earnings release and the after-hours quote time stated above.
Disclaimer: This article/chart is for educational and informational purposes only and does not constitute investment advice of any kind. Past performance is not indicative of future results. Investors should independently evaluate their own risks.