
Key Takeaways
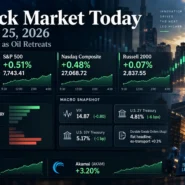
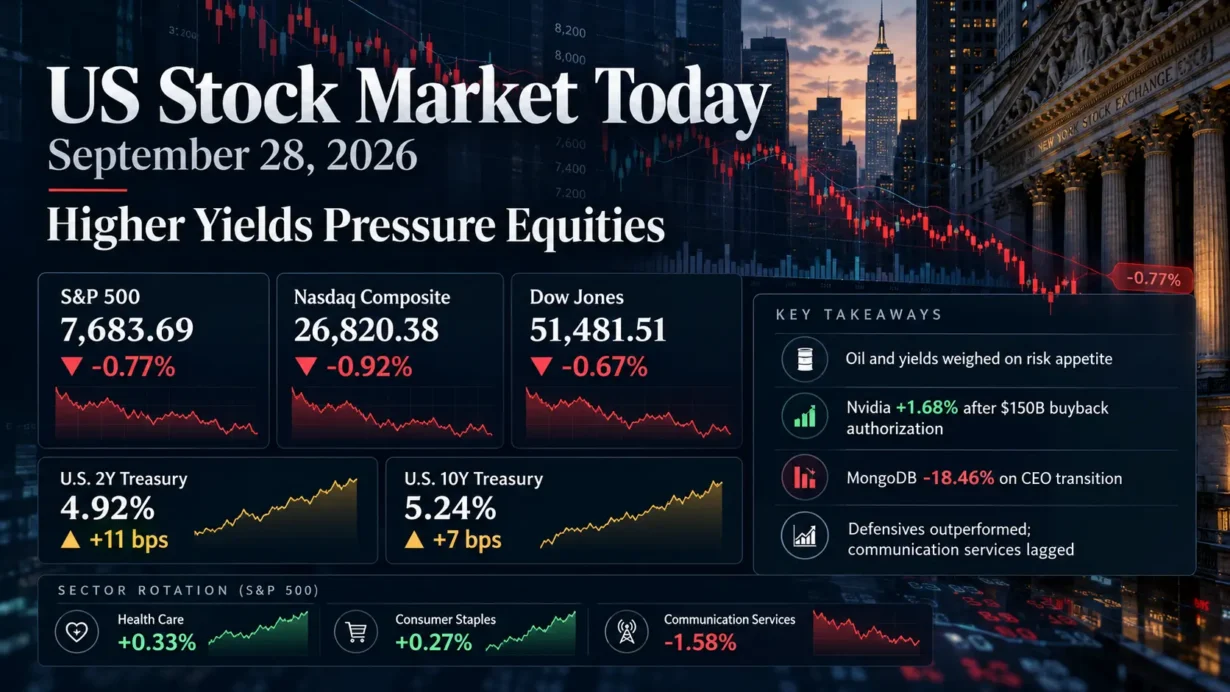
- The S&P 500 fell 0.77% to 7,683.69, the Nasdaq Composite lost 0.92% to 26,820.38, and the Dow declined 0.67% to 51,481.51 as higher yields compressed equity valuations.
- Health care (+0.33%) and consumer staples (+0.27%) led among closing-price sector ETF proxies; communication services lagged (-1.58%). Broad selling, not merely weakness in a few megacaps, defined the session.
- The Treasury’s 2-year yield rose 11 basis points to 4.92%, while its 10-year yield climbed 7 basis points to 5.24%. The VIX finished at 16.07, up 1.20 points.
- Nvidia advanced 1.68% after expanding its repurchase authorization by $150 billion; MongoDB dropped 18.46% after an abrupt CEO transition despite reaffirmed management guidance.
1. Market Capital Flows and Sector Rotation
Monday’s selloff reflected a higher discount rate and renewed oil-related inflation risk as uncertainty persisted over a U.S.-Iran agreement concerning the Strait of Hormuz. The Russell 2000 declined 0.69% to 2,817.91, marginally outperforming the S&P 500 but offering little evidence of a small-cap risk-on rotation. The Nasdaq’s larger loss indicated pressure on growth-oriented equities, while defensives generally held up better than cyclicals. AP index closes; Reuters market context.
For a reproducible sector comparison, the following percentages are September 28 regular-session closes for Select Sector SPDR ETFs, not independently verified official S&P sector-index returns. Health care (XLV) gained 0.33%, consumer staples (XLP) rose 0.27%, and energy (XLE) added 0.10%. Communication services (XLC) was the weakest of the 11 proxies at -1.58%, followed by consumer discretionary (XLY) at -1.41% and financials (XLF) at -1.19%; technology (XLK) lost 0.89%. The contrast suggests a preference for comparatively predictable demand over advertising exposure, discretionary spending and rate-sensitive valuation multiples. XLV; XLP; XLE; XLC; XLY; XLF; XLK.
Market breadth reinforced the defensive signal: NYSE decliners outnumbered advancers 3.55 to 1, versus 2.56 to 1 on Nasdaq. The S&P 500 registered four new 52-week highs and 29 new lows. Total U.S. exchange volume was 16.71 billion shares, slightly below the prior 20-session average of 16.85 billion; the decline was broad but did not require unusually heavy aggregate turnover. Reuters breadth and volume.
Institutional Flow Insight: Price action is consistent with investors reducing portfolio duration and rotating toward defensible earnings as the quarter ends. Higher yields can make distant cash flows and richly valued growth shares less attractive; elevated energy costs can simultaneously erode consumer purchasing power. Quarter-end rebalancing and tighter risk budgets are plausible contributing mechanisms, not verified institutional transaction data. Value’s relative resilience should not be confused with a blanket cyclical recovery: financials and consumer discretionary both fell sharply.
2. Decoding the Biggest Market Movers
Nvidia (NVDA)
Nvidia closed at $228.86, up 1.68%, after its board authorized an additional $150 billion in repurchases, bringing the total remaining authorization to $235 billion. The company expects to execute that remaining program through fiscal 2028; authorization is not an executed purchase or evidence of buying on September 28. Verified regular-session close; Nvidia’s September 28 announcement.
The capital-return announcement draws support from reported operating results rather than hypothetical earnings: fiscal second-quarter 2027 revenue reached $96.2 billion, up 106% year over year; data-center revenue was $89.0 billion, GAAP gross margin was 75.0%, and GAAP diluted EPS was $2.46. Those figures come from Nvidia’s August 26 earnings release and its official earnings-call transcript. The stock’s advance helped counter weakness in technology but did not reverse the sector’s 0.89% ETF decline. Investors still face the question of whether AI infrastructure returns will justify customers’ capital spending as financing costs rise.
MongoDB (MDB)
MongoDB plunged 18.46% to $334.68 after announcing that CEO Chirantan “CJ” Desai had stepped down immediately to pursue a senior position at Meta. Former CEO Dev Ittycheria returned as interim chief, and the board launched a permanent-successor search. Critically, MongoDB reaffirmed the third-quarter and full-year fiscal 2027 guidance issued September 1; the September 28 announcement did not report a contemporaneous cut to its financial outlook. Verified regular-session close; Official leadership announcement.
The latest reported quarter provides context: revenue rose 30% to $771.8 million, Atlas revenue increased approximately 29%, GAAP diluted EPS was $0.50, and the non-GAAP operating margin reached 24%. The magnitude of the share-price response therefore points to uncertainty about leadership continuity and AI-platform execution rather than a disclosed same-day earnings deterioration. For other premium-valued software names, the read-through is greater sensitivity to management and execution risk when yields are rising. MongoDB’s September 1 results; Official earnings-call replay.
3. Macro Indicators and Market Outlook
The Cboe VIX ended September 28 at 16.07, up 1.20 points, or 8.07%, from Friday’s 14.87. The rise was directionally consistent with falling equities and greater near-term demand for volatility protection, but a closing level near 16 does not by itself establish panic or reveal actual options-hedging flows. Earlier intraday VIX quotations should not be substituted for the final print. Historical VIX closes.
In the U.S. Treasury’s official daily par-yield series, the 2-year yield finished at 4.92%, up 11 basis points from September 25, and the 10-year reached 5.24%, up 7 basis points. The 10-year/2-year spread narrowed from 36 to 32 basis points, a one-day bear flattening. The larger front-end move is consistent with repricing near-term inflation and Federal Reserve policy risk; the long-end increase may also reflect growth and term-premium considerations, which cannot be isolated from one day’s yields. Following the Fed’s September quarter-point increase, oil-driven inflation concerns outweighed relief from tentative diplomatic contacts. Treasury’s daily series is based on approximately 3:30 p.m. quotations and may differ slightly from late wire-service screen yields. Reuters policy and oil context.
Oil’s closing move was less dramatic than its initial spike: Brent settled at $105.28 per barrel, up $0.96, while WTI settled at $92.60, up $0.19, as the prospect of further talks tempered early supply fears. That distinction matters for assessing whether the day’s equity losses reflected a sustained new oil shock or a broader reassessment of rates and risk. Reuters commodity settlements.
Upcoming Economic Data & Catalysts:
- BEA Personal Income and Outlays, August 2026 (Release date: September 30, 2026, 8:30 a.m. ET): The PCE inflation measures and real consumer spending will test the balance between inflation persistence and demand resilience.
- BLS Employment Situation, September 2026 (Release date: October 2, 2026, 8:30 a.m. ET): Payrolls, unemployment and wages could reshape rate expectations and earnings assumptions.
Market Insights:
Monday was a broad de-risking session, not a benchmark decline caused solely by a handful of megacaps: negative breadth and eight declining sector ETF proxies outweighed Nvidia’s gain. A renewed yield spike, weaker breadth, downward earnings revisions, a material oil-supply disruption or a sustained rise in implied volatility could intensify the pressure. Conversely, softer inflation alongside stable profits would challenge the day’s duration-driven rotation; neither outcome is assured.
Trading & Investment Strategy:
Position sizes should reflect exposure to both equity drawdowns and interest-rate shocks. Staggering entries can reduce dependence on a single inflation or payroll release; diversified sector exposure and predefined exit or stop-loss rules can limit concentration and execution risk. Avoid treating one day’s defensive outperformance or Nvidia’s buyback authorization as a reason to chase prices, particularly ahead of closely spaced macroeconomic catalysts. Stops can slip in volatile markets and do not guarantee a fixed loss.
4. Key FAQs About the US Stock Market Today
Why did the US stock market move on September 28, 2026?
Rising Treasury yields and persistent oil-related inflation uncertainty pressured valuations after doubts about progress in U.S.-Iran talks. Weak market breadth overwhelmed Nvidia’s positive buyback news, while MongoDB’s CEO departure weighed heavily on that stock.
Which sectors performed best and worst in the US stock market on September 28, 2026?
Among verified closing-price S&P 500 sector ETF proxies, health care led at +0.33%, followed by consumer staples at +0.27%; communication services lagged at -1.58%, followed by consumer discretionary at -1.41%. These ETF returns are not official S&P sector-index returns.
What should investors watch after the US stock market close on September 28, 2026?
Watch the BEA’s August PCE release on September 30 and the BLS’s September jobs report on October 2, alongside the 2-year and 10-year Treasury yields, VIX and market breadth. Whether leadership broadens beyond isolated winners will help distinguish a durable recovery from a narrow rebound.
Disclaimer: This article is intended solely for the exchange of investment ideas and does not constitute investment advice of any kind.