

Key Takeaways
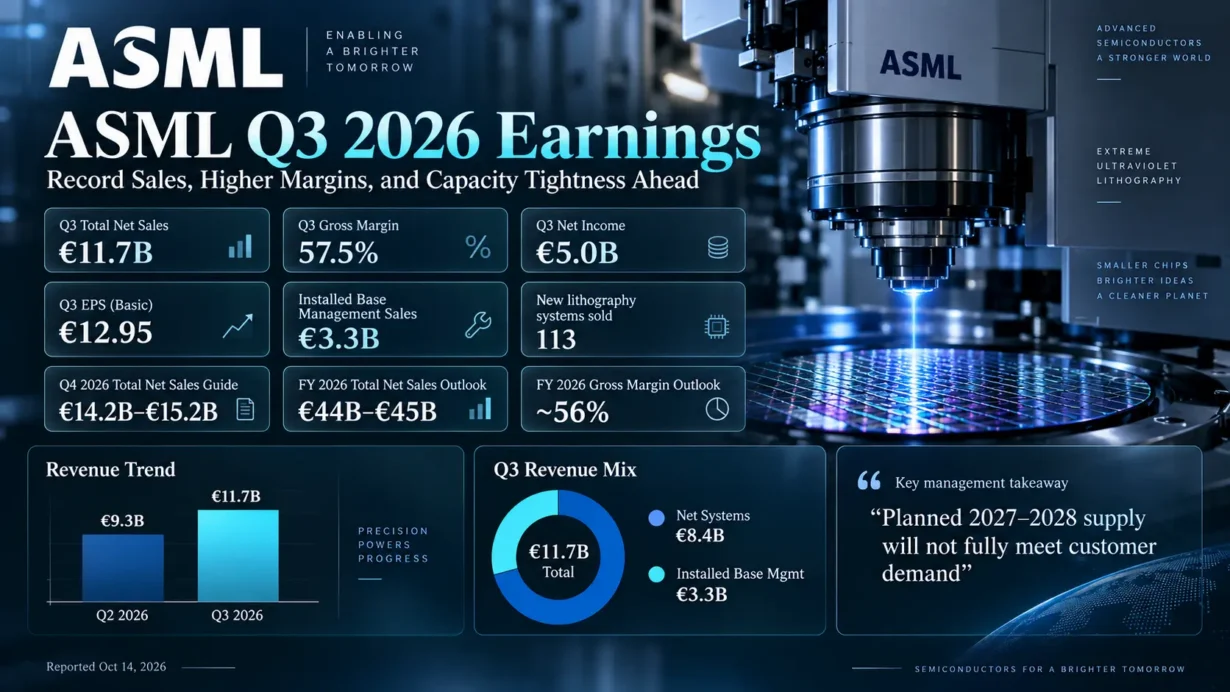
- ASML reported Q3 2026 net sales of €11.662 billion, up 55.2% year over year, with a 57.5% gross margin and 44.4% operating margin. Basic EPS reached €12.95.
- Revenue fell approximately 0.4% short of the €11.71 billion pre-release Visible Alpha estimate, while reported EPS exceeded its €10.87 estimate by approximately 19.1%. The EPS result includes a €509.7 million non-operating equity-investment valuation gain.
- Installed Base Management sales rose 67.6% year over year to €3.289 billion; demand for productivity upgrades, rather than merely more new EUV tools, powered the gross-margin surprise.
- ASML guided Q4 2026 revenue to €14.2–€15.2 billion and raised the lower end of its full-year sales outlook to €44 billion, but said its currently planned 2027–2028 manufacturing capacity will not fully meet customer demand.
- The Nasdaq-listed ADR closed at $1,650.00 on the October 14 earnings date, down 3.94%, before closing at $1,657.44 on October 15. Investors are weighing pricing power and order visibility against elevated expectations, production limits and AI-capex financing risks.
Published October 16, 2026. This ASML Q3 2026 earnings analysis uses ASML’s October 14 investor-relations release, US GAAP statements, investor presentation, management’s official prepared-remarks transcript and video-interview transcript, supplemented by a separately published conference-call Q&A transcript. ASML reports in euros; quoted Nasdaq ADR prices are in US dollars. All reported financial results below are historical company figures unless expressly identified as external consensus, management guidance, or illustrative valuation sensitivity.
1. Core Earnings Breakdown
Revenue and Profitability Analysis
ASML’s quarterly net sales increased from €7.516 billion in Q3 2025 to €11.662 billion in Q3 2026, representing 55.2% year-over-year growth (calculated from company-reported figures: (€11,662 million ÷ €7,516 million − 1) × 100). Sequential sales growth was 25.0% from €9.326 billion in Q2 2026. Gross profit reached €6.700 billion and operating profit reached €5.173 billion. The gross margin expanded from 51.6% a year earlier and 54.0% a quarter earlier to 57.5%; the operating margin increased from 32.8% and 37.1%, respectively, to 44.4%. These profitability gains were genuine operating improvements, distinct from the investment-related uplift to net income.
Company-reported business lines and management’s technology breakdown reveal why the quarter was stronger than an AI-lithography headline suggests:
- Net system sales: €8.373 billion, or 71.8% of quarterly revenue (calculated from company-reported figures), up 50.8% from €5.554 billion in Q3 2025. Within this total, management reported approximately €4.1 billion of EUV system revenue and €4.3 billion of non-EUV revenue. Investment judgment: the system business has substantial pricing and volume leverage, but hardware sales remain sensitive to production throughput and customers’ fab-readiness schedules.
- EUV lithography: approximately 49% of Q3 net system sales, compared with 57% in Q2, according to the official quarterly presentation. ASML sold 17 EUV lithography systems versus 16 in Q2; management said Q3 EUV revenue included one High-NA EUV system. Investment judgment: EUV’s strategic monopoly remains the core moat, but the lower sequential revenue mix means investors should not attribute the entire Q3 acceleration to additional EUV deliveries.
- Non-EUV lithography: approximately €4.3 billion in Q3 system revenue. In the quarter’s tool mix, ArF immersion sales rose to 40 units from 23 in Q2, and i-line sales rose to 19 units from nine. Investment judgment: DUV demand broadens ASML’s addressable spending pool beyond leading-edge EUV, although China’s export-control exposure makes the non-EUV revenue stream more geopolitically sensitive.
- Installed Base Management (IBM): €3.289 billion, or 28.2% of quarterly revenue (calculated from company-reported figures), up 67.6% from €1.962 billion in Q3 2025 and 19.1% from €2.762 billion in Q2 2026. This business includes net service and field-option sales, particularly productivity upgrades. Investment judgment: the installed base provides recurring customer access and a high-value upgrade opportunity; unusually favorable upgrade mix can lift margins faster than scanner unit growth alone.
End-use provides another lens rather than a separate revenue segment: 54% of Q3 net system sales served logic customers and 46% served memory. For the full year 2026, management expects approximately 10% growth in logic net system sales and 75% growth in memory net system sales. Those are management forecasts for the year, not measured Q3 segment growth rates. In the longer run, advanced DRAM’s increasing use of EUV may make memory lithography intensity more structurally important than the traditional logic-centric narrative suggests.
Net income was €4.960 billion, compared with €2.125 billion a year earlier, and basic EPS was €12.95 versus €5.49, a reported increase of 135.9% (calculated from company-reported figures). Diluted Q3 EPS was €12.93. Crucially, the US GAAP statement separately records a €509.7 million gain on equity investments. CFO Roger Dassen attributed approximately €0.5 billion of the quarter’s earnings to an increase in the valuation of ASML’s initial Mistral AI investment. The gain is below operating income: it does not explain the 44.4% operating margin, but it does make unadjusted EPS growth a less pure measure of core semiconductor-equipment earnings.
Expectations vs. Actual Results
To prevent hindsight bias, the consensus yardstick here is the pre-earnings Visible Alpha forecast published by Investopedia on October 13, 2026. Consensus series from different providers can disagree, so comparisons should not be blended across vendors or currencies.
- ❌ Revenue — actual €11.662 billion versus pre-release consensus of €11.71 billion: a €48 million, or approximately 0.4%, miss (calculated from the official figure and the cited consensus). This is a modest top-line shortfall, not evidence of weak customer demand.
- ✅ EPS — actual basic EPS €12.95 (diluted €12.93) versus pre-release EPS consensus of €10.87: approximately €2.08, or 19.1%, above the cited estimate using basic EPS. Investopedia does not specify whether its consensus series is basic or diluted, and the €509.7 million investment revaluation means the headline beat should not be mistaken for an entirely recurring operating beat.
- ✅ Gross margin against management guidance — actual 57.5% versus ASML’s previous Q3 gross-margin guide of 55%–57%: 0.5 percentage points above the upper bound. This is a company-guidance beat, not an independently verified consensus comparison.
- ➖ Operating margin — actual 44.4% versus no independently verifiable, same-basis pre-release operating-margin consensus found in the reviewed public sources. A consensus beat or miss is therefore not claimed. Operating margin did, however, improve by 7.3 percentage points sequentially and 11.6 percentage points year over year, based on ASML’s published rounded margins.
Next-quarter guidance: for Q4 2026, ASML expects €14.2–€15.2 billion in net sales, a gross margin around 57%, approximately €3.7 billion in IBM sales, roughly €1.2 billion in R&D costs and €0.4 billion in SG&A costs. The midpoint of the sales range is €14.7 billion; that is arithmetic on management’s range, not an independent analyst forecast. For full-year 2026, management now guides to €44–€45 billion in sales and a gross margin around 56%, compared with its previous €43–€45 billion revenue range and 54%–56% gross-margin range. The company raised the revenue floor, not the ceiling.
What actually drove the beat? Strong uptake of installed-base productivity upgrades added almost €0.4 billion above IBM guidance, lifting gross margin through high-margin upgrade components; growing systems volume and favorable EUV/immersion mix also supported operating leverage. The EPS upside had two components that must be separated: durable improvement in operating profit and the non-operating Mistral valuation gain. Treating the entire EPS surprise as new scanner economics would overstate earnings quality.
What mattered most to the market? The strategic pipeline and capacity constraints arguably outweighed the small sales miss: management sees stronger customer demand for 2028 equipment and interest extending into 2029–2030, while admitting that currently planned production will be insufficient in 2027 and 2028. Yet interest in future orders is not the same as accepted, contractually committed purchase orders. Investors are therefore valuing a scarce manufacturing franchise while questioning when that scarcity can actually be monetized.
The stock reaction was not a simple verdict on the quarter. ASML’s Nasdaq ADR fell 3.94% on October 14, closing at $1,650.00 despite record reported margins and the stronger full-year guide; it rose 0.45% to $1,657.44 on October 15. Plausible overlapping explanations include the minor revenue miss, the one-off element in EPS, Q4’s slightly lower 57% gross-margin outlook despite higher revenue, added capacity-ramp costs, a demanding valuation and a broader rotation away from AI-linked stocks amid inflation and interest-rate concerns. The evidence does not isolate the effect of any single factor. There is no substantiated basis to attribute this post-results decline to merger-related share dilution: the Mistral item is an investment revaluation gain, not a disclosed acquisition-dilution charge.
Earnings Call Highlights
The following five strategic takeaways distinguish management’s verified comments from investment interpretation. ASML publishes the call’s prepared-remarks transcript and replay; the separately published full-call transcript is used for relevant analyst Q&A context.
- CFO Roger Dassen: IBM revenue exceeded guidance by almost €0.4 billion, and high-margin productivity upgrades were the primary reason Q3 gross margin exceeded guidance. 💡 Reading Between the Lines: ASML can sell incremental wafer output to customers who already own its equipment, improving customer returns without waiting for a new fab or a full scanner delivery. The valuation question is whether the current intensity of upgrade spending is repeatable, not whether the Q3 boost occurred.
- CEO Christophe Fouquet and CFO Dassen: Customers see advanced-chip shortages through at least 2028 and are seeking 2029–2030 delivery commitments, but ASML has not yet accepted those later-year orders. 💡 Reading Between the Lines: Demand visibility is unusually long, but the conversion of expressions of interest into firm orders remains an execution and allocation decision. ASML is preserving flexibility among major customers rather than declaring years of guaranteed, booked revenue.
- CFO Dassen: Planned EUV and immersion output for 2027–2028 will not satisfy expected demand, so ASML is examining 2028 capacity beyond its previously discussed 30% year-on-year expansion. 💡 Reading Between the Lines: Production capability—not just customers’ willingness to spend—is the critical near-term growth constraint. Investors should monitor factory cycle-time reductions, supplier qualification and upgrade volumes, because excess demand has little value until ASML can ship or monetize it.
- CFO Dassen: Value-based pricing negotiations with key customers are complete; the effects should begin to appear during 2027, with the full impact expected from 2028 onward. 💡 Reading Between the Lines: ASML is seeking a greater share of the economic value generated by scarce lithography capacity, but this is not a 2026 earnings driver. The key modeling question is how much pricing survives alongside rising production-ramp costs, rather than assuming every euro of higher selling price becomes profit.
- CEO Fouquet: Intel has exposed more than one million wafers with High-NA EUV; Samsung and TSMC have announced high-volume-manufacturing adoption plans for 2028 and 2030, respectively. 💡 Reading Between the Lines: The next EUV generation is moving from proof of concept toward customer roadmaps, reinforcing ASML’s technological switching costs. However, adoption milestones and ASML’s nearly 90% High-NA fleet availability do not establish a precise revenue trajectory; shipment schedules and fab integration still determine monetization.
One additional Q&A nuance matters for 2027 margins: Dassen attributed the expected Q4 gross-margin step down from 57.5% to about 57% partly to costs incurred in scaling production. ASML’s new NXE:3800F is specified at 260 wafers per hour versus 230 for the NXE:3800E, a 13.0% throughput improvement (calculated from company-reported specifications: (260 ÷ 230 − 1) × 100), with initial introduction planned in small quantities in early 2027. Higher tool productivity is economically valuable, but neither increased specifications nor announced future capacity automatically translate into immediate recognized revenue.
2. Deep Business Insights
Hidden Metrics That Matter
- 1. The growing installed-base revenue mix, not simply record scanner sales. IBM accounted for 28.2% of total Q3 sales, calculated from company-reported figures: €3,288.8 million ÷ €11,662.0 million × 100 = 28.2%. In Q3 2025 the comparable share was €1,962.2 million ÷ €7,516.0 million × 100 = 26.1%; IBM sales themselves rose (€3,288.8 million ÷ €1,962.2 million − 1) × 100 = 67.6% year over year. The advantage is practical: chipmakers can increase wafer output using upgrades on existing factory floor space, often faster than constructing and qualifying new production lines. ASML’s lithography knowledge, service access, installed equipment base and EUV systems make this a differentiated relationship rather than a commodity service contract. The risk is that Q3’s unusually favorable upgrade mix may not persist every quarter.
- 2. Cash conversion versus actual product-delivery economics. ASML reported Q3 free cash flow of €11.351 billion; divided by €11.662 billion in quarterly revenue, that equals 97.3% (calculated from company-reported figures: €11,351 million ÷ €11,662 million × 100). This is not a normal sustainable free-cash-flow margin: management explicitly linked the cash surge to customer down payments. Non-current contract liabilities rose from €3.366 billion at December 31, 2025, to €9.301 billion at September 27, 2026, an increase of €5.934 billion (calculated from company-reported figures). Contract liabilities are not identical to total customer deposits or the order backlog, and cash receipts can precede shipments and later revenue recognition. The useful signal is customer willingness to commit capital; the accounting discipline is not to capitalize one extraordinary cash quarter as if it were recurring earnings.
Why customers stay with ASML: advanced lithography is an integration problem combining optics, light sources, metrology, overlay control, computational software, uptime and field service. ASML remains the sole commercial supplier of EUV lithography systems, while DUV and installed-base services let it support a broad range of wafer processes. At the leading edge, replacing the lithography stack involves qualification risk, yield impact and potentially lost factory throughput; under constrained capacity, access to ASML’s technology and engineering support can therefore matter as much as nominal machine price. This is a structural explanation of customer preference, not proof that ASML is immune to cycles or export restrictions.
Another mix detail worth tracking: the official investor presentation shows EUV declining from 57% of net system revenue in Q2 to 49% in Q3, even though EUV units sold increased from 16 to 17. The rapid expansion in immersion and other non-EUV activity is a reminder that the company’s earnings power rests on a portfolio, not a single product category. ASML’s 2026 full-year expectation of roughly 20% China revenue is a company outlook, not the observed Q3 percentage, and must not be confused with the presentation’s 23% Q3 China share of systems by shipment destination.
Industry Chain Reactions
- ✅ Potential beneficiary — Micron Technology (NASDAQ: MU): ASML expects 2026 memory-related net system sales to grow around 75%, citing more EUV adoption in advanced DRAM alongside increased capacity construction. Micron, a US-listed DRAM manufacturer and an identified ASML customer in industry reporting, could benefit from better availability and productivity of advanced lithography capacity when scaling sophisticated memory products. This is a conditional operational read-through, not a disclosed Micron order value or a guarantee of relative market-share gains; scarce tools and higher prices can also raise its capital requirements.
- ❌ Potential pressure — Lam Research (NASDAQ: LRCX), within selected legacy multi-patterning steps: broader adoption of more capable EUV patterning can reduce the number of repeated lithography, deposition and etch loops required for some advanced chip layers, creating a possible headwind for equipment tied to those specific flows. ASML’s own published analysis cites roughly 20% fewer process steps when single-patterning EUV replaces multi-patterning DUV in a modeled comparison. This is not a net bearish forecast for Lam: Lam also collaborates on High-NA EUV patterning and supplies EUV-adjacent resist, deposition and etch technology, while 3D semiconductor complexity can increase demand for other Lam tools. The pressure applies to a process subset, not necessarily consolidated revenue.
Valuation Framework and Key Risks
At the latest completed US session covered by this analysis, October 15, 2026, ASML’s Nasdaq ADR closed at $1,657.44. Reuters reported on the same date that an investor characterized ASML’s valuation as roughly 30 times forward earnings, down from more than 45 times in June. That is an approximate contemporaneous market observation, not a freshly recomputed consensus multiple; forward multiples also depend on currency, the earnings definition and the forecast vintage.
A simple multiple-sensitivity framework clarifies the asymmetry without inventing a price target: if the $1,657.44 reference price embeds an approximately 30× forward P/E and forward earnings expectations do not change, a contraction to 25× implies $1,657.44 × 25 ÷ 30 = approximately $1,381.20, or 16.7% below the reference price. A rise to 35× under the same constant-earnings assumption implies approximately $1,933.68, or 16.7% above it. These are purely illustrative arithmetic sensitivities, not management guidance, published analyst targets, forecasts or assertions of fair value. Actual returns depend on earnings revisions, the ADR/euro exchange rate, dividends and market conditions.
The investment debate therefore turns on whether the earnings denominator can grow rapidly enough to offset any compression in the valuation multiple. The more durable positives are the scarce EUV franchise, larger and higher-value installed-base upgrades, expanding DRAM lithography demand, value-based pricing beginning in 2027 and a €4.1 billion Q3 share repurchase. Conversely, investors should examine the following risks rather than extrapolate a single exceptional quarter:
- Supply and execution: ASML expects demand to exceed currently planned 2027–2028 output, but accelerating production requires factory efficiency, stable critical suppliers, and customer fabs that are ready to accept tools.
- Gross-margin normalization: Q3 benefited from a particularly favorable IBM upgrade mix; Q4 guidance around 57% already points to ramp costs partly offsetting greater volume.
- AI spending durability: long-term tool requests depend on customers’ ability to fund fabs and on end demand justifying elevated AI infrastructure spending; rising financing costs and tighter capital markets can change the timing.
- Quality of reported EPS and cash flow: the €509.7 million investment gain is outside operating income, while strong customer prepayments boosted Q3 free cash flow. Neither should be blindly annualized.
- China and technology policy: management expects China to represent around 20% of 2026 net sales, and US/Dutch export-control changes may affect DUV access and the geographic sales mix. Competitive development is a longer-term consideration even if ASML’s EUV position remains difficult to replicate.
- Order conversion and valuation: interest in 2029–2030 capacity is not the same as accepted orders. High valuation sensitivity makes even otherwise positive quarters vulnerable to changes in expected customer spending, discount rates or delivery timing.
What would validate the investment case? Watch actual Q4 IBM sales versus the company’s approximately €3.7 billion outlook, realized gross margin against the approximately 57% guide, low-NA EUV and immersion production progress, cash-prepayment behavior relative to accepted orders, and the timing and economics of the 2027–2028 capacity additions and agreed price increases. June 10, 2027 is the date ASML has set for its next Capital Markets Day, when it plans to update longer-term views; no numeric multi-year revenue forecast should be assumed before management provides one.
3. Key FAQs
Did ASML beat revenue and EPS expectations in Q3 2026?
ASML reported revenue of €11.662 billion versus a pre-release Visible Alpha estimate of €11.71 billion, a miss of approximately 0.4%. Basic EPS of €12.95 exceeded the cited €10.87 EPS expectation by approximately 19.1%; diluted EPS was €12.93. Gross margin of 57.5% also exceeded ASML’s prior 55%–57% guidance. The reported EPS beat includes a €509.7 million non-operating equity-investment revaluation, and a comparable independently verified operating-margin consensus was not available in the public sources reviewed.
Why did ASML stock fall after strong Q3 2026 earnings?
The Nasdaq-listed ASML ADR closed down 3.94% at $1,650.00 on October 14, 2026, before recovering 0.45% to $1,657.44 on October 15. The small revenue miss, non-recurring component of EPS, forecast Q4 margin slightly below Q3, the cost of raising manufacturing output, premium valuation and broad interest-rate-related weakness in AI stocks offer plausible explanations. The company did not disclose an acquisition-dilution event that would justify blaming the move on M&A. These drivers cannot be ranked precisely from available public evidence.
What is ASML’s Q4 2026 guidance, and are EUV systems sold out through 2030?
ASML’s official Q4 guide calls for revenue of €14.2–€15.2 billion, gross margin around 57% and Installed Base Management sales around €3.7 billion. Full-year 2026 guidance is €44–€45 billion in revenue with gross margin around 56%. Management said currently planned 2027–2028 output will not satisfy customer demand, and some customers have expressed interest in tools for 2029–2030. Importantly, ASML said it had not yet accepted those later-year orders, so describing the company as contractually sold out through 2030 would be inaccurate.
Sources: ASML’s official Q3 2026 press release, US GAAP financial statements, investor presentation, official earnings-call prepared-remarks transcript, official CEO/CFO interview transcript, full earnings-call Q&A transcript, pre-release Visible Alpha expectations, historical Nasdaq ADR closes, Reuters market and valuation reporting, and Lam Research’s EUV patterning research.
Disclaimer: This article/chart is for educational and informational purposes only and does not constitute investment advice of any kind. Past performance is not indicative of future results. Investors should independently evaluate their own risks.