


Key Takeaways
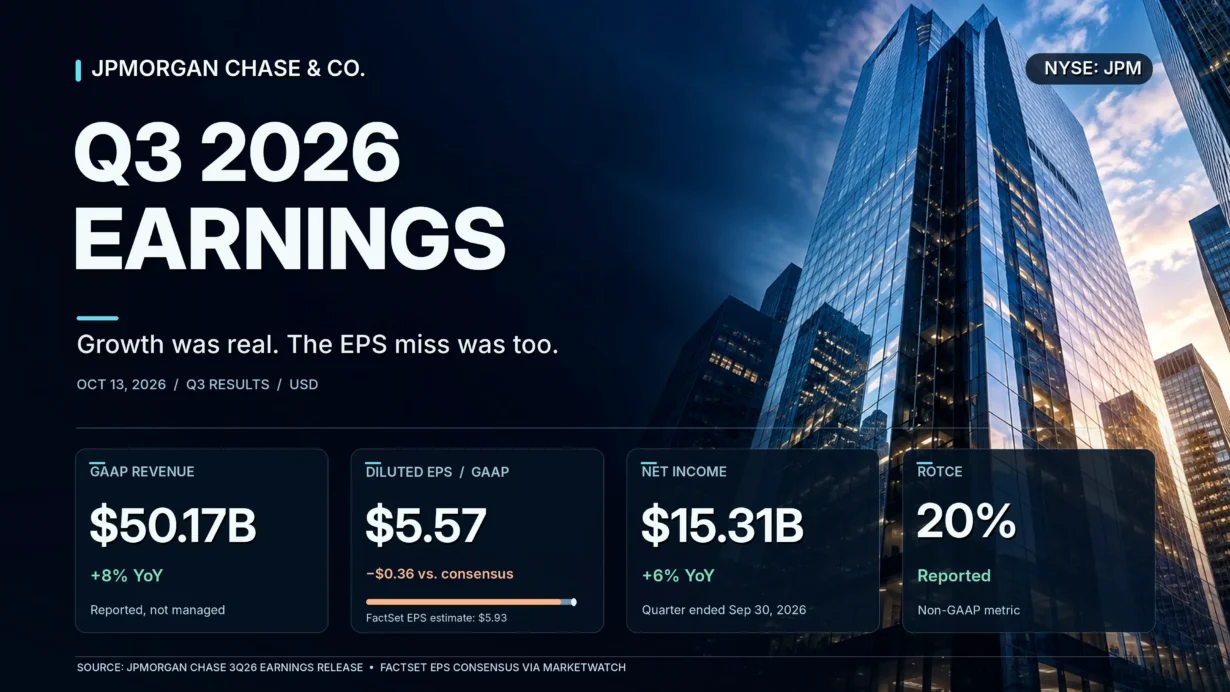
- JPMorgan Chase earned $5.57 per diluted share on $50.172 billion of GAAP revenue in Q3 2026. Both missed the pre-release FactSet consensus, even though revenue rose about 8% year over year.
- A $658 million pretax investment-securities loss reduced EPS by $0.18. Excluding that item, EPS was $5.75, still below FactSet’s $5.93 consensus.
- Commercial & Investment Bank revenue rose 14% year over year, Consumer & Community Banking grew 9%, and Asset & Wealth Management grew 14%; equities trading surged 49%, but fixed-income trading fell 4%.
- Management’s Q4 2026 outlook calls for about $25.5 billion of net interest income excluding Markets, about $28 billion of total net interest income, and about $27.5 billion of adjusted expense. These are guidance figures, not reported results.
- At the October 15 closing price of $335.53, JPM traded at approximately 2.98 times its Q3 tangible book value per share, making sustained returns and disciplined capital deployment central to the investment case.
JPMorgan Chase’s third-quarter results, released on October 13, 2026, are a case study in why a bank’s earnings quality matters more than the headline growth rate. The franchise continued to acquire checking accounts, fund loans, win institutional business and gather client assets. Nevertheless, a securities loss, slower sequential investment-banking activity and expense growth above revenue growth produced an unusual EPS miss. The investment question is not whether JPM’s businesses are strong; it is whether that strength can support the valuation investors are paying.
Core Earnings Breakdown
Revenue and Profitability Analysis
The official Q3 earnings release reports GAAP net revenue of $50.172 billion, up from $46.427 billion a year earlier, and managed revenue of $50.907 billion, up from $47.120 billion. Both increased roughly 8%. Managed revenue is JPMorgan’s fully taxable-equivalent, non-GAAP presentation; it is the appropriate denominator for the company-reported segment revenue mix below. The $735 million gap between managed and reported revenue is not an additional source of earnings.
- Consumer & Community Banking (CCB): Revenue was $21.171 billion, up 9% year over year, or approximately 41.6% of managed firmwide revenue (21.171 / 50.907). Net income reached $5.670 billion, up 13%. Card Services & Auto revenue increased 15%, while debit and credit card sales volume increased 10%. Investment view: growing day-to-day customer relationships makes the funding base more valuable, but CCB expense growth of 12% means customer acquisition must eventually translate into better operating leverage.
- Commercial & Investment Bank (CIB): Revenue was $22.734 billion, up 14% year over year, representing about 44.7% of managed revenue (22.734 / 50.907). Net income climbed 20% to $8.247 billion. Equity Markets revenue rose 49% to $4.954 billion, but Fixed Income Markets revenue slipped 4% to $5.366 billion. Investment-banking fees grew 14% from a year earlier but declined 8% sequentially; Payments revenue rose 14% to $5.620 billion. Investment view: the payments and financing ecosystem strengthens recurring client relationships, whereas exceptionally strong equities trading should not be assumed to repeat every quarter.
- Asset & Wealth Management (AWM): Revenue was $6.909 billion, up 14% year over year, or about 13.6% of the managed total (6.909 / 50.907). Net income rose 11% to $1.843 billion. Assets under management reached $5.210 trillion, up 13%, while the pretax margin was 36%, unchanged from a year earlier and down from 38% in Q2. Investment view: asset and advisory fees diversify the earnings mix, but higher asset prices and adviser-related costs both influence the outcome, so revenue growth alone is not evidence of margin expansion.
- Corporate: Revenue was only $93 million, down $1.610 billion year over year, and the segment posted a $455 million net loss. Its revenue represented about 0.2% of managed firmwide revenue (0.093 / 50.907). Investment view: this small current revenue contribution masks a material year-over-year drag, including the $658 million pretax securities loss; investors should separate this volatility from customer-facing segment performance without treating it as irrelevant to shareholder earnings.
These segment shares are calculated from company-reported figures, using $50.907 billion of managed revenue as the common denominator; they are not separately disclosed mix percentages. Across the firm, net income increased 6% year over year to $15.305 billion, and reported diluted EPS increased 10% to $5.57 from $5.07. Reported return on tangible common equity (ROTCE) was 20%, or 21% excluding the significant securities-loss item. Total net interest income was $27.1 billion, up 13%, while net interest income excluding Markets was $24.7 billion, up 6%.
Profitability was less uniformly encouraging. Noninterest expense rose 12% to $27.295 billion, faster than managed revenue growth of 8%, as compensation, front-office hiring, marketing and technology spending increased. The managed overhead ratio deteriorated to 54% from 52% a year earlier. Credit costs, however, fell to $2.743 billion from $3.403 billion, including approximately $2.2 billion of net charge-offs and a $539 million reserve build. CCB’s Card Services net charge-off rate improved to 2.91%, versus 3.15% in Q3 2025. Credit did not explain the headline disappointment; costs, capital-markets mix and the Corporate securities item did more of the work.
Expectations vs. Actual Results
For an apples-to-apples comparison, the earnings-day benchmark below uses FactSet’s pre-release consensus reported by MarketWatch, not a subsequently revised estimate. Consensus is a historical record of analyst expectations, not company guidance or a reported financial result.
- ❌ GAAP revenue miss: $50.172 billion actual versus $51.23 billion expected, a shortfall of $1.058 billion, or about 2.1% of consensus ($1.058 billion / $51.23 billion). JPM’s $50.907 billion managed revenue is non-GAAP and should not be substituted for GAAP revenue in this comparison without verifying the consensus definition.
- ❌ EPS miss: $5.57 actual diluted EPS versus $5.93 expected, a $0.36 or 6.1% shortfall ($0.36 / $5.93). EPS excluding the significant securities-loss item was $5.75; that adjusted figure also remained $0.18 below the FactSet benchmark.
- ⚠️ Companywide operating margin: No legitimate actual-versus-consensus beat/miss can be assigned. A conventional operating-profit margin is not JPM’s primary bankwide reporting metric, and no reliable pre-release consensus for an identically defined margin was verified. The disclosed actual profitability gauges are the 54% managed overhead ratio, up from 52%, and 20% reported ROTCE. AWM separately disclosed a 36% pretax margin; that is not a companywide margin.
The $0.18 per-share effect of the securities loss accounts for 50% of the $0.36 FactSet EPS miss ($0.18 / $0.36), calculated from company-reported figures and the verified FactSet benchmark. Yet the remaining $0.18 gap after adjustment matters: merely reversing the discretionary investment-securities loss would not have delivered an earnings beat. The underlying issues included slower sequential investment-banking fees, a 4% decline in fixed-income trading, and operating expenses growing faster than revenue. A 49% increase in equities trading partially offset, rather than erased, those headwinds.
Management provided the following forward-looking outlook in the official financial-results presentation:
- Q4 2026 net interest income excluding Markets: approximately $25.5 billion.
- Q4 2026 total net interest income: approximately $28 billion.
- Q4 2026 adjusted expense, excluding firmwide legal expense: approximately $27.5 billion.
- Implied full-year 2026 totals: approximately $97.2 billion of net interest income excluding Markets, $106.2 billion of total net interest income and $108.6 billion of adjusted expense.
- Full-year 2026 Card Services net charge-off rate: approximately 3.2%. Preliminary 2027 central case: approximately $107 billion of net interest income excluding Markets.
These figures are management guidance, are subject to market conditions and should not be presented as achieved Q4 or 2027 results. JPM did not provide a specific Q4 diluted EPS target, all-in revenue target or bankwide operating-margin target in those outlook figures. For valuation, the most relevant tension is now between higher expected interest income and higher expenses, rather than between a single quarterly EPS number and the consensus.
The price response was mixed, not a simple rejection of the franchise. Shares closed at $331.43 on the October 13 earnings date, down 0.86% from the October 12 close of $334.30, after opening at $339.97 and trading as high as $344.36. They recovered to $335.28 on October 14 and $335.53 on October 15, approximately 0.37% above the pre-release close (($335.53 / $334.30) − 1), calculated from verified historical closing prices. These are verified historical closing prices, not an assertion about the reason behind every trade. The initial weakness is consistent with disappointment over EPS quality, the sequential investment-banking slowdown and weaker operating leverage; subsequent gains suggest the market also recognized the stronger lending and NII outlook. There is no basis in the disclosed results to ascribe the move to acquisition dilution or to dismiss it merely as “sell the news.”
Earnings Call Highlights
The following five management points are accurate paraphrases of the official October 13, 2026 earnings-call transcript, rather than invented verbatim quotations.
CEO Jamie Dimon: Organic growth and attractive client financing opportunities take priority over buybacks; the Security and Resiliency Initiative has a $1.5 trillion, ten-year deployment ambition.
💡 Reading Between the Lines: Lower repurchases are not automatically a warning about solvency: management believes reinvesting capital can offer better long-term returns at the current share valuation. The $1.5 trillion initiative is a multi-year financing and deployment ambition, not reported quarterly earnings or an additional $1.5 trillion of loans already on the balance sheet.
CFO Jeremy Barnum: The preliminary 2027 net-interest-income-excluding-Markets central case is about $107 billion, with roughly one-quarter of its proposed increase from the Q4 annualized run rate tied to the rate curve.
💡 Reading Between the Lines: The bridge is principally a balance-sheet-growth thesis rather than a pure rate-hike trade. Deposit repricing, customer migration to higher-yield products and changes in the forward curve could materially alter that central case.
CEO Jamie Dimon and CFO Jeremy Barnum: The investment-banking pipeline remains substantial, but bond-market volatility and disagreement over valuations may delay deal completion.
💡 Reading Between the Lines: Pipeline activity is not recognized fee revenue, and an unsigned or delayed transaction should not be booked into a model. The quarter exposed how quickly an apparently healthy M&A and IPO environment can translate into weaker near-term monetization.
CFO Jeremy Barnum and CEO Jamie Dimon: JPM will defend its primary-banking relationships and customer trust against fintech and autonomous-agent competition, rather than chase every yield-sensitive deposit.
💡 Reading Between the Lines: The bank is protecting the economics of stable everyday accounts, not promising to match the highest available savings rate. AI agents could lower customer switching friction, while security controls and a broad service bundle remain potential differentiation points.
CEO Jamie Dimon: JPM’s through-the-cycle ROTCE objective remains 17%, notwithstanding the current quarter’s reported 20% ROTCE.
💡 Reading Between the Lines: The premium valuation should be assessed against a cycle-average return, not against peak market activity and benign credit conditions. If returns normalize toward 17%, investors may reassess how much they will pay for each dollar of tangible equity.
Deep Business Insights
Hidden Metrics That Matter
First, incremental revenue absorption reveals an earnings-quality issue hidden by strong segment growth. Managed revenue increased by $3.787 billion year over year, while noninterest expense increased by $3.014 billion. The simple calculation is $3.014 billion / $3.787 billion = 79.6%. In other words, roughly 80 cents of each additional dollar of reported managed revenue was matched by incremental operating expense before considering changes in credit losses and taxes. This is calculated from company-reported figures, not a margin or efficiency statistic separately reported by JPM. The unusual Corporate securities loss depresses the revenue comparison, so 79.6% should not be extrapolated as the bank’s normalized marginal cost ratio. Even with that caveat, it highlights why higher activity and more hiring need to turn into better operating leverage.
Second, management’s 2027 interest-income bridge reveals what must go right beyond interest-rate movements. Annualizing the Q4 2026 net-interest-income-excluding-Markets guide gives $25.5 billion × 4 = approximately $102 billion. The preliminary 2027 central case of $107 billion implies a roughly $5 billion difference. Barnum said approximately one-quarter of that difference relates to the yield curve: 25% × $5 billion = about $1.25 billion; the other 75% × $5 billion = approximately $3.75 billion relates mainly to balance-sheet growth and mix. These are calculated from company-reported guidance and management’s approximate verbal allocation, not actual 2027 revenue or independently predicted results. The valuation implication is that the quantity and quality of deposits and loans matter at least as much as the direction of interest rates.
Why do customers choose JPMorgan instead of a bank offering a higher headline deposit rate? Management reported more than 650,000 net new checking accounts in the quarter and cited the combined benefits of branches, payments, cards, business banking, digital access, investment services and institutional-scale risk controls. A customer’s primary account becomes embedded in salary deposits, bills, cards, savings and investment workflows. That integration can create switching costs and support lower-cost funding, although it does not eliminate competition from high-yield products or AI-assisted account switching. For corporate customers, JPM’s payments, lending, custody and capital-markets capabilities reduce the need to coordinate multiple providers; the resulting relationship can be more durable than a single trading or advisory transaction.
Industry Chain Reactions
- ✅ Potential beneficiary — Visa (NYSE: V). JPM reported 10% year-over-year growth in debit and credit card sales volume. This is a positive read-through for the consumer-payments ecosystem and potentially for network operators such as Visa. It is not a direct measurement of Visa-processed volume, nor proof of incremental Visa earnings, because JPM’s card spending is not exclusively routed through one network.
- ❌ Potential competitive pressure — SoFi Technologies (NASDAQ: SOFI). JPM’s more-than-650,000 net new checking accounts, bundled banking proposition and stated focus on primary-bank share show the scale digital-first competitors must overcome to win lasting deposit relationships. This is a competitive inference, not a claim that SoFi lost deposits, revenue or market share in Q3; digital entrants can still grow by offering differentiated rates and customer experiences.
Valuation Framework and Key Risks
At the verified October 15, 2026 regular-session closing price of $335.53, JPM’s price-to-tangible-book-value ratio was approximately 2.98 times: $335.53 / $112.64 of quarter-end tangible book value per share = 2.98×. Using reported book value per share of $132.30 yields approximately 2.54× ($335.53 / $132.30). These are calculated from company-reported figures and a verified market close, not company-disclosed valuation multiples or forward valuation estimates. Tangible book value is a useful reference for a bank because the durability of returns on tangible equity directly influences the premium investors are willing to pay.
The central question at nearly three times tangible book is whether JPM can sustain a material return premium while funding growth. Reported ROTCE of 20% looks attractive, but Dimon reiterated a 17% through-the-cycle objective. A valuation that implicitly rewards exceptional returns may be sensitive to even modest normalization in trading profitability, deposit spreads or credit costs. A higher NII outlook supports the bullish case, but it does not automatically offset expense increases, higher risk-weighted assets or a weaker fee cycle.
- Interest-rate and deposit-beta risk: A higher yield curve can support asset income but also encourages customers to shift into higher-paying products. The interest-income central case is conditional, not guaranteed.
- Capital-markets cyclicality: Equity Markets revenue increased 49% year over year while Fixed Income Markets declined 4%. Investment-banking fees fell 8% from Q2. Strong pipelines do not remove timing and execution risk.
- Expense discipline and credit normalization: Firmwide expense grew 12% versus 8% managed revenue growth. Credit losses were manageable in Q3, but a 3.2% full-year Card Services charge-off outlook remains a relevant underwriting benchmark.
- Capital allocation and regulation: The standardized CET1 ratio fell to 13.9% from 14.2% in Q2 as risk-weighted assets and capital distributions increased. Common stock net repurchases were $664 million for the quarter, far below the $4.4 billion common dividend distribution; faster balance-sheet growth consumes regulatory capital.
- AI, security and competitive pricing: Automated financial agents may make rate shopping and cash movement easier. JPM’s scale, trust and risk infrastructure are strengths, but they have real operating costs and do not make the deposit franchise immune to disruption.
For the next reporting cycle, the highest-value checkpoints are actual NII excluding Markets versus management’s roughly $25.5 billion Q4 guide, realized investment-banking fees rather than the pipeline narrative, managed overhead ratio, credit losses, deposit mix and standardized CET1. A sustained improvement across those measures would support paying a premium for JPM’s franchise; deterioration would test the current multiple more severely than a one-quarter securities loss alone.
Key FAQs
Did JPM beat or miss Q3 2026 earnings expectations?
JPM missed the verified FactSet pre-release consensus: diluted EPS was $5.57 versus $5.93 expected, while GAAP revenue was $50.172 billion versus $51.23 billion expected. EPS excluding the $658 million pretax securities-loss item was $5.75, still below that FactSet benchmark. Managed revenue of $50.907 billion is a different, non-GAAP measure.
What was JPMorgan Chase’s Q4 2026 earnings guidance after Q3?
JPM guided to approximately $25.5 billion of Q4 net interest income excluding Markets, $28 billion of total Q4 net interest income and $27.5 billion of Q4 adjusted expense. Its implied full-year outlook was approximately $97.2 billion of net interest income excluding Markets, $106.2 billion of total net interest income and $108.6 billion of adjusted expense. It did not announce a specific Q4 EPS or consolidated-revenue target in these guidance figures.
Is JPM stock expensive after the Q3 2026 earnings report?
At $335.53 per share on October 15, 2026, JPM traded at about 2.98 times its $112.64 tangible book value per share. That premium can be justified only if JPM’s high returns, customer relationships and capital discipline remain resilient. With reported Q3 ROTCE at 20% versus management’s 17% through-the-cycle goal, investors should stress-test normalized returns and credit costs rather than extrapolate a single quarter.
Sources: JPMorgan Chase’s official Q3 2026 earnings press release, official earnings-call transcript, earnings presentation, pre-release FactSet consensus published by MarketWatch, and historical JPM closing prices sourced from S&P Global Market Intelligence; see also JPMorgan Chase Investor Relations. Financial results are for the quarter ended September 30, 2026; share-price and valuation observations are as of the October 15, 2026 close.
Disclaimer: This article/chart is for educational and informational purposes only and does not constitute investment advice of any kind. Past performance is not indicative of future results. Investors should independently evaluate their own risks.