

Key Takeaways
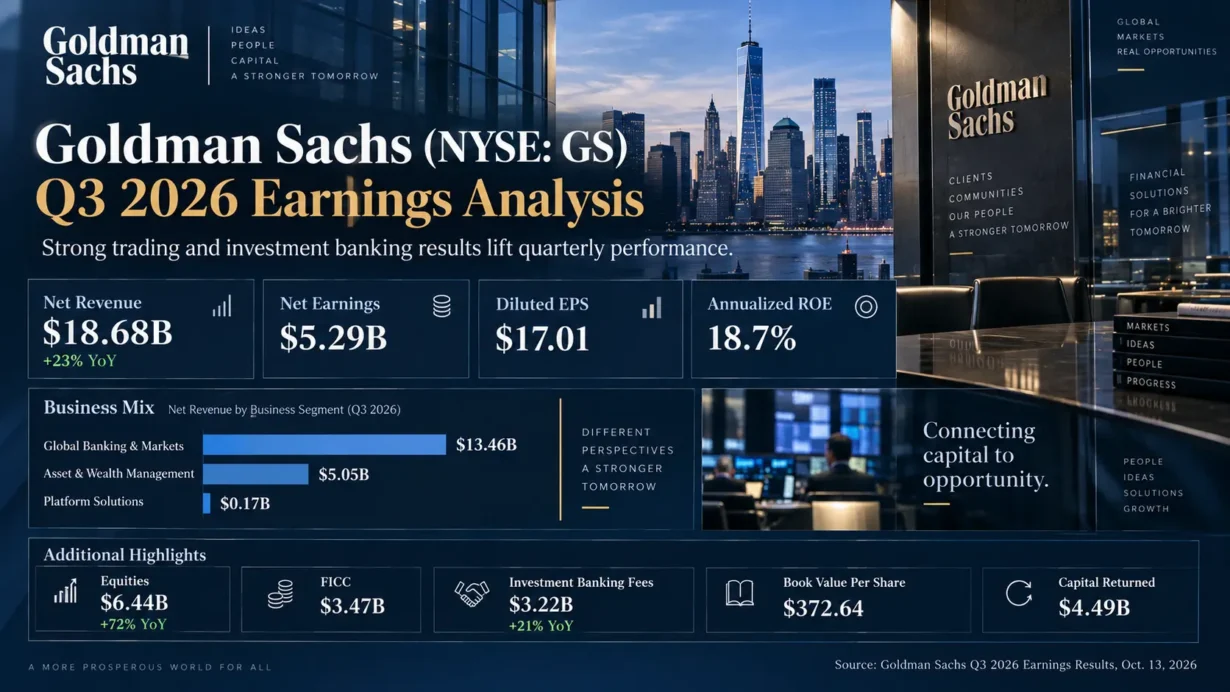
- Goldman Sachs reported Q3 2026 net revenues of $18.679 billion, up 23% year over year, net earnings of $5.294 billion, and diluted EPS of $17.01, well above FactSet’s $12.86 EPS consensus.
- Equities revenues rose 72% to $6.441 billion, led by a 96% increase in equities financing. Financing generated 52.2% of quarterly equities revenues (calculated from company-reported figures).
- Investment banking fees grew 21%, but the investment banking backlog declined sequentially. Record advisory revenue and a still-robust pipeline are not the same as guaranteed next-quarter conversion.
- Asset & Wealth Management attracted $97 billion in long-term assets-under-supervision inflows; management and other fees increased 22%, though $587 million of incentive fees warrants separate scrutiny.
- At the October 15 U.S. close of $891.28, GS traded at approximately 2.39 times quarter-end book value. The valuation still requires a judgment about sustainable returns, not merely the reported earnings beat.
Published using information available through October 15, 2026, after the U.S. regular-session close. All monetary figures are in U.S. dollars unless noted.
GS Q3 2026 earnings offer a revealing test of Goldman Sachs’ business model. The headline earnings surprise was exceptionally strong, but the more consequential question is whether higher equity-financing balances, recurring asset-management fees, and premium advisory relationships can support attractive returns when volatile trading activity and unusually large incentive fees normalize. The answer has direct implications for how investors should interpret the stock’s premium to book value.
Verification standard: financial results and segment data below come from Goldman Sachs’ October 13 earnings release, its official earnings presentation, and the associated SEC-filed exhibits. Goldman Sachs makes the official earnings webcast available; no Goldman Sachs-hosted written transcript was located during this review. Management-call discussion is therefore accurately paraphrased from a public third-party transcript, cross-checked against a second published transcription and company materials. Third-party consensus and share-price figures are identified separately.
1. Core Earnings Breakdown
Revenue and Profitability Analysis
Q3 net revenues were $18.679 billion versus $15.184 billion one year earlier, an increase of 23%, although they declined 8% from Q2 2026. Net earnings rose 29% year over year to $5.294 billion, while diluted EPS increased 39% from $12.25 to $17.01. Annualized return on average common equity was 18.7%, and return on average tangible common equity was 20.5%. These are formidable returns, but both were lower than in the exceptionally strong second quarter.
Revenue mix by business segment was approximately 72.0% Global Banking & Markets, 27.0% Asset & Wealth Management, and 0.9% Platform Solutions. These shares are calculated from company-reported figures: segment net revenues of $13,458 million, $5,051 million, and $170 million, respectively, divided by firmwide net revenues of $18,679 million. Rounded shares may not sum to precisely 100.0%.
- Global Banking & Markets: $13.458 billion in net revenues, up 32% year over year but down 13% quarter over quarter. Investment banking fees increased 21% to $3.224 billion, including record advisory revenue of $1.654 billion (up 18%) and equity underwriting revenue of $666 million (up 43%). Equities generated $6.441 billion, up 72%, comprising $3.365 billion of financing (up 96%) and $3.076 billion of intermediation (up 52%). FICC generated $3.471 billion, down 1% year over year and 24% sequentially, with weaker rates, mortgage, and credit intermediation partly offset by other products and financing. Investment judgment: Goldman has differentiated access to both transaction fees and balance-sheet-intensive client financing, but its exposure to market activity remains substantial.
- Asset & Wealth Management: $5.051 billion in net revenues, up 14% year over year and 10% sequentially. Management and other fees reached $3.587 billion, up 22%, on higher average assets under supervision. Incentive fees were $587 million, versus $76 million a year earlier; private banking and lending revenue declined 22% to $827 million, while investment revenues fell 85% to $50 million. Investment judgment: expanding fee-bearing client assets improve earnings quality, but the incentive-fee surge and investment markdowns should not be mistaken for a smooth recurring revenue stream.
- Platform Solutions: $170 million in net revenues, down 72% year over year and 23% sequentially, with a $95 million segment pre-tax loss. The company attributed the decline principally to markdowns associated with the Apple Card loan portfolio transferred to held for sale in late 2025. Investment judgment: the segment is now small relative to core businesses, yet unresolved portfolio economics can still consume earnings and management attention.
Operating expenses totaled $11.308 billion, up 20% year over year, reflecting higher transaction-based costs, compensation, and accelerated charitable giving. The company’s reported Q3 efficiency ratio was 60.5%, an improvement of 1.8 percentage points year over year; the separately reported year-to-date efficiency ratio was 59.4%. Credit-loss provisions were $368 million, versus $102 million in Q2, primarily reflecting wholesale-loan impairments. Pre-tax earnings were $7.003 billion, up 30% year over year. For investors accustomed to an industrial company’s operating margin, the closest useful firmwide comparison here is pre-tax margin, approximately 37.5% ($7,003 million / $18,679 million; calculated from company-reported figures), not a separately published GAAP operating-margin line.
Expectations vs. Actual Results
The following comparisons use FactSet’s pre-release consensus as cited by MarketWatch, rather than mixing estimates from different vendors:
- ✅ Revenue beat: $18.679 billion reported versus $16.83 billion expected, a $1.849 billion upside surprise, or approximately 11.0% of consensus (calculated from company-reported figures and cited FactSet consensus).
- ✅ EPS beat: $17.01 diluted EPS reported versus $12.86 expected, a $4.15 beat, or approximately 32.3% of consensus (calculated from company-reported figures and cited FactSet consensus).
- ⚪ Operating margin / pre-tax margin: 37.5% actual pre-tax margin (calculated from company-reported figures); 60.5% company-reported quarterly efficiency ratio. No directly comparable, independently verifiable FactSet consensus was found for either measure, so a margin beat or miss is not asserted.
The revenue surprise was driven principally by Global Banking & Markets, where $13.458 billion exceeded FactSet’s $11.86 billion segment consensus by about 13.5% (calculated from company-reported figures and cited FactSet consensus). Equities financing, derivatives intermediation, advisory, and underwriting were the main fundamental engines. The EPS surprise was not manufactured by an unusually low charitable expense: CFO Denis Coleman said an approximately $450 million accelerated donation reduced quarterly EPS by about $1; management indicated EPS would have been approximately $18 without that charge. This approximately $18 figure is management’s illustrative adjustment, not GAAP EPS or an independently calculated normalized earnings forecast.
For GS, the market’s more useful focal points are the sustainability of equity-financing spreads and balances, conversion of investment banking mandates, the asset-management fee mix, operating efficiency, and capital deployment. The outstanding headline quarter did not resolve all of them. In particular, the company disclosed that the investment banking backlog declined from Q2 and was slightly lower than at year-end 2025, notwithstanding management’s description of the remaining backlog as robust. Q3 equities revenue was also 13% below Q2, while FICC was 24% lower sequentially.
The initial trading reaction diverged from the reported beat. A published historical-price series shows GS reached $931 intraday on the October 13 earnings date, versus its previous $893.95 close, before finishing at $891.91, about 0.23% below the prior close (calculated from the cited historical prices). The separate October 15 closing quote was $891.28. An intraday price surge should not be confused with the full-day close. There is no demonstrated single cause of the reversal: a sequential slowdown, a lower backlog, relatively high book-value valuation, the sensitivity of financing to funding costs, and concerns about whether outsize trading gains repeat are all plausible contributors. No verified evidence establishes acquisition-related dilution as the cause; Goldman’s pending NEOS acquisition includes a cash-and-equity component, but its quarter-specific EPS dilution has not been quantified here.
Next-quarter guidance requires equally careful separation. Goldman Sachs did not provide a verified numerical Q4 2026 firmwide revenue, EPS, or pre-tax-margin forecast in the reviewed release and call. Management did say that Q4 incentive fees were expected to remain elevated and that another meaningful charitable contribution was planned. It indicated full-year 2026 gross third-party alternatives fundraising of roughly $150 billion after $122 billion raised through September, and an approximately 20% full-year effective tax rate. These are management’s stated expectations and full-year indications, not reported Q4 results, analyst projections, or a company-issued Q4 EPS target.
Earnings Call Highlights
Each point below is an attributed paraphrase of management’s October 13 comments rather than a purported verbatim quotation from an official written transcript.
- CEO David Solomon and CFO Denis Coleman: equity and FICC financing produced a record $12.7 billion year to date, more than 40% of combined markets revenue; equity-financing demand continues to exceed available industry capacity.
💡 Reading Between the Lines: Management is steering investors toward a larger, potentially more durable spread-and-financing franchise rather than a pure trading-volume story. The offset is more balance-sheet usage, counterparty exposure, and sensitivity to funding conditions. - CEO David Solomon: Goldman remained the leading M&A adviser by announced deal volume, with about $1.5 trillion of year-to-date announced transactions, while management viewed the remaining banking backlog as robust.
💡 Reading Between the Lines: The franchise’s competitive position can feed advisory and financing work across several periods, but the officially reported sequential backlog decline argues against automatically projecting Q3’s record advisory revenue into Q4. - CEO David Solomon: $97 billion of long-term assets-under-supervision inflows supported a record approximately $4.1 trillion asset base; alternatives fundraising reached $122 billion year to date, with a stated full-year expectation of roughly $150 billion.
💡 Reading Between the Lines: Institutional and wealthy-client distribution is a powerful customer-acquisition advantage for scalable fees. Still, the $587 million incentive-fee quarter shows why investors must separate recurring management fees from episodic performance-linked income. - CFO Denis Coleman: an approximately $450 million accelerated charitable contribution reduced Q3 EPS by roughly $1, and management planned another meaningful contribution in Q4.
💡 Reading Between the Lines: The Q3 GAAP profit figure includes a deliberate, partly discretionary expense rather than only underlying operating costs. A second contribution could depress reported Q4 comparisons, but its amount and EPS effect should not be invented before disclosure. - CEO David Solomon: AI-related infrastructure financing presents significant client opportunities, but the firm intends to be selective about underwriting risks and committing capital.
💡 Reading Between the Lines: Goldman wants to monetize the financing, hedging, and advisory ecosystem surrounding large technology investment without indiscriminately carrying long-duration or concentrated exposures. Credit discipline matters as much as transaction volume to the valuation premium.
2. Deep Business Insights
Hidden Metrics That Matter
- Equities financing’s growing share of the equities franchise: $3,365 million / $6,441 million = 52.2% in Q3 2026, versus $1,716 million / $3,736 million = 45.9% in Q3 2025 (both calculated from company-reported figures). Crucially, financing revenue still grew 3% sequentially even as equities intermediation fell 26%. This explains why an apparently cyclical trading franchise is acquiring a different mix: clients repeatedly need prime brokerage, securities financing, portfolio leverage, derivatives execution, and risk infrastructure. They may prefer Goldman because it integrates those services with underwriting, collateral management, global distribution, and a large balance sheet. Financing is generally more relationship-driven than opportunistic trading, but it is not risk-free recurring subscription revenue; utilization, collateral values, funding costs, and capital requirements can change quickly.
- The asset-flow bridge hidden behind headline assets under supervision: starting AUS of $4,041 billion + $97 billion of long-term net inflows − $14 billion of liquidity-product outflows − $27 billion of net market depreciation = $4,097 billion ending AUS (reconciliation calculated from company-reported figures). Assets rose only $56 billion quarter over quarter even though aggregate net client inflows were $83 billion. This matters because flow-driven asset growth is a stronger signal of distribution and client preference than market appreciation alone. The business’s appeal is its combination of long-established institutional relationships, ultra-high-net-worth advice, public and private investment solutions, and expanding third-party channels. Management and other fees represented 71.0% of Q3 Asset & Wealth Management revenue ($3,587 million / $5,051 million; calculated from company-reported figures), illustrating a substantial fee-based foundation without pretending every component is equally recurring.
Assets under supervision should not automatically be called assets under management: Goldman defines AUS more broadly and includes certain assets for which it lacks full investment discretion. Likewise, asset inflows do not immediately translate one-for-one into revenue; timing, product fee rates, fee waivers, and client mix affect monetization. A useful investment test for subsequent quarters is whether higher long-term inflows translate into steadily rising management fees even without exceptional IPO-driven incentive receipts.
Industry Chain Reactions
- ✅ Potential beneficiary — Morgan Stanley (NYSE: MS). Goldman’s record equities-financing performance offers independent evidence of robust institutional demand for equity exposure, hedging, and related financing. Morgan Stanley’s own official Q3 release showed equities net revenue of $5.799 billion versus $4.116 billion a year earlier, approximately 41% growth, corroborating an industrywide activity tailwind. This is a shared-market-demand inference, not a claim that Goldman transfers earnings to Morgan Stanley.
- ❌ Potential competitive pressure — JPMorgan Chase (NYSE: JPM), specifically its options-income ETF offering. Goldman announced an agreement to acquire NEOS Investments, whose derivative-income ETFs would broaden Goldman’s actively managed income products and distribution when the transaction closes. JPMorgan already markets JEPI, JEPQ, and additional derivative-income ETFs. More scaled competition could pressure flows, product differentiation, or fees within that product niche; no measured loss of JPMorgan market share or Q3 earnings impact is established, and the Goldman transaction remained pending at the time of the earnings call.
These are exposure and competition pathways, not deterministic stock-return predictions. See the Morgan Stanley Q3 filing, Goldman’s NEOS transaction announcement, and J.P. Morgan Asset Management’s ETF release for the underlying facts.
Valuation Framework and Key Risks
Using the independently reported October 15, 2026 U.S. closing price of $891.28 and Goldman’s September 30 book value per common share of $372.64, price to book was about 2.39 times ($891.28 / $372.64; calculated from company-reported figures and a dated market quote). This is a meaningful premium to accounting equity, consistent with the market recognizing the earning power of advisory, prime brokerage, and asset management. It also leaves less room for a sustained decline in returns on equity.
A deliberately backward-looking earnings cross-check is approximately 12.8 times the sum of the last four reported quarterly diluted EPS figures: $14.01 (Q4 2025) + $17.55 (Q1 2026) + $20.98 (Q2 2026) + $17.01 (Q3 2026) = $69.55; $891.28 / $69.55 = 12.8 times (calculated from company-reported figures and a dated market quote). Because each quarterly EPS is rounded and quarterly share counts differ, this is an approximate four-quarter calculation, not a company-reported TTM ratio. It is not a forward P/E or an earnings forecast. The multiple can look superficially reasonable if unusually strong markets income is treated as permanent; that assumption is the central valuation risk.
Capital allocation deserves equal weight. Goldman disclosed $3.00 billion of Q3 share repurchases at an average price of $1,048.73 per share, substantially above the October 15 quote. The later quote was about 15.0% below that historical repurchase price (($1,048.73 − $891.28) / $1,048.73; calculated from company-reported figures and the dated market quote). This does not prove the repurchases were value-destructive: the proper question is whether buying shares at the time’s price offered better long-term returns than retaining the capital for clients, acquisitions, or a stronger regulatory buffer.
Regulatory and credit capacity are constraints on the thesis. The company reported a 12.4% standardized CET1 ratio against an 11.4% current requirement, a 100-basis-point buffer. Loans increased to $276 billion from $261 billion in Q2, while quarterly credit-loss provisions increased to $368 million from $102 million. Higher balances can support financing income but also create risk if collateral prices fall, borrowing costs jump, or counterparties weaken. The pending NEOS acquisition offers distribution expansion but creates execution and capital-allocation considerations; it should not be assigned a specific EPS-accretion or dilution figure without a verified company disclosure.
For a disciplined investment decision, the most revealing future checkpoints are whether financing demand and pricing hold as market conditions change; whether advisory and underwriting replace completed mandates fast enough to rebuild backlog; whether long-term AUS inflows generate management-fee growth independently of incentive realizations; and whether ROE remains comfortably above the firm’s cost of equity while regulatory capital stays adequate. The downside case is not simply that Q4 earnings fail to match an unusually strong Q3; it is that the market stops capitalizing volatile revenue at a premium multiple of book value.
3. Key FAQs
Did Goldman Sachs beat earnings expectations in Q3 2026?
Yes. Goldman Sachs reported $18.679 billion in net revenues versus FactSet consensus of $16.83 billion and $17.01 diluted EPS versus FactSet consensus of $12.86. Revenue and EPS were above expectations, but a directly comparable market consensus for firmwide pre-tax or operating margin was not independently verified, so no margin beat is claimed.
What did Goldman Sachs management say about Q4 2026 guidance?
Management did not provide a verified numerical Q4 revenue or EPS target. It expected incentive fees to remain elevated in Q4, planned another meaningful charitable contribution, indicated full-year alternatives fundraising of roughly $150 billion, and maintained an approximately 20% full-year tax-rate expectation. These are company statements about the outlook, not Q4 results or third-party earnings forecasts.
Is GS stock expensive after its Q3 2026 earnings report?
At the October 15, 2026 closing quote of $891.28, GS traded at approximately 2.39 times September 30 book value and 12.8 times a simple sum of the four most recently reported quarterly diluted EPS figures. Neither multiple answers the question alone: valuation depends on whether equity financing, advisory share, and growing asset-management fees can support premium profitability without undue credit, funding, or capital-allocation risk.
Sources: the Goldman Sachs Investor Relations website, official Q3 2026 press release, official results presentation, official earnings-call webcast, third-party call transcript and October 15 closing quote, FactSet EPS consensus reporting, FactSet revenue consensus reporting, and historical daily share prices.
Disclaimer: This article/chart is for educational and informational purposes only and does not constitute investment advice of any kind. Past performance is not indicative of future results. Investors should independently evaluate their own risks.