


Key Takeaways
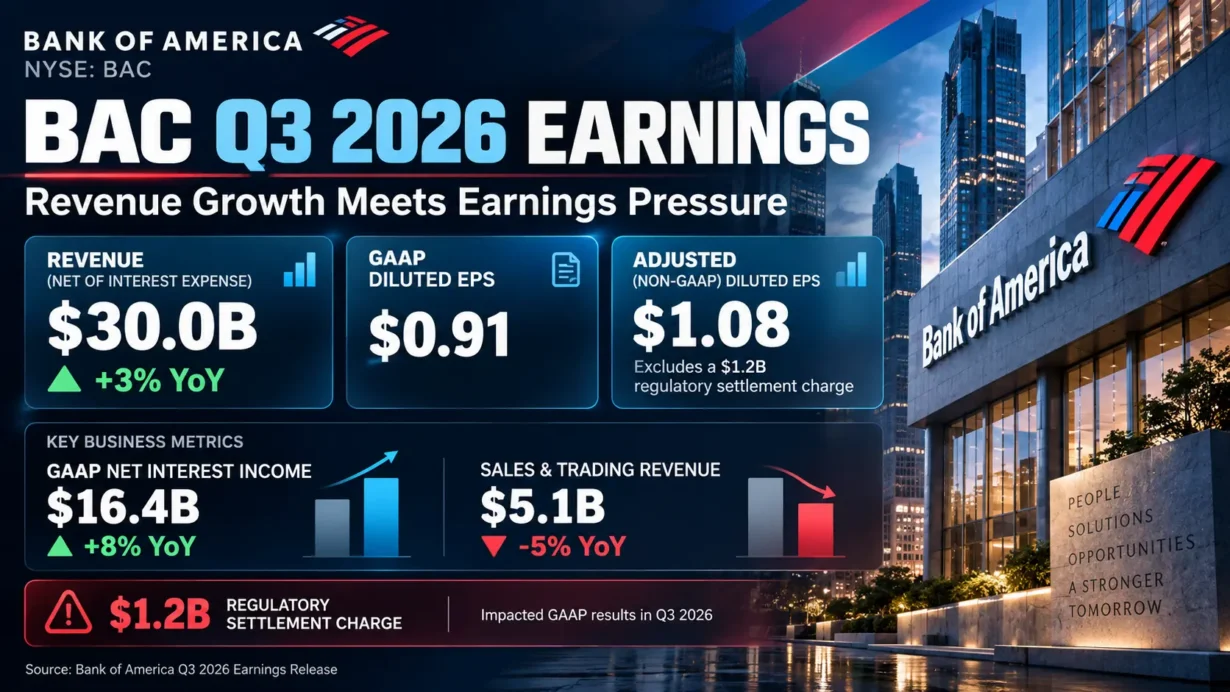
- Bank of America (NYSE: BAC) reported Q3 2026 revenue of $29.958 billion, up 3.2% year over year, net income of $6.933 billion and GAAP diluted EPS of $0.91. Excluding a $1.2 billion regulatory settlement charge, company-defined adjusted EPS was $1.08.
- Both revenue and adjusted EPS missed the FactSet consensus cited immediately after the release: $30.58 billion and $1.10, respectively. The quarter was not an earnings beat disguised by a one-time charge.
- GAAP net interest income (NII) rose 8% to $16.449 billion, while Global Markets sales and trading revenue fell 5% and corporation-wide investment banking fees declined 11%. Wealth management was the standout, with segment revenue up 13%.
- Management expects NII to rise sequentially in Q4 2026, approximately 8% for full-year 2026 and at least 8% in 2027. The 2027 outlook assumes three additional 25-basis-point interest-rate increases through June 2027; these are management assumptions, not reported outcomes.
- BAC fell 4.76% on the October 14 earnings date, then closed at $51.70 on October 15. That price equaled approximately 1.77 times Q3 tangible book value per share, against continuing regulatory, capital and securities-duration risks.
Bank of America released its third-quarter results on October 14, 2026, for the period ended September 30. The investment question is not whether a one-time regulatory charge distorted headline earnings—it did. The more important question is whether the bank can convert accelerating balance-sheet income and wealth-management momentum into durable shareholder returns while repairing control failures, absorbing capital-market volatility and managing interest-rate exposure. All financial results below are historical company disclosures unless explicitly labeled as a calculation or management outlook. Market prices are stated as of the October 15, 2026 U.S. market close.
1. Core Earnings Breakdown
Revenue and Profitability Analysis
Consolidated revenue, net of interest expense, was $29.958 billion versus $29.040 billion in Q3 2025, an increase of approximately 3.2%. GAAP net income decreased from $8.332 billion to $6.933 billion, and diluted EPS fell from $1.04 to $0.91. The decline reflects the $1.2 billion non-tax-deductible settlement expense and weaker capital-markets earnings, rather than a broad collapse in lending or consumer credit. On the company’s non-GAAP basis excluding the settlement, adjusted net income was $8.1 billion and adjusted EPS was $1.08. These adjusted figures should never be substituted for the reported GAAP results without identification.
The earnings engine was unusually divided. GAAP NII increased to $16.449 billion from $15.233 billion, supported by loan growth, deposit balances, fixed-rate asset repricing and Global Markets activity. Noninterest income, however, declined to $13.509 billion from $13.807 billion. In other words, the entire increase in consolidated revenue came from NII, while market-sensitive fees and trading activity offset some of that benefit. Net interest yield on the company’s fully taxable-equivalent (FTE) basis increased to 2.16% from 2.01%.
Below, business-line revenue shares use the sum of the four operating segments’ FTE revenues, $30.762 billion ($11.572B + $7.118B + $6.205B + $5.867B), as the denominator. These are calculated from company-reported figures. They are not shares of consolidated GAAP revenue because segment results are presented on an FTE basis and the negative All Other segment plus the FTE reconciliation must be taken into account.
- Consumer Banking — $11.572 billion revenue, up approximately 3.6%; 37.6% of the four operating segments’ combined revenue; $3.521 billion net income. Average deposits were approximately $949 billion, checking account growth continued for a 31st consecutive quarter, and combined credit/debit card spending rose 8% to nearly $266 billion. Investment judgment: the deposit-and-payments franchise supports low-cost funding and cross-selling, although consumer revenue growth remains moderate rather than explosive.
- Global Wealth & Investment Management — $7.118 billion revenue, up approximately 12.8%; 23.1% of operating-segment revenue; $1.540 billion net income. Asset-management fees rose 16% to approximately $4.5 billion, client balances reached $5.1 trillion and the segment’s pretax margin improved to 29% from 27%. Investment judgment: recurring advisory fees and affluent-client lending diversify earnings away from trading, but asset-based fees remain vulnerable to a market correction.
- Global Banking — $6.205 billion revenue, up approximately 0.3%; 20.2% of operating-segment revenue; $1.990 billion net income. Average loans grew 8% and deposits grew 6%, but corporation-wide investment-banking fees, excluding self-led deals, fell 11% to $1.8 billion. Investment judgment: client balance-sheet demand remains healthy, yet deal execution and fee conversion have lagged the commercial-loan opportunity.
- Global Markets — $5.867 billion revenue, down approximately 5.8%; 19.1% of operating-segment revenue; $1.235 billion net income. Sales and trading revenue fell 5% to $5.075 billion: FICC dropped 17% to $2.565 billion, while equities increased 11% to $2.510 billion. Investment judgment: strong equities performance cannot fully neutralize BAC’s sensitivity to mortgage, municipal and credit trading when rising yields suppress client activity.
The segment percentages above are rounded, calculated from company-reported figures, and are not separately disclosed company KPIs. The All Other segment posted a $1.353 billion net loss, including the settlement charge. Bank-wide provision for credit losses was $1.269 billion versus $1.295 billion one year earlier; the net charge-off ratio improved to 0.44% from 0.47%. Consequently, the earnings disappointment was driven much more by non-credit expenses and market-sensitive revenue than by an observable deterioration in the current loan-loss data.
Expectations vs. Actual Results
The following comparisons use the pre-release FactSet consensus of $30.58 billion revenue and $1.10 adjusted EPS reported by MarketWatch on October 14. A consistently defined consensus matters: the company’s $0.91 GAAP EPS and its $1.08 non-GAAP adjusted EPS cannot both be compared mechanically with one analyst EPS benchmark.
- ❌ Revenue miss: actual GAAP revenue was $29.958 billion versus $30.58 billion expected, approximately $622 million, or 2.0%, below that consensus.
- ❌ Adjusted EPS miss: actual company-defined adjusted EPS was $1.08 versus $1.10 expected, a $0.02 shortfall. Excluding the charge did not eliminate the disappointment.
- ⚠️ GAAP EPS: reported EPS was $0.91, including the $0.17-per-share settlement impact. There is no basis for labeling this a separate adjusted-consensus miss without a comparably defined GAAP estimate.
- ⚪ Operating margin: no independently verified, standardized Q3 Street consensus for BAC’s operating margin was available. For a bank, a more relevant disclosed cost measure is the efficiency ratio: 65.83% on a GAAP basis (approximately 66%), or approximately 62% excluding the settlement, versus 59.70% GAAP in Q3 2025. As a transparent profitability proxy, GAAP pretax margin was 29.9% ($8.967B pretax income ÷ $29.958B revenue), versus 35.8% ($10.408B ÷ $29.040B) a year earlier—calculated from company-reported figures. This is a year-on-year deterioration, not a verified beat or miss against a margin consensus.
- ➡️ Q4 and longer-term company outlook: management expected Q4 2026 NII to increase sequentially and a return to positive operating leverage in Q4. It reiterated approximately 8% full-year 2026 NII growth, indicated 2027 NII growth of 8% or more, and maintained a medium-term target of 200–300 basis points of operating leverage. Management did not provide a verified numerical Q4 revenue, EPS or pretax-margin forecast in the materials reviewed; no such figures are inferred here.
The core miss originated in FICC trading, softer investment banking and expense pressure. The $1.2 billion settlement accounts for the large divergence between GAAP and adjusted EPS, but even adjusted profitability came in below expectations. An investor focused solely on the GAAP headline could wrongly conclude that all weakness is exceptional; an investor focused only on adjusted EPS could understate the duration and governance implications of the underlying compliance failures.
For BAC, the market appeared to attach greater weight to the quality and predictability of earnings than to NII growth alone. Wealth flows and client balances supported the long-term narrative, while weaker fee realization, a 17% FICC revenue contraction, a higher adjusted cost base and the prospect of ongoing compliance oversight complicated that narrative. An announced investment banking pipeline is an opportunity, not revenue until deals close. The Q4 NII direction is constructive but does not offset an actual current-quarter EPS and revenue miss.
The trading response was consistent with this broader concern. BAC closed at $53.96 on October 13, $51.39 on October 14 (down 4.76%) and $51.70 on October 15 (up 0.60%). The October 14 intraday low was $49.26, which illustrates how far the initial reaction extended before the close. These dates and figures distinguish the earnings-day decline from the following day’s modest recovery. The selloff was not adequately explained as generic profit-taking: disappointing adjusted results, financial-crime controls, execution risk and capital sensitivity offer more specific explanations. No merger-related dilution was identified as the cause in the Q3 disclosures reviewed.
Earnings Call Highlights
The five points below are accurate management-position paraphrases, not purported verbatim quotations. They are based on the October 14, 2026 earnings call as reproduced in a publicly accessible full-text transcript and cross-checked, where applicable, with the company’s earnings release and presentation. The corporate Investor Relations site also lists an official transcript PDF; its direct file retrieval was access-restricted during this review.
- CFO Alastair Borthwick expects NII to increase sequentially in Q4, grow approximately 8% in 2026 and grow at least 8% in 2027, assuming three 25-basis-point rate hikes by June 2027.
💡 Reading Between the Lines: BAC is emphasizing deposit-and-loan expansion and fixed-rate asset repricing as durable sources of spread income. The guidance is materially rate-path-dependent, however, and management acknowledged that parts of Global Markets are liability-sensitive even as the core banking book benefits. - CEO Brian Moynihan says regulatory remediation resources and ongoing costs have already been embedded in the expense base; the CFO says the consent order imposes no asset cap.
💡 Reading Between the Lines: Management is trying to separate a recorded one-time penalty from the normalized earnings power of the franchise. The absence of an asset cap protects growth capacity, but the regulator’s continuing remediation requirements and independent oversight make expense discipline and credibility measurable investment risks. - CFO Borthwick expects positive operating leverage to return in Q4 and has not changed the medium-term goal of 200–300 basis points of operating leverage.
💡 Reading Between the Lines: Future multiple expansion depends on retaining more NII and fee growth after technology, compliance and personnel spending. This is a medium-term management target, not a guaranteed Q4 margin or a newly quantified 2027 earnings forecast. - CEO Moynihan describes investment-banking pipelines as robust and expanding despite weaker realized Q3 fees, with commercial lending growth indicating continuing client capital needs.
💡 Reading Between the Lines: The bank is asking investors to look through postponed transactions rather than assume demand has disappeared. The decisive future evidence will be completed mandates, underwriting volumes and fee capture—not pipeline commentary in isolation. - Moynihan emphasizes practical AI adoption and productivity gains, while acknowledging material AML and AI-related cybersecurity remediation costs, including additional outside contractors.
💡 Reading Between the Lines: AI is simultaneously a potential productivity tool and a source of rising control expenditure. Management’s cost-leverage thesis deserves more credit only when recurring savings exceed recurring technology and risk-management spending, rather than merely offsetting temporary remediation bills.
2. Deep Business Insights
Hidden Metrics That Matter
The first underappreciated metric is the bank’s growing dependence on spread income. GAAP NII accounted for approximately 54.9% of Q3 revenue: $16.449B ÷ $29.958B = 54.9%, compared with $15.233B ÷ $29.040B = 52.5% in Q3 2025 (calculated from company-reported figures). This change explains why fixed-rate asset repricing, deposit mix and loan growth matter so much more to BAC than the headline 3% revenue growth suggests. It is a source of operating leverage when funding conditions cooperate, but it also increases the importance of correctly modeling deposit pricing and the interest-rate curve.
Why can BAC sustain that relationship advantage? Its consumer franchise reported approximately 38.9 million checking accounts, 92% estimated to be primary customer accounts, and a leading U.S. consumer-deposit position. Customers can combine everyday payments, cards, rewards, small-business banking, mortgages, Merrill investments and financial advice in one ecosystem. The reason to remain is not merely a promotional deposit rate: moving paychecks, automatic bills, payment history and investment relationships can be inconvenient, while integrated digital servicing adds utility. This is a plausible switching-cost and distribution advantage, not a claim that deposits can never migrate to higher-yield alternatives.
The second is the securities portfolio’s duration overhang, a balance-sheet issue that is easy to miss in an EPS-focused summary. BAC’s September 30 supplemental filing disclosed $109.150 billion of gross unrealized losses across debt securities, compared with $85.260 billion at June 30. The $23.890 billion quarterly increase ($109.150B − $85.260B), or approximately 28.0%, is calculated from company-reported figures. Of the September amount, $103.914 billion related to held-to-maturity debt securities. These are gross fair-value marks, not a $109 billion realized earnings loss or an automatic dollar-for-dollar regulatory capital deduction.
Nonetheless, large negative securities marks reduce balance-sheet flexibility if the bank must realize losses to generate liquidity or reposition assets. Management reported average global liquidity sources of $914 billion, which materially reduces the need to extrapolate a forced-sale scenario from those marks alone. The relevant investment debate is therefore conditional: whether deposit stability and liquidity remain strong enough to let securities run off or reprice while capital remains sufficient for lending, dividends and repurchases.
Industry Chain Reactions
- ✅ Potential beneficiary — Visa (NYSE: V): BAC’s approximately $266 billion of combined credit/debit card spending, up 8% year over year, is a favorable read-through for transaction-driven payment networks if similar trends hold across issuers. This does not establish that all BAC card volume runs on Visa, nor does it quantify revenue accruing specifically to Visa. The conclusion is a sector-level transmission mechanism, not a confirmed BAC-to-Visa earnings contribution.
- ❌ Potential competitive pressure — Charles Schwab (NYSE: SCHW): BAC’s $664 billion of consumer investment assets, 14% year-over-year growth, 17.6 million BofA Rewards enrollees and a $5.1 trillion wealth platform demonstrate the scale of its integrated banking-and-investing distribution. If loyalty benefits and cross-selling retain more household assets at Merrill and BofA, competing brokerages such as Schwab may face a higher customer-acquisition or retention hurdle. No evidence presented here establishes an actual loss of Schwab clients to BAC.
These are conditional competitive and sector implications of BAC’s published operating data, not statements of verified supplier contracts, customer switching or the named companies’ own Q3 financial performance.
Valuation Framework and Key Risks
Using BAC’s October 15, 2026 closing price of $51.70 and its September 30 tangible book value per common share of $29.14, the stock traded at approximately 1.77 times tangible book ($51.70 ÷ $29.14). Its price-to-reported-book multiple was approximately 1.32 times ($51.70 ÷ $39.26). Both multiples are calculated from company-reported balance-sheet figures and an independently observed market close. They are point-in-time valuation measures, not price targets.
Those multiples should be assessed against the bank’s ability to earn returns on tangible equity through a cycle. Q3 reported return on average tangible common equity (ROTCE) was 12.6%; company-adjusted ROTCE excluding the settlement was 14.9%. At a 1.77-times tangible-book multiple, investors are implicitly underwriting sustainable above-cost-of-equity profitability and manageable capital distributions. The judgment changes significantly depending on whether the adjusted return is repeatable after full recurring compliance and technology expenditure.
Key variables to monitor include:
- Regulatory execution and expense recurrence. On October 13, FinCEN announced a $1.2 billion penalty, with credit for the OCC’s $750 million assessment; these amounts should not be added together as two separate $1.2 billion and $750 million income-statement charges. Regulators identified serious anti-money-laundering deficiencies. Management’s claim that remediation expenses are already reflected in the run rate is a management assertion, not evidence that further costs or regulatory actions are impossible.
- NII sensitivity. The call’s 2027 growth outlook assumes further rate hikes as well as continued organic loan and deposit growth. An alternative rate path, faster-rising deposit costs or funding competition could alter the benefit. Conversely, delayed fee recovery would leave BAC more dependent on the lending spread.
- Capital markets and wealth cyclicality. FICC declined 17% and investment-banking fees fell 11%, while wealth fees benefited in part from higher market valuations. A favorable M&A pipeline cannot compensate for a prolonged period of weak execution or falling client asset values until earnings are recognized.
- Capital allocation and securities duration. BAC returned approximately $8.3 billion through common dividends and repurchases in Q3 against $6.933 billion of GAAP net income. The reported standardized CET1 ratio decreased to 10.9% from 11.2% in Q2, while higher rates widened gross unrealized securities losses. Management can prioritize growth, buybacks or additional cushions, but cannot assume every objective is costless.
- Credit normalization. The 0.44% net charge-off ratio and relatively stable provisions are currently supportive. A later deterioration in credit cards, commercial real estate or business borrowers could erode the earnings cushion while the bank is already investing heavily in controls and technology.
A constructive investment case requires stronger NII to translate into sustained positive operating leverage, recovery in fee capture, demonstrable regulatory remediation and enough capital generation to support distributions without weakening prudential ratios. A cautious case is that adjusted Q3 profitability overstates the readily distributable earnings run rate because operating costs, rate sensitivity and duration losses are more persistent than headline adjusted EPS implies. The October 15 share price offers a clear reference point, but neither case justifies inventing a target price or an unissued quarterly earnings forecast.
3. Key FAQs
Did Bank of America (BAC) beat Q3 2026 earnings expectations?
No. BAC reported $0.91 in GAAP diluted EPS and $1.08 in adjusted diluted EPS, with $29.958 billion in revenue. Compared with the cited FactSet consensus of $1.10 adjusted EPS and $30.58 billion revenue, the company missed by $0.02 per adjusted share and approximately $622 million in sales. The $1.2 billion settlement caused a $0.17 per-share difference between GAAP and adjusted EPS but did not turn the underlying result into a beat.
What did Bank of America guide for Q4 2026 and 2027 net interest income?
On the October 14 earnings call, management said NII should rise sequentially in Q4 2026 and reaffirmed approximately 8% full-year 2026 NII growth. It expected 2027 NII growth of at least 8%, assuming three 25-basis-point rate increases through June 2027 alongside loan and deposit growth and fixed-rate asset repricing. Management also expected positive operating leverage in Q4 but did not provide a verified specific Q4 EPS, revenue or consolidated pretax-margin target.
Is BAC stock cheap after the Q3 2026 earnings selloff and regulatory fine?
At $51.70 on October 15, BAC traded at approximately 1.77 times Q3 tangible book value and 1.32 times reported book value. Those levels are not automatically cheap simply because the stock fell 4.76% on October 14. The appropriate test is whether its 14.9% settlement-adjusted quarterly ROTCE can be sustained while BAC funds remediation, absorbs interest-rate risks, restores capital-markets profitability and maintains capital. The distinction between a one-time accounting charge and recurring franchise risk is central to valuation.
Sources: Bank of America Investor Relations quarterly earnings; official Q3 2026 earnings press release (SEC Exhibit 99.1); official supplemental financial information (SEC Exhibit 99.3); official earnings-call event and transcript listing; accessible Q3 2026 call transcript; FactSet consensus reported by MarketWatch; BAC historical closing prices; the official FinCEN regulatory announcement; and the OCC enforcement announcement. Data and management outlook reflect the October 14, 2026 disclosures; the valuation reference date is October 15, 2026.
Disclaimer: This article/chart is for educational and informational purposes only and does not constitute investment advice of any kind. Past performance is not indicative of future results. Investors should independently evaluate their own risks.