

Key Takeaways
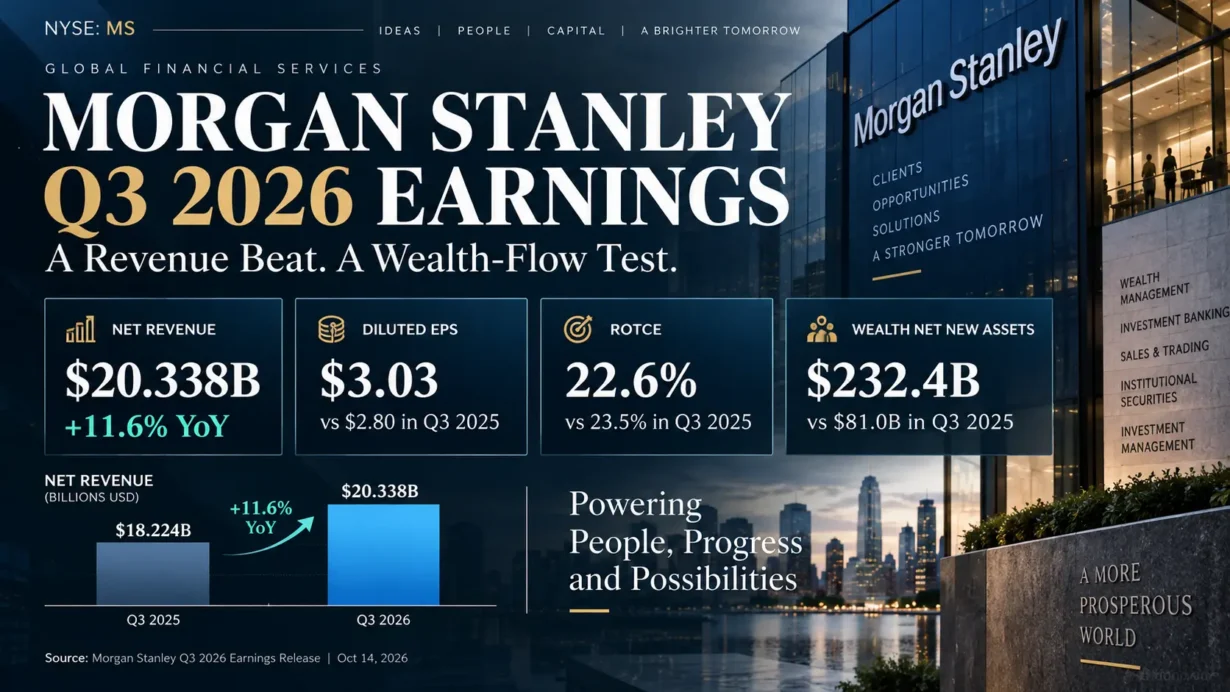
- Morgan Stanley (NYSE: MS) reported Q3 2026 net revenue of $20.338 billion, up 11.6% year over year, and diluted EPS of $3.03, up 8.2%. Both exceeded the FactSet consensus figures of $19.93 billion and $2.93, respectively.
- Institutional Securities revenue increased 18% to $10.029 billion, primarily supported by a 41% surge in equities revenue; fixed-income revenue fell 7% and investment-banking revenue rose only 2%.
- Wealth Management generated record revenue of $9.065 billion and $232.4 billion in net new assets, but just over half of those inflows were IPO-related. Its reported pretax margin was 30.4%.
- Firmwide pretax margin declined to approximately 31.9%, from 33.1% a year earlier, while return on tangible common equity (ROTCE) was 22.6%, down from 23.5%.
- MS shares fell 2.75% on October 14 despite the earnings beat, then closed at $182.10 on October 15. That latest completed-session price represented approximately 3.37 times reported tangible book value per share.
Analysis dated October 16, 2026. Financial reporting period: quarter ended September 30, 2026. Market pricing is based on the October 15, 2026 U.S. closing session. Unless otherwise noted, dollar amounts are in U.S. dollars and year-over-year comparisons are against Q3 2025.
1. Core Earnings Breakdown
Revenue and Profitability Analysis
Morgan Stanley’s October 14 earnings release reported net revenue of $20.338 billion versus $18.224 billion one year earlier, an increase of 11.6%. Net income applicable to Morgan Stanley rose 6.5% to $4.909 billion from $4.610 billion, while diluted EPS increased to $3.03 from $2.80. Pretax income grew 7.5% to $6.478 billion. The slower growth in profit than revenue is relevant: the earnings expansion was real, but it was not accompanied by broad firmwide margin expansion.
For a diversified investment bank, pretax margin and the expense-efficiency ratio are more decision-useful than a conventional industrial-company operating margin. Pretax income divided by net revenue was 31.85% ($6.478 billion / $20.338 billion), down from 33.08% ($6.028 billion / $18.224 billion) one year earlier. Morgan Stanley reported a 67% quarterly efficiency ratio, unchanged year over year but worse than 65% in Q2 2026. ROTCE, a company-defined non-GAAP metric, was 22.6%, down from 23.5% a year ago and 26.6% in the preceding quarter. These comparisons temper the EPS headline.
The three reported business segments contributed the following amounts, calculated against consolidated net revenue before accounting for intersegment eliminations:
- Institutional Securities: $10.029 billion, up 18%, equivalent to 49.3% of consolidated revenue. Equities revenue rose 41% to $5.799 billion; fixed-income revenue declined 7% to $2.011 billion; and investment banking edged up 2% to $2.159 billion. Within banking, advisory fees climbed about 30% to $887 million, but equity underwriting declined about 19% to $525 million. Investment judgment: an exceptional global equities and prime-brokerage franchise supports the quarter, yet trading intensity and capital-markets timing make this growth less predictable than recurring advisory fees.
- Wealth Management: $9.065 billion, up 10%, equivalent to 44.6% of consolidated revenue. Asset-management revenue climbed 16% to $5.544 billion, while net interest income increased 12% year over year to $2.228 billion. Record net new assets reached $232.4 billion and fee-based flows reached $80.5 billion; the segment delivered $2.754 billion in pretax profit and a 30.4% pretax margin. Investment judgment: the scalable advice platform is the stronger long-duration earnings argument, but the source and subsequent monetization of inflows matter more than their raw size.
- Investment Management: $1.459 billion, down 12%, equivalent to 7.2% of consolidated revenue. Assets under management or supervision nevertheless rose 13% to $2.046 trillion, with $15.8 billion in long-term net inflows. Asset-management and related fees increased approximately 2% to $1.565 billion, while performance-based and other income shifted to negative $106 million from positive $117 million, reflecting a carried-interest reversal in a private fund. Investment judgment: the revenue decline should not be mistaken for an equivalent deterioration in the fee-paying asset base, although performance fees and private-markets valuations remain meaningful risks.
The segment percentages above are calculated from company-reported figures: $10.029 billion / $20.338 billion, $9.065 billion / $20.338 billion, and $1.459 billion / $20.338 billion, respectively. They sum to approximately 101.1% because $215 million of intersegment eliminations, or negative 1.1% of consolidated revenue, reconciles them to the firmwide total. The calculations are not additional company-disclosed percentage metrics. Comparability also warrants care: the company changed its deferred-compensation hedging and reporting treatment beginning in Q1 2026, affecting some comparisons with 2025.
Expectations vs. Actual Results
The expectations below consistently use the FactSet analyst poll cited by The Wall Street Journal on October 14. Other data vendors published different consensus snapshots; the numbers should not be mixed across providers.
- ✅ Revenue beat: actual $20.338 billion versus FactSet consensus of $19.93 billion, exceeding expectations by approximately $408 million, or 2.0%.
- ✅ Diluted EPS beat: actual $3.03 versus FactSet consensus of $2.93, exceeding expectations by $0.10 per share, or 3.4%.
- ↔ Margin versus consensus: firmwide pretax margin was approximately 31.9% (reported as 32% in the supplement). A verifiable FactSet consensus pretax or operating margin was not available in the cited source, so there is no defensible numerical beat-or-miss classification for margin. Compared with reported history, the margin declined.
- Forward guidance: no numerical Q4 2026 companywide revenue, EPS or pretax-margin target was disclosed on the call. CFO Sharon Yeshaya said Wealth Management net interest income should increase modestly in Q4, conditional on rates and client behavior; the Q4 effective tax rate should be slightly above Q3’s 23.3%. She also anticipated net-interest-income expansion in 2027 supported by loan growth. These are management’s qualitative outlook statements, not realized results or numerical forecasts.
What actually drove the beat? Equities revenue rose by $1.683 billion from the prior year, supported by prime-brokerage financing, derivatives and global client activity. That improvement dwarfed the modest $51 million increase in investment-banking revenue and helped offset the $158 million decline in fixed income and the $192 million decline in Investment Management. Wealth Management contributed a further $831 million in revenue growth. The composition matters because a larger portion of the surprise came from trading strength and asset-linked fees than from a decisive acceleration in underwriting.
Investors therefore had several separate scorecards: EPS and total revenue were ahead of consensus; equity execution was exceptional; but Wealth Management’s revenue quality, fee conversion and approximately 30% pretax margin were the more consequential tests of the stock’s long-term premium. Investment-banking pipelines were discussed positively, yet actual underwriting results remained uneven. For Morgan Stanley, this is a trading-and-wealth-management question, not a product-sales or pharmaceutical-style pipeline story.
The share-price reaction underscored that distinction. MS closed at $186.64 on October 13, the session before the release, then at $181.51 on October 14, down 2.75%, despite the headline beat. It recovered 0.33% to $182.10 on October 15, leaving the shares 2.43% below the pre-results closing price. The October 14 session also saw a broader selloff associated with a hotter-than-expected U.S. inflation report, so the entire move cannot responsibly be attributed to Morgan Stanley’s results.
The stock’s weakness is better interpreted as a reassessment of the durability and price already assigned to earnings: ROTCE and pretax margin declined, fixed income disappointed, more than half of wealth inflows came from IPO activity, and management offered no new numerical earnings target. Elevated Treasury yields can simultaneously raise funding costs and compress the valuation of financial assets. There was no announced Q4 revenue/EPS guidance cut or disclosed dilutive acquisition in this earnings release to substantiate either explanation. Calling the move simply “sell the news” would obscure those identifiable issues.
Earnings Call Highlights
The company’s official Investor Relations site provides the earnings release, financial supplement and conference-call webcast. A separately published official verbatim transcript was not located there at the time of review. The following management points are attributed, accurate paraphrases of the publicly accessible third-party call transcript, with financial facts checked against the official documents; they are not presented as verbatim audio-verified quotations.
- Ted Pick: Morgan Stanley’s integrated model connects institutional banking, market execution and wealth advice to serve clients throughout the capital-raising and investment cycle. 💡 Reading Between the Lines: The strategic ambition is to capture multiple profit pools from one client relationship rather than compete for a single underwriting mandate. That integration can justify a structural valuation premium only if cross-channel relationships consistently become monetizable assets and fees.
- Sharon Yeshaya: IPO-related wealth inflows were just over half of quarterly net new assets, and the Workplace and advisory channels can develop those relationships beyond the initial listing. 💡 Reading Between the Lines: An IPO creates the starting point of a distribution funnel, not a guaranteed recurring fee stream. The key underwriting assumption for shareholders is retention and conversion after lockups expire, especially if the IPO calendar slows.
- Sharon Yeshaya: Expanding deposits is a deliberate bank-funding strategy, with benefits expected to emerge over time rather than immediately. 💡 Reading Between the Lines: The firm is accepting near-term net-interest-income friction to strengthen funding capacity and create additional touchpoints with wealth clients. Investors should evaluate incremental loan economics against the higher cost of deposits, not treat deposit growth alone as a profitability win.
- Ted Pick: The AI capital-spending cycle offers advisory, structuring and financing opportunities, but the firm must be selective when committing its own risk capital. 💡 Reading Between the Lines: Morgan Stanley wants to monetize the AI investment cycle without turning every financing opportunity into a balance-sheet bet. Higher real rates, overbuilding or delayed projects could still weaken advisory conversion and expose poorly structured credit.
- Sharon Yeshaya: Wealth Management’s pretax margin can expand with scale, but management is investing for the long term rather than targeting quarterly margin increases. 💡 Reading Between the Lines: Management prioritizes advisor connectivity, technology and client acquisition over maximizing this quarter’s expense ratio. The investment case depends on those costs producing higher recurring revenue per relationship over several years, not on an imminent, promised margin step-up.
2. Deep Business Insights
Hidden Metrics That Matter
Metric one — equities’ disproportionate contribution to incremental revenue. Consolidated net revenue rose by $2.114 billion year over year ($20.338 billion minus $18.224 billion). Equities revenue alone rose by $1.683 billion ($5.799 billion minus $4.116 billion). Thus $1.683 billion / $2.114 billion = 79.6%, calculated from company-reported figures. This is a contribution-to-change comparison, not a company-disclosed attribution of profits or a claim that equities generated 79.6% of total revenue. Its significance is that the headline 11.6% revenue growth was unusually dependent on one market-sensitive activity. If client positioning and financing balances normalize, the next quarter could look materially different even without a loss of market share.
Metric two — the recurring-fee base versus the inflow headline. Wealth Management asset-management revenue accounted for $5.544 billion / $9.065 billion = 61.2% of segment revenue, calculated from company-reported figures. Its 16% year-over-year growth is a constructive signal for fee monetization. However, just over half of the $232.4 billion in net new assets was IPO-linked, while management said nearly half of the $80.5 billion fee-based flows came from a corporate retirement mandate. Those sources are not necessarily repeatable every quarter. Crucially, fee-based flows and net new assets are different measures: dividing one by the other would not produce a valid client-conversion rate.
A related balance-sheet detail sharpens that second metric. Wealth deposits increased from $436 billion to $465 billion quarter over quarter, while the annualized period-end weighted-average deposit cost increased from 2.60% to 2.85%, or 25 basis points. Wealth net interest income slipped from $2.254 billion to $2.228 billion over the same period. This is consistent with the management-described short-term funding trade-off, although the published figures alone do not isolate causality. The practical questions are whether assets remain after IPO-related restrictions end, whether clients adopt advice-based accounts, and whether new funding produces attractive loan returns.
Why might a customer choose Morgan Stanley rather than a standalone trading account or investment adviser? Its differentiated proposition combines employee-stock-plan administration, E*TRADE self-directed investing, access to financial advisors, securities-backed lending, retirement offerings, investment products and institutional capital-markets relationships. A founder or employee can enter through a workplace share plan and later need concentrated-stock planning, liquidity, diversification and tax-aware advice. That is a plausible customer-acquisition advantage, but it is not an economic moat unless the firm proves retention, attractive revenue per client and durable margins after initial liquidity events.
Industry Chain Reactions
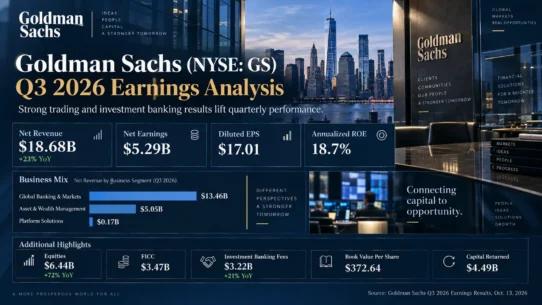
- ✅ Potential beneficiary — Goldman Sachs (NYSE: GS). Morgan Stanley’s strong equities activity is a positive read-through for institutions with comparable execution, derivatives, prime-brokerage and financing capabilities. Goldman Sachs independently reported $18.68 billion in Q3 2026 net revenue and $17.01 in diluted EPS, confirming that sophisticated capital-markets services are benefiting from the environment. This is evidence of a shared industry tailwind, not proof that Goldman Sachs receives revenue directly from Morgan Stanley’s success.
- ❌ Potential competitive pressure — Charles Schwab (NYSE: SCHW). Morgan Stanley’s ability to turn employee equity plans and IPO wealth into full-service financial-advice relationships raises the competitive bar for brokerage and wealth platforms seeking the same affluent households. The pressure is on client acquisition and share of wallet, not necessarily on Schwab’s near-term revenue: Schwab also reported substantial asset inflows and trading activity in Q3. No direct client-share transfer between the firms was disclosed.
Valuation Framework and Key Risks
At the verified October 15, 2026 closing price of $182.10, MS traded at approximately 3.37 times its reported September 30 tangible book value per share of $53.96 ($182.10 / $53.96), and 2.65 times stated book value per share of $68.59 ($182.10 / $68.59). Both multiples are calculated from company-reported book-value figures and the externally sourced share price. Tangible book value and ROTCE are company-defined non-GAAP metrics, so comparisons with other banks require consistent definitions.
The trailing earnings comparison is less demanding on its face: Q4 2025 diluted EPS was $2.68, and Morgan Stanley reported $9.93 in diluted EPS for the first nine months of 2026. Their sum is $12.61 in trailing-four-quarter EPS, calculated from company-reported figures. At $182.10, the resulting historical P/E is approximately 14.44 times ($182.10 / $12.61). This is a backward-looking arithmetic measure, not a forecast or an estimate of normalized earnings.
The distinction between a roughly 14.4-times trailing P/E and 3.37-times tangible book is the heart of the valuation debate. The market is willing to pay a substantial premium to tangible equity because Morgan Stanley has demonstrated an ability to earn more than 20% on it. The premium can be rational if the wealth franchise increasingly replaces cyclical trading profit with recurring fees. It becomes vulnerable if record equity results prove unusually favorable, IPO-derived assets do not persist, or deposit and technology costs absorb the benefits of scale.
Capital strength provides a counterweight. The standardized Common Equity Tier 1 ratio was 14.9%, and the company repurchased approximately $1.54 billion in common shares during the quarter while declaring a $1.15 quarterly dividend per share. Those are reported capital-allocation decisions, not commitments to maintain a particular future repurchase pace. Investors should monitor whether credit-risk growth and loan commitments consume capital faster than the wealth and banking model creates incremental returns.
Three risk clusters deserve attention. First, market sensitivity: equities revenue is strong, but fixed income, underwriting and advisory pipelines respond differently to rate shocks, geopolitics and transaction calendars. Second, wealth monetization: IPO-linked assets can be distributed, sold or transferred after lockups, and new higher-cost deposits can temporarily dilute net interest income. Third, private-markets and credit exposure: the quarter included a carried-interest reversal in Investment Management and $148 million of firmwide credit-loss provision. Reuters separately reported redemption requests of 11.4% of shares in one Morgan Stanley private-credit fund’s tender offer; that fund-specific datapoint should not be confused with firmwide investment-management outflows.
The evidence that would most strengthen the bull case is continued growth in fee-based client assets and recurring asset-management revenue after unusually large IPO or retirement-mandate flows normalize, alongside funding benefits and a firmwide ROTCE sustainably above 20%. The bear case would gain weight from persistent margin compression, weaker institutional equities, slower conversion of workplace assets and rising credit costs. Neither scenario is represented here as a management earnings forecast or a numerical price target.
3. Key FAQs
Did Morgan Stanley (MS) beat Q3 2026 earnings expectations?
Yes. Morgan Stanley reported diluted EPS of $3.03 and net revenue of $20.338 billion for Q3 2026, compared with FactSet consensus of $2.93 and $19.93 billion. That implies an EPS beat of $0.10 and a revenue beat of approximately $408 million. Firmwide pretax margin was approximately 31.9%, but a comparable, verified consensus margin was not available from that FactSet snapshot.
Why did Morgan Stanley stock fall after its October 2026 earnings beat?
MS fell 2.75% on October 14, 2026, even though revenue and EPS exceeded the cited expectations. Plausible concerns included the heavy contribution from market-sensitive equities trading, lower firmwide pretax margin and ROTCE, IPO-related wealth-flow concentration, and higher funding costs. A contemporaneous U.S. inflation surprise also pressured the broader market. The data do not establish a single cause, and the company did not announce a numerical Q4 EPS guidance cut.
Is Morgan Stanley’s Q3 2026 wealth-management growth sustainable?
The fee business has supportive underlying indicators: asset-management revenue rose 16% to $5.544 billion, fee-based client assets reached $3.155 trillion, and the business generated a 30.4% pretax margin. However, just over half of quarterly net new assets was linked to IPOs, and a new corporate retirement mandate materially supported fee-based flows. The decisive longer-term test is how many of those relationships persist and become recurring advisory revenue, rather than whether the record quarterly net-new-asset number repeats.
Sources: Primary financial data and definitions are from Morgan Stanley’s official Q3 2026 earnings release, Q3 financial supplement and Q4 2025 earnings release; call commentary was checked against the official conference-call page and a third-party call transcript, FactSet consensus against The Wall Street Journal, closing prices against S&P Global Market Intelligence data published by Stock Analysis, and selected industry context against Reuters and Goldman Sachs’ official release; the central issuer source hub is Morgan Stanley Investor Relations.
Disclaimer: This article/chart is for educational and informational purposes only and does not constitute investment advice of any kind. Past performance is not indicative of future results. Investors should independently evaluate their own risks.