


Key Takeaways
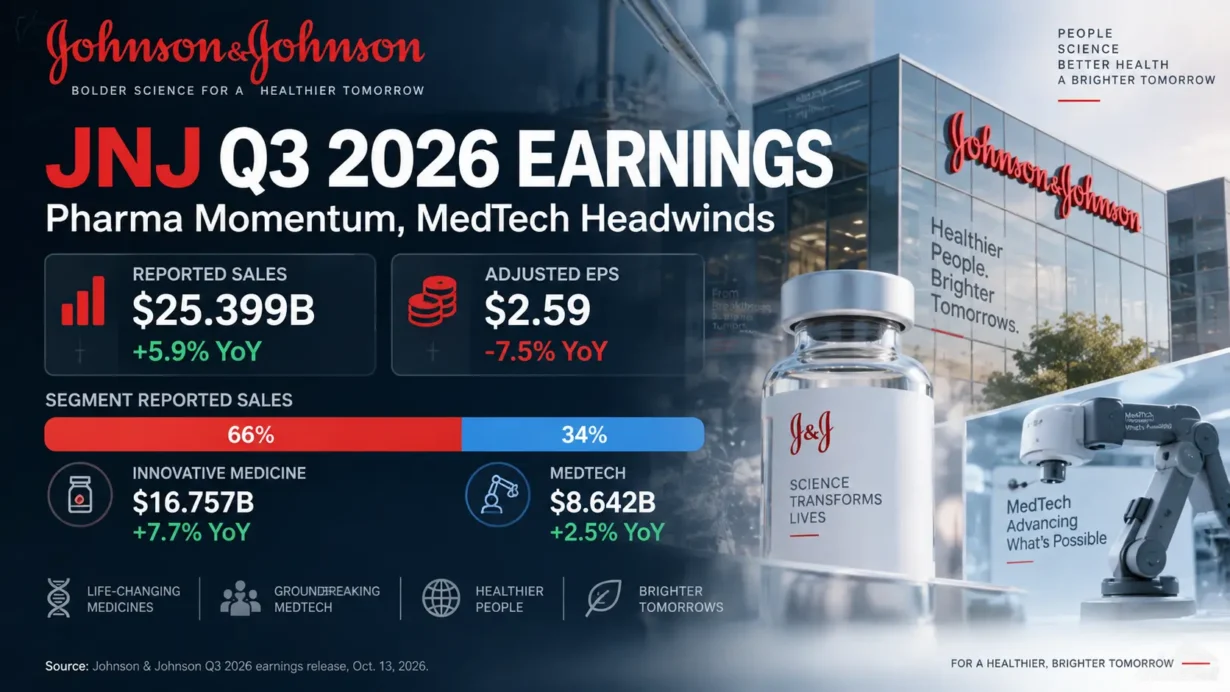
- Johnson & Johnson reported Q3 2026 revenue of $25.399 billion, up 5.9% year over year, with adjusted EPS of $2.59 versus $2.80 a year earlier. GAAP EPS was just $0.09 because of substantial special and transaction-related charges.
- Innovative Medicine generated $16.757 billion in sales, up 7.7%, while MedTech delivered $8.642 billion, up 2.5% and below the $8.71 billion LSEG consensus cited by Reuters. MedTech revenue outside the United States grew only 0.1% operationally.
- The company raised the midpoint of full-year 2026 adjusted EPS guidance to $11.10, but management also projected $1.36 per share of combined 2027 adjusted EPS dilution from the Firefly Bio and Sail Biomedicines transactions.
- JNJ declined 5.73% on the October 13 earnings-release date despite modest beats against one published consensus set; by the October 15 close at $253.28, shares were still 3.96% below the October 12 pre-release close.
- At $253.28, JNJ traded at approximately 22.8 times the midpoint of its own 2026 adjusted EPS guidance. That valuation demands evidence of MedTech stabilization, pipeline commercialization and a credible post-transaction earnings bridge.
Published October 16, 2026. Financial results are for Johnson & Johnson’s third quarter of 2026, announced October 13. Share-price analysis uses the most recent completed U.S. trading session, October 15, 2026. All dollar amounts are in U.S. dollars unless otherwise indicated. Reported financial results, analyst expectations, management guidance and independently calculated metrics are identified separately.
Core Earnings Breakdown
Revenue and Profitability Analysis
Johnson & Johnson (NYSE: JNJ) reported third-quarter revenue of $25.399 billion, compared with $23.993 billion a year earlier. That represents 5.9% reported growth, 6.0% operational growth excluding currency translation, and 6.1% adjusted operational growth excluding currency and the net impact of acquisitions and divestitures. The headline suggests resilient demand, but the composition reveals an unusually sharp divergence between pharmaceutical innovation and device execution. These figures come from the company’s official Q3 2026 earnings release and financial schedules.
- Innovative Medicine: $16.757 billion, or approximately 66.0% of consolidated revenue, up 7.7% reported and 7.9% operationally. The revenue share is calculated from company-reported figures: $16.757 billion / $25.399 billion. Investment interpretation: JNJ’s drug franchises are carrying consolidated growth through STELARA’s loss of exclusivity, but the company needs ongoing launch success to maintain that replacement cycle without sacrificing returns on R&D.
- MedTech: $8.642 billion, or approximately 34.0% of consolidated revenue, up 2.5% both reported and operationally. The revenue share is calculated from company-reported figures: $8.642 billion / $25.399 billion. Investment interpretation: a third of the group remains exposed to hospital purchasing patterns, regional reimbursement and competitive procedure technologies; its slower growth is a meaningful constraint on JNJ’s consolidated rerating.
Within Innovative Medicine, TREMFYA revenue climbed to $2.396 billion from $1.424 billion, an increase of 68.3% on a reported basis, while STELARA fell to $716 million from $1.570 billion, down 54.4%. DARZALEX reached $4.239 billion, up 15.4% reported; CARVYKTI rose to $710 million, up 35.5%; and TECVAYLI rose to $312 million, up 76.6%. The causal story is more important than the individual growth rates: JNJ is shifting its earnings engine toward immunology indications and increasingly specialized oncology treatments. Diversified oncology growth reduces dependence on any single molecule, although individual assets still face clinical, reimbursement and competitive risks.
Within MedTech, management reported 4.8% U.S. operational sales growth but only 0.1% international operational growth. Shockwave grew 17.2% operationally, while Abiomed declined 1.5% as patient volumes and physician selection remained challenging. Surgery declined 1.0% operationally amid factors including Chinese volume-based procurement and Middle Eastern disruption. The quarter therefore was not evidence of universally weak demand for medical procedures; it was evidence that JNJ’s product and geographic exposures are producing very different outcomes.
Profit quality was weaker than the sales growth suggests. GAAP gross margin fell to 68.1% from 69.6%, a 150-basis-point decline. Research and development expense rose to $4.652 billion, or 18.3% of revenue, versus $3.672 billion, or 15.3%, in Q3 2025. The 2026 amount included approximately $1 billion associated with the Firefly Bio acquisition. The company also recognized a $339 million impairment related to preCARDIA and a substantial expense associated with a proposed $5.5 billion resolution of ovarian talc litigation. Accordingly, GAAP net income dropped to $210 million from $5.152 billion, and GAAP diluted EPS fell to $0.09 from $2.12.
On the company’s non-GAAP definition, adjusted net earnings were $6.339 billion, down 6.8% from $6.801 billion, while adjusted diluted EPS declined 7.5% to $2.59 from $2.80. Adjusted earnings before income taxes represented 30.2% of sales, compared with 35.2% a year earlier, a 500-basis-point contraction. This is an adjusted pretax profitability measure, not GAAP operating margin; acquired in-process R&D and deal-related spending weighed on the measure. Segment adjusted pretax margins were 35.4% for Innovative Medicine versus 44.3% a year earlier, and 22.9% for MedTech versus 21.0%, with tariff recoveries helping the latter. Underlying profitability should not be judged solely by the unusually low GAAP EPS, but neither should the adjusted EPS decline be dismissed as immaterial.
Expectations vs. Actual Results
There is no single universal earnings consensus. Reuters reported expectations of $25.28 billion in revenue and, implicitly, $2.54 in adjusted EPS (given its reported five-cent EPS beat), while a pre-release Investopedia article attributed $25.43 billion in revenue and $2.75 in adjusted EPS to Visible Alpha. Those benchmarks lead to different beat-or-miss labels. Comparisons below preserve the source and metric definitions rather than selecting whichever estimate makes the result appear stronger.
- ✅ Consolidated revenue versus Reuters’ cited consensus: $25.399 billion actual versus $25.28 billion expected, a $119 million beat (approximately 0.5%). Against Visible Alpha’s separately published $25.43 billion forecast, however, the same actual revenue was a $31 million miss.
- ✅ Adjusted EPS versus Reuters’ cited consensus: $2.59 actual versus an implied $2.54 expectation, or a $0.05 beat. ❌ Against Visible Alpha’s pre-release $2.75 estimate, adjusted EPS missed by $0.16. GAAP EPS was $0.09; a comparable, independently verified GAAP EPS consensus was not established for this analysis.
- ❌ MedTech revenue versus LSEG expectations reported by Reuters: $8.642 billion actual versus $8.71 billion expected, approximately $68 million below consensus. The discrepancy is strategically more significant than its absolute size because the device unit was expected to support JNJ’s higher-growth portfolio transition.
- ⚪ Operating profitability versus consensus: JNJ disclosed a Q3 adjusted pretax earnings margin of 30.2%, down from 35.2% in Q3 2025, and a GAAP gross margin of 68.1%, down from 69.6%. No directly comparable, independently verified Q3 operating-margin analyst consensus was found; therefore, a margin beat or miss cannot be credibly assigned. These measures must not be mislabeled as the same metric.
The above external expectations are documented in Reuters’ October 13 earnings report and Investopedia’s October 12 Visible Alpha preview. The reporting dates and vendors matter: consensus dispersion is a reason to assess the underlying operating result rather than reduce an investment thesis to a binary earnings surprise.
For full-year 2026, JNJ raised its estimated reported sales range to $101.0 billion–$101.4 billion, with a $101.2 billion midpoint, versus the prior $100.8 billion–$101.4 billion range and $101.1 billion midpoint. It lifted adjusted EPS guidance to $11.05–$11.15, with an $11.10 midpoint, versus $10.96–$11.11 previously and an approximately $11.04 midpoint. Adjusted operational sales growth guidance is 6.4%–6.8%. In the earnings call, CFO Joseph Wolk also indicated an expected full-year operating-margin decline of approximately 60 basis points, an improvement from the 75-basis-point decline embedded in July guidance. These are management forecasts, not actual FY2026 results.
Next-quarter outlook: management did not publish a separate, quantified Q4 2026 revenue or EPS guidance range in the official Q3 earnings release. Its full-year guidance incorporates management’s expectations for the fourth quarter, but treating an implied Q4 number as a separately issued company forecast would be misleading. Management discussed anticipated Q4 pipeline events, including oncology readouts and potential product approvals, which remain future milestones rather than realized commercial results.
What drove the apparent beat? Product-level execution in immunology and oncology offset below-consensus MedTech sales: TREMFYA exceeded the roughly $2.2 billion expectation cited by Reuters, while DARZALEX’s $4.239 billion fell below the roughly $4.4 billion product estimate in the same report. This is not a broad-based acceleration. Moreover, year-over-year adjusted earnings weakened because of acquired R&D expenses, transaction costs and product mix. The modest guidance increases did not eliminate those pressures, particularly with management quantifying more acquisition-related EPS dilution for 2027.
The stock’s response reinforces the distinction. JNJ closed at $248.61 on October 13, down 5.73% from its $263.73 October 12 close, and recovered to $253.91 on October 14 before finishing October 15 at $253.28. The stock was therefore still 3.96% below its pre-release close: ($253.28 / $263.73 − 1) × 100, calculated from historical closing prices. The market reaction was consistent with disappointment about MedTech’s second consecutive consensus shortfall, future deal-related earnings dilution, profitability and the execution uncertainty surrounding an orthopaedics separation. It would be simplistic to call the decline merely a sell-the-news event; investors were re-evaluating the quality and timing of future earnings, not just Q3’s headline revenue and EPS.
Earnings Call Highlights
The following five management points are accurate paraphrases, not purported verbatim quotations. They are drawn from the officially hosted October 13, 2026 earnings-call transcript.
- CEO Joaquin Duato and the Innovative Medicine leadership emphasized expanding TREMFYA across inflammatory diseases and highlighted ICOTYDE’s launch, including more than 20,000 patients initiated through nearly 9,000 prescribers. 💡 Reading Between the Lines: The revenue replacement strategy is moving from defending STELARA to developing commercially differentiated treatment pathways. For an earnings model, adoption breadth, access and incremental indications matter more than launch prescriptions alone because they determine durability after the initial patient cohort.
- CFO Joseph Wolk acknowledged that MedTech must improve particularly in Cardiovascular and Surgery outside the United States, while management attributed current pressure to regional disruptions, competitive forces and procedure-specific issues. 💡 Reading Between the Lines: Management is framing the shortfall as remediable execution rather than a structural collapse in procedures. Investors should withhold a full recovery multiple until international orders, Abiomed utilization and electrophysiology share trends corroborate that framing.
- CFO Joseph Wolk projected $0.64 of 2026 adjusted EPS dilution and a combined $1.36 per-share impact in 2027 from Firefly Bio and Sail Biomedicines, with fuller 2027 modeling details planned for the December 8 Enterprise Business Review. 💡 Reading Between the Lines: JNJ is consciously accepting near-term EPS pressure to acquire or develop long-duration oncology and immunology capabilities. The central valuation question is whether clinical probability-adjusted future cash flows justify the lower near-term earnings base; $1.36 is a forward-looking dilution estimate, not a realized 2027 loss.
- Management described OTTAVA’s U.S. FDA De Novo authorization and an early, measured commercial rollout, with adoption and revenue expected to build toward a more meaningful contribution later in the decade. 💡 Reading Between the Lines: Robotics is a potential competitive and hospital-workflow platform, not an immediate solution to the current MedTech revenue miss. Modeling material near-term OTTAVA sales without reported installations, procedural utilization and repeat purchasing would overstate commercialization certainty.
- CFO Joseph Wolk said the ambition for double-digit growth by the end of the decade relies on internal strategic investments rather than assuming additional M&A, and reiterated that DePuy Synthes is being prepared for separation around mid-2027 with a spin-off the preferred route. 💡 Reading Between the Lines: A credible organic growth pathway would support a higher-quality earnings multiple than one dependent on serial acquisitions. Yet separation mechanics and stranded costs remain unsettled, so investors should not assign assumed sale proceeds or immediate margin gains to a transaction that has not occurred.
Deep Business Insights
Hidden Metrics That Matter
Two calculated measures capture the durability and concentration of JNJ’s growth better than the consolidated 5.9% revenue headline.
- STELARA replacement coverage by TREMFYA: TREMFYA’s reported Q3 sales increased by $972 million ($2,396 million − $1,424 million), while STELARA’s reported sales declined by $854 million ($1,570 million − $716 million). Therefore, $972 million / $854 million × 100 = approximately 113.8% of STELARA’s year-over-year revenue erosion matched by incremental TREMFYA revenue, calculated from company-reported figures. This is a gross revenue bridge, not an estimate of incremental profit, retention of individual patients or one-to-one franchise substitution. It demonstrates that JNJ has built a significant commercial offset to a patent-cliff challenge, but pricing, rebates, treatment mix and R&D economics determine how much value reaches shareholders.
- U.S. contribution to incremental consolidated revenue: U.S. quarterly sales rose by $1,251 million ($14,959 million − $13,708 million), while worldwide sales rose by $1,406 million ($25,399 million − $23,993 million). Accordingly, $1,251 million / $1,406 million × 100 = approximately 89.0% of total year-over-year reported revenue growth came from the U.S., calculated from company-reported figures. This is a change-contribution ratio, not the U.S. share of the current sales base. It reveals that growth is considerably more geographically concentrated than a global healthcare brand might imply and makes reimbursement, access and pricing conditions in the U.S. especially consequential.
Why do physicians, patients, payers and hospitals choose JNJ’s products? In Innovative Medicine, prescribers and payers weigh clinical differentiation, indicated patient populations, administration preferences, safety evidence and formulary access. Management said that approximately 60% of initial ICOTYDE patients were previously untreated with systemic therapy, while roughly 20% had switched from oral agents and 20% from other treatments. Those figures, reported on the earnings call, suggest an opportunity to expand the treated population, not simply capture existing competitors’ prescriptions. For MedTech, hospitals consider procedure outcomes, training, instrument compatibility, capital expenditure and operating-room workflow; JNJ positions OTTAVA’s table-integrated architecture and connected digital ecosystem around those practical adoption barriers. These advantages can support switching costs and longer relationships, but they are hypotheses to verify through actual utilization, competitive trial data and commercial access—not evidence that JNJ is insulated from substitution or procurement pressure.
Cash generation gives the company options, but capital allocation has an opportunity cost. CFO Wolk reported approximately $17 billion in cash and marketable securities, $45 billion in debt, roughly $28 billion in net debt, and more than $6 billion in Q3 free cash flow. The company’s approximately $15.1 billion free-cash-flow figure in the earnings release is an estimated nine-month year-to-date amount, not an additional single-quarter result; management’s approximately $21 billion full-year FCF figure is guidance. These distinctions matter when assessing the balance between dividends, acquisitions, clinical investment and balance-sheet flexibility.
Industry Chain Reactions
- ✅ Potential beneficiary — Legend Biotech (NASDAQ: LEGN): JNJ’s CARVYKTI generated $710 million in Q3 revenue, up 35.2% operationally. CARVYKTI is developed and commercialized through the collaboration between Legend Biotech and JNJ’s Janssen Biotech business, as described in Legend’s official investor disclosures. Continued therapy uptake can support the collaborative economics and reinforce confidence in the CAR-T franchise. However, JNJ’s reported global product sales are not equivalent to Legend’s recognized revenue, profit or free cash flow; cost sharing, profit allocation and capacity constraints need separate analysis.
- ❌ Potential competitive pressure — Intuitive Surgical (NASDAQ: ISRG): JNJ’s FDA-authorized OTTAVA robotic surgery platform creates a possible additional rival to Intuitive’s da Vinci ecosystem as JNJ builds its installed base. Competition could eventually affect hospital capital-equipment decisions, procedure growth and system economics. This is a scenario, not evidence that Intuitive has already lost meaningful share: OTTAVA’s commercial launch remains early, and Intuitive retains an established installed base, procedural familiarity and service ecosystem.
JNJ’s MedTech weakness should not automatically be extrapolated to every device manufacturer. The earnings call identified company-specific exposures—China procurement, cardiovascular product competition, Abiomed patient selection and the planned orthopaedics restructuring—alongside broader regional issues. Similarly, OTTAVA’s prospective competitive impact should not be booked as an immediate revenue transfer from Intuitive.
Valuation Framework and Key Risks
At the October 15, 2026 closing price of $253.28, JNJ traded at approximately 22.8 times its 2026 management-guided adjusted EPS midpoint: $253.28 / $11.10 = 22.82, calculated from the closing share price and company guidance. This is a price-to-guided-adjusted-earnings ratio, not a GAAP trailing P/E and not a 2027 earnings multiple. It reflects an annual EPS estimate issued by management, so changes to that guidance or the stock price change the calculation.
That multiple may be defensible for a global healthcare franchise with large oncology and immunology platforms, recurring treatment demand, strong cash generation and multiple pipeline opportunities. It is less forgiving if device growth remains near 2.5%, international markets stagnate, deal-related expenses persist, or management’s long-run growth ambitions take longer to monetize. The incremental $1.36-per-share 2027 deal-dilution estimate is especially relevant because mechanically carrying forward the $11.10 2026 midpoint without accounting for 2027 cost and portfolio changes would distort the earnings denominator. There is no complete, company-issued 2027 EPS guidance range available from the Q3 call, so a definitive 2027 forward P/E would be speculative.
The central scenario is conditional rather than a price target. A constructive case requires sustained double-digit growth at key franchises such as TREMFYA and CARVYKTI, successful ICOTYDE access and indication expansion, demonstrable recovery in MedTech’s international business, and eventual monetization of current pipeline spending. A cautious case assumes weak device mix, competitive pricing, delayed product evidence and a less favorable 2027 earnings bridge. A downside case additionally considers litigation uncertainty, regulatory setbacks and structural margin pressure. Without explicit, independently supportable assumptions for long-run growth, discount rates, product probabilities and the separated business, a precise fair-value target would imply more certainty than the evidence supports.
The highest-priority checkpoints are: sequential international MedTech growth and hospital ordering patterns; Abiomed utilization and future PROTECT IV clinical evidence; electrophysiology competition and new-platform adoption; growth-to-profit conversion in Innovative Medicine after acquired R&D; the conditions surrounding the proposed talc settlement, including the 95% claimant-participation threshold; and the December 8 Enterprise Business Review’s details on 2027 earnings and the DePuy Synthes separation. Management’s ambition for double-digit growth by decade-end remains a forward-looking aspiration, not a current growth rate or a guaranteed outcome.
Key FAQs
Did Johnson & Johnson beat earnings estimates in Q3 2026?
It depends on the consensus provider. JNJ reported $25.399 billion in revenue and $2.59 in adjusted EPS. Reuters cited $25.28 billion in expected revenue and described adjusted EPS as five cents above expectations, implying $2.54; on that basis, both measures beat. The Visible Alpha estimates published by Investopedia before the release were $25.43 billion in revenue and $2.75 in adjusted EPS, which would imply misses against that different snapshot. MedTech’s $8.642 billion in revenue missed the $8.71 billion LSEG estimate cited by Reuters. The more material investor question is why consolidated sales rose while adjusted EPS declined year over year.
Why did JNJ stock fall after its Q3 2026 earnings report?
JNJ declined 5.73% on October 13 despite exceeding one published set of consolidated expectations. MedTech missed its cited sales consensus, international device revenue was nearly flat operationally, adjusted pretax profitability contracted year over year, and management quantified substantial combined 2027 adjusted EPS dilution from two transactions. Uncertainty around the DePuy Synthes separation also complicates valuation. The stock remained 3.96% below its pre-results close as of October 15. These are evidence-based contributors and plausible interpretations of investor concerns, not proof of the motive behind every trade.
What is JNJ’s 2026 EPS guidance, and what should investors watch in 2027?
As of its October 13 report, JNJ guided to full-year 2026 adjusted EPS of $11.05–$11.15 and estimated reported sales of $101.0 billion–$101.4 billion. Management did not release a separate numerical Q4 EPS or revenue range. For 2027, the CFO forecast a combined $1.36-per-share adjusted EPS dilution from Firefly Bio and Sail Biomedicines, while reserving the broader 2027 financial framework for a later Enterprise Business Review. Investors should examine the eventual 2027 base earnings, the timing and form of the orthopaedics separation, clinical development spending, and whether core revenue growth converts into sustainable cash earnings.
Primary sources: Johnson & Johnson Investor Relations’ official Q3 2026 results and reconciliations and the October 13, 2026 earnings-call transcript hosted through the company’s investor materials. Third-party consensus and market-price references are linked at the corresponding discussion above.
Disclaimer: This article/chart is for educational and informational purposes only and does not constitute investment advice of any kind. Past performance is not indicative of future results. Investors should independently evaluate their own risks.