

Key Takeaways
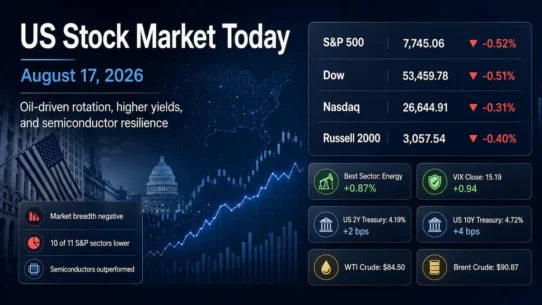
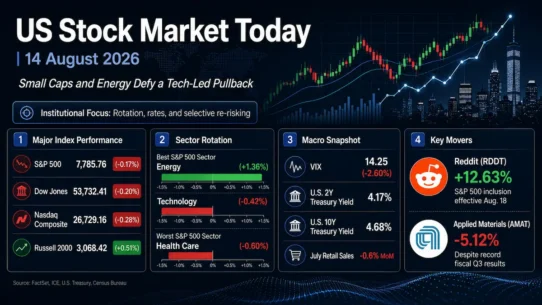
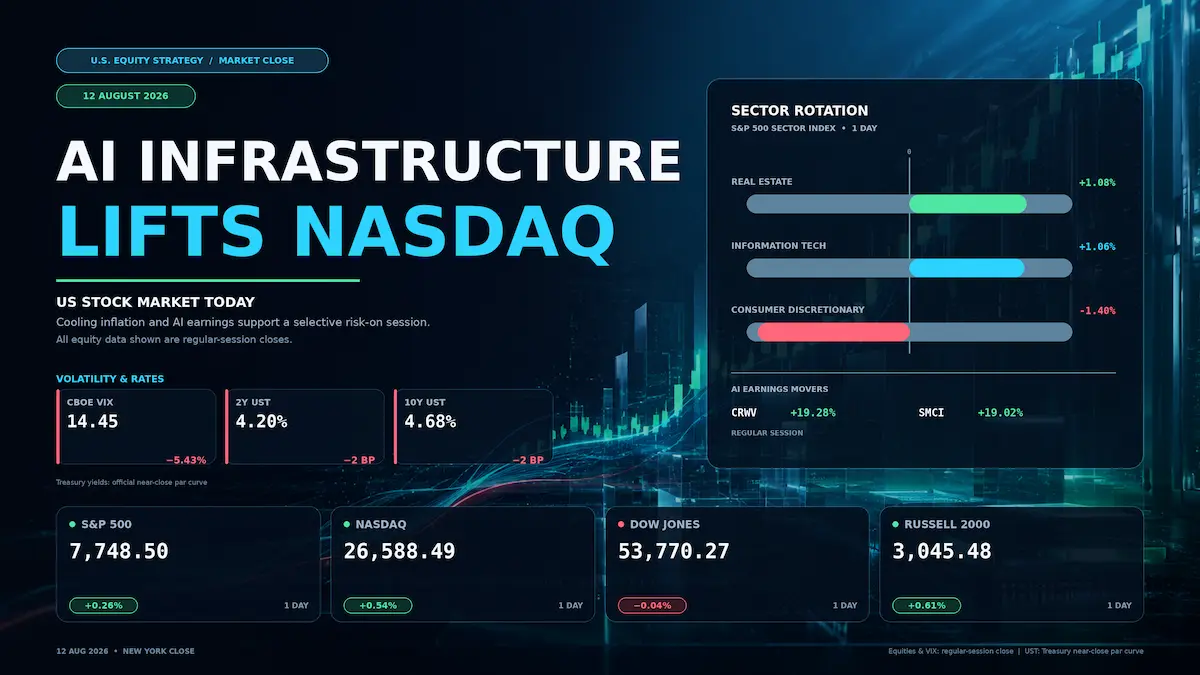
- All equity moves cited here are regular-session closes. The S&P 500 gained 0.26% to 7,748.50 and the Nasdaq Composite rose 0.54% to 26,588.49, while the Dow Jones Industrial Average slipped 0.04% to 53,770.27. The Russell 2000 advanced 0.61% to 3,045.48.
- Real estate led the S&P 500 sectors with a 1.08% gain, followed by information technology at 1.06%. Consumer discretionary was the clear laggard, falling 1.40%.
- July CPI rose 0.1% month over month and 3.4% year over year; core CPI increased 0.2% and 2.5%, respectively. The Treasury’s near-close par curve showed both the two-year and 10-year yields down 2 basis points, to 4.20% and 4.68%.
- CoreWeave and Super Micro Computer each surged about 19% after earnings reinforced the AI infrastructure spending cycle. The Cboe VIX closed at 14.45, down 0.83 point, or 5.43%.
1. Market Capital Flows and Sector Rotation:
The session’s capital rotation favored two different forms of duration exposure: long-duration AI growth and yield-sensitive real estate. According to the August 12 market close, eight of the S&P 500’s 11 sectors finished higher, with real estate up 1.08% and information technology up 1.06%. The S&P 500 Consumer Discretionary sector index fell 1.40%, the day’s worst sector performance. That split matters: cycle-sensitive exposure was not uniformly bid, because small caps outperformed large caps while consumer discretionary sold off. Defensive groups were mixed and did not control leadership. Growth also beat value: the official August 12 net asset values of the iShares Russell 1000 Growth ETF and iShares Russell 1000 Value ETF rose 0.69% and fell 0.08%, respectively.
Breadth was constructive but turnover was not emphatic. Advancing stocks outnumbered decliners by roughly 1.7 to 1 across U.S. exchanges, and the S&P 500 recorded 19 new 52-week highs against two new lows. However, about 15.5 billion shares changed hands, below the 20-session average of 17.5 billion. The combination suggests broader participation beneath the headline indexes, but not the volume confirmation normally associated with an indiscriminate risk-on breakout.
Institutional Flow Insight: The tape is consistent with, but does not prove, institutions adding exposure where lower yields improve valuation support and where earnings visibility is tied to contracted AI capacity. The rate-sensitive real estate rally was consistent with the 2-basis-point decline in the 10-year yield, while AI hardware and data-center names offered a company-specific earnings catalyst. At the same time, consumer discretionary’s weakness points to selectivity around demand visibility and concentrated mega-cap risk. The lower VIX may have allowed some risk budgets to expand, but light aggregate volume argues against interpreting the move as a wholesale portfolio re-risking.
2. Decoding the Biggest Market Movers:
CoreWeave (CRWV)
CoreWeave closed the regular session at $107.73, up 19.28%. Its official second-quarter release reported revenue of $2.575 billion, up 112% year over year, and adjusted EBITDA of $1.510 billion at a 59% margin. The company nevertheless recorded a $626 million GAAP net loss, equal to $1.14 per diluted share, with a negative 2% operating margin and $640 million of net interest expense. Backlog stood at approximately $104 billion and excluded more than $25 billion of net new commitments signed early in the third quarter.
The corrected earnings-call transcript hosted by CoreWeave IR confirmed that management raised full-year 2026 revenue guidance to $12.4 billion-$13.2 billion and capital-expenditure guidance to $35 billion-$39 billion. The equity response therefore reflected both demand validation and a larger buildout. That is constructive for AI accelerators, optical networking, power equipment and data-center construction, but it also raises execution and financing sensitivity: high interest expense and aggressive capital deployment make utilization, customer concentration and the cost of capital central to the valuation case.
Super Micro Computer (SMCI)
Super Micro Computer closed the regular session at $37.61, up 19.02%. The company’s official fiscal fourth-quarter release showed net sales of $11.1 billion, GAAP net income of $1.178 billion and GAAP diluted EPS of $1.62. GAAP gross margin rebounded to 17.5% from 9.9% in the prior quarter, while non-GAAP diluted EPS was $1.70. Management guided fiscal first-quarter 2027 revenue to $14.5 billion-$15.5 billion and fiscal-year 2027 revenue to $65 billion-$72 billion, supported by more than $60 billion of new orders and record backlog entering the year. The company’s official earnings webcast and replay provide the primary call record, while a contemporaneous transcript corroborates the reported figures.
The margin recovery was as important as the sales outlook because it reduced concern that rapid AI server growth was being purchased through structurally weak economics. Still, some contracts had shifted between quarters because of power, cooling and networking readiness, leaving shipment timing and working-capital demands as live risks. The read-through extended beyond one server vendor: Nvidia gained 3.03%, Micron rose 4.9% and the PHLX Semiconductor Index advanced about 2.5%. Together with CoreWeave’s capex plan, Supermicro’s guidance reinforced the view that spending is spreading from GPUs into complete racks, networking, power and cooling. That concentrated AI complex supplied much of the Nasdaq’s leadership even though broader market breadth was positive.
3. Macro Indicators and Market Outlook
The Cboe VIX finished at 14.45, down 0.83 point, or 5.43%, its lowest close since January. The decline was directionally consistent with the S&P 500’s gain and the positive advance-decline ratio, indicating that immediate index-option hedging demand eased after inflation data avoided an upside shock. A sub-15 VIX does not eliminate event risk, however. It leaves relatively little volatility premium against the upcoming producer-price report, elevated long-term yields and continued U.S.-Iran conflict and shipping uncertainty.
The U.S. Treasury’s official daily par yield curve, based on near-close indicative quotes, placed the two-year yield at 4.20% and the 10-year yield at 4.68%, both 2 basis points below August 11. The 2s10s curve remained positively sloped by 48 basis points. The Bureau of Labor Statistics reported July headline CPI of 0.1% month over month and 3.4% year over year, with core CPI at 0.2% and 2.5%. The softer monthly impulse reduced the urgency priced around another near-term tightening step; futures pricing cited after the release assigned a 62% probability to no September rate change. That is a market-implied distribution, not a policy commitment. The still-elevated 10-year yield and positive curve show that investors continue to demand compensation for inflation persistence, Treasury supply, growth uncertainty and term premium.
Upcoming Economic Data & Catalysts:
- Producer Price Index for July 2026 (Release date: August 13, 2026, at 8:30 a.m. ET): The official BLS schedule confirms the release. Markets will focus on pipeline price pressure and categories that inform the Fed’s preferred inflation measures; an upside surprise could challenge rate-sensitive real estate and long-duration growth valuations.
- Advance Monthly Sales for Retail and Food Services for July 2026 (Release date: August 14, 2026, at 8:30 a.m. ET): The U.S. Census Bureau calendar confirms the release. The report will test household-demand resilience and could reshape revenue expectations for retailers, restaurants and the broader consumer-discretionary complex.
Market Insights:
The advance was neither purely broad-based nor solely a mega-cap illusion. Eight positive sectors, a 1.7-to-1 advance-decline ratio and Russell 2000 outperformance show participation beyond the largest stocks. Yet the return leadership was concentrated in AI infrastructure, semiconductors and rate-sensitive real estate, while the Dow was flat and consumer discretionary fell sharply. The constructive signal would weaken if Treasury yields reverse higher, volume remains light as breadth deteriorates, AI companies trim backlog or capex expectations, geopolitical developments disrupt shipping, or the VIX breaks sustainably above its recent range.
Trading & Investment Strategy:
Risk management should take precedence over chasing 19% post-earnings gaps. Investors can phase entries, distinguish profitable AI suppliers from highly levered capacity builders, and size positions around earnings and financing volatility. A balanced approach can pair selected secular-growth exposure with cash-generative holdings and rate-sensitive positions that have explicit yield limits. Stops or review levels should be tied to a broken thesis, not normal intraday noise, and new allocations should leave room to respond to PPI, retail sales and a possible reversal in the 10-year yield.
4. Key FAQs About the US Stock Market Today
Why did the US stock market move on August 12, 2026?
The S&P 500 and Nasdaq rose because July CPI avoided an upside surprise, Treasury yields eased and earnings from CoreWeave and Super Micro Computer strengthened confidence in AI infrastructure spending. The Dow’s slight decline and consumer-discretionary weakness kept the session from becoming a uniform risk-on move.
Which sectors performed best and worst in the US stock market on August 12, 2026?
Real estate was the best-performing S&P 500 sector, up 1.08%, followed by information technology at 1.06%. Consumer discretionary was the worst, down 1.40%. Lower yields supported real estate, AI earnings lifted technology, and weak concentrated mega-cap exposure outweighed strength in selected restaurant stocks within discretionary.
What should investors watch after the US stock market close on August 12, 2026?
The next tests are the August 13 PPI report and the August 14 retail-sales release. Investors should also monitor whether the 10-year Treasury yield holds below its August 11 level, whether positive breadth survives heavier volume, and whether AI infrastructure guidance continues to support the wider semiconductor, networking and data-center supply chain.
Disclaimer: This article is intended solely for the exchange of investment ideas and does not constitute investment advice of any kind.