


Key Takeaways
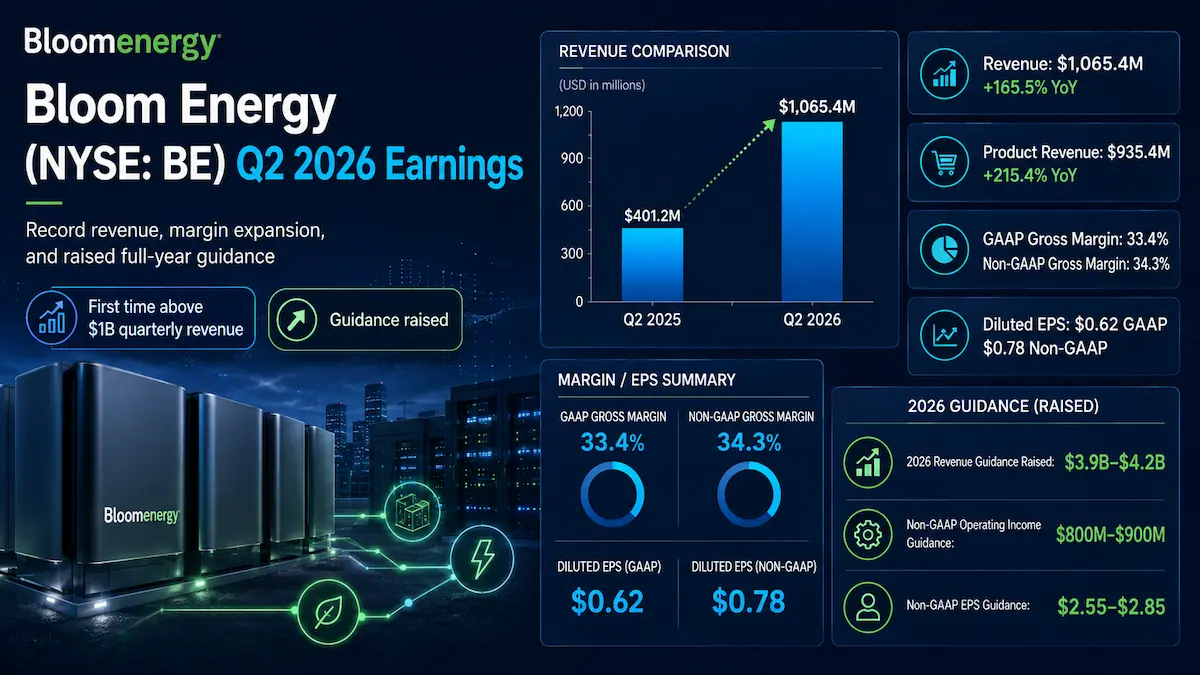
- Bloom Energy reported Q2 2026 revenue of $1.065 billion, up 165.5% year over year, with product revenue up 215.4% to $935.4 million. The company does not disclose an organic, constant-currency, or other “operational growth” bridge, so the 165.5% figure should be treated as reported growth rather than relabeled as organic growth.
- Profitability scaled faster than revenue: GAAP operating margin reached 17.1%, while non-GAAP operating margin reached 22.5%. The non-GAAP margin is useful for operating leverage analysis, but stock-based compensation accounted for almost all of the operating-income adjustment.
- The earnings beat was broad. Against FactSet consensus cited by Dow Jones, revenue beat by about 29.0% and non-GAAP EPS of $0.78 beat the $0.41 estimate by about 90.2%.
- Management raised full-year 2026 guidance to $3.9-$4.2 billion of revenue, approximately 34% non-GAAP gross margin, $800-$900 million of non-GAAP operating income, and $2.55-$2.85 of non-GAAP EPS. Bloom did not issue formal Q3 2026 revenue or EPS guidance.
- The investment debate has shifted from whether Bloom can reach scale to whether AI-driven demand, high-30s product gross margins, service economics and backlog conversion can persist long enough to justify a valuation of roughly 87x the midpoint of 2026 adjusted EPS at an intraday BE price near $236 on August 12, 2026.
1. Core Earnings Breakdown
Revenue and Profitability Analysis
Bloom Energy’s Q2 2026 results were not simply a high-growth quarter off an easy base. They marked a step-change in the absolute scale of the business. Revenue reached $1.065365 billion, up 165.5% from $401.242 million in Q2 2025 and up 41.8% sequentially from $751.054 million in Q1 2026. The company crossed $1 billion of quarterly revenue for the first time.
The most important distinction is that Bloom’s reported growth was overwhelmingly product-led. The company does not publish an organic-growth or foreign-exchange-neutral revenue bridge, so it would be inappropriate to describe the 165.5% headline increase as “operational growth” in the conventional organic-growth sense.
- Product revenue was $935.413 million, up 215.4% year over year and equal to 87.8% of total revenue. Product GAAP gross margin was 36.5% and non-GAAP product gross margin was 37.2%. Investment view: this is the core of the Q2 earnings inflection. Bloom is not merely shipping more units; the dominant revenue stream is now generating a gross margin high enough to support substantial operating leverage if pricing and manufacturing economics remain durable.
- Installation revenue was $50.978 million, up 36.4% year over year, calculated from company-reported figures of $50.978 million versus $37.372 million. GAAP installation gross margin was negative 3.6% and non-GAAP installation gross margin was negative 1.4%. Investment view: installation is strategically necessary to accelerate deployment, but its weak unit economics reinforce why the value of the model must be judged at the system, product and service level rather than from installation revenue alone.
- Service revenue was $69.023 million, up 26.8% year over year, calculated from company-reported figures of $69.023 million versus $54.449 million. GAAP service gross margin was 18.7% and non-GAAP service gross margin was 22.0%. Investment view: the service business is still small relative to hardware, but moving above 20% adjusted gross margin materially improves the lifetime economics of the installed base and can make repeat deployments more valuable than a one-time product sale.
- Electricity revenue was $9.951 million, down 22.3% year over year, calculated from company-reported figures of $9.951 million versus $12.810 million. GAAP and non-GAAP electricity gross margin were both 31.1%. Investment view: electricity revenue is currently too small to drive the equity thesis; its decline is far less important than the acceleration in product deliveries and improvement in service economics.
At the consolidated level, GAAP gross margin improved to 33.4% from 26.7% a year earlier, an increase of 668 basis points. Non-GAAP gross margin improved to 34.3% from 28.2%, an increase of 604 basis points. GAAP operating income swung to $182.237 million from a $3.503 million loss, producing a 17.1% GAAP operating margin. Non-GAAP operating income increased to $239.642 million from $28.643 million, and non-GAAP operating margin reached 22.5% from 7.1%.
The margin bridge matters because Q2 showed both operating leverage and a meaningful gap between GAAP and adjusted earnings. Stock-based compensation was $56.402 million in the operating-income reconciliation, while total adjustments from GAAP operating income to non-GAAP operating income were $57.405 million. In other words, the adjusted result is not being created by a long list of restructuring or transaction charges; almost the entire adjustment is stock-based compensation. That makes the non-GAAP margin analytically useful for operating leverage, but it also means investors should not treat the 22.5% margin as economically costless.
GAAP diluted EPS was $0.62 versus a loss of $0.18 a year earlier. Non-GAAP diluted EPS was $0.78 versus $0.10. Adjusted EBITDA reached $253.388 million. Cash flow from operations was $226.432 million versus a $213.111 million outflow in Q2 2025. Using the company’s reported $51.641 million of capital expenditures, a simple free-cash-flow calculation is $226.432 million minus $51.641 million, or $174.791 million, consistent with the CFO’s rounded $175 million figure on the call.
Expectations vs. Actual Results
Consensus data differs by provider. Dow Jones and The Wall Street Journal cited FactSet consensus of $826.1 million of revenue and $0.41 of adjusted EPS, while another published data feed showed $815.6 million and $0.40. To avoid mixing consensus sets, the comparisons below consistently use the FactSet figures cited by Dow Jones.
- Revenue: $1.065365 billion actual versus $826.1 million consensus — ✅ Beat by $239.265 million, or approximately 29.0%.
- Non-GAAP diluted EPS: $0.78 actual versus $0.41 consensus — ✅ Beat by $0.37, or approximately 90.2%.
- Operating margin: 17.1% GAAP and 22.5% non-GAAP actual. A sufficiently reliable pre-earnings consensus operating-margin estimate was not identified in the reviewed sources, so assigning a fabricated “beat” or “miss” label would be inappropriate.
- Full-year 2026 revenue guidance: raised to $3.9-$4.2 billion from the prior $3.4-$3.8 billion range.
- Full-year 2026 non-GAAP gross margin guidance: approximately 34%, unchanged from the prior quarter’s target.
- Full-year 2026 non-GAAP operating income guidance: raised to $800-$900 million from $600-$750 million.
- Full-year 2026 non-GAAP EPS guidance: raised to $2.55-$2.85 from $1.85-$2.25.
- Q3 2026 guidance: Bloom did not issue formal quarterly revenue, EPS or operating-margin guidance. The relevant forward-looking framework is the raised full-year outlook, not an invented Q3 number.
The true source of the beat was product conversion at scale. Product revenue alone exceeded the entire prior-year quarter’s total revenue by more than two times, and product gross margin expanded at the same time. That combination is much more valuable than a revenue beat driven by low-margin installation activity or a temporary accounting item. The second source was structural operating leverage: management said non-GAAP operating expenses grew 48% while revenue grew 166%, reflecting a largely fixed R&D and G&A base against rapidly scaling product deliveries.
The market is therefore likely to care more about three variables than the headline EPS beat in isolation: the cadence of product shipments, the durability of product and service margins, and the conversion of backlog plus in-year bookings into the raised full-year guidance. EPS is increasingly a consequence of those operating drivers rather than the primary driver itself.
The guidance raise was also more important than a routine quarterly beat. At the midpoint, the new $4.05 billion revenue outlook implies roughly 100% growth from 2025, while the $850 million midpoint of non-GAAP operating income implies an operating margin of about 21%. That is a materially different earnings model from the business investors were underwriting at the beginning of the year.
The initial stock reaction captured that upside surprise: BE closed at $166.84 on July 28, then rose more than 11% in after-hours trading. Yet on July 29 the stock reversed an early gain and finished down about 1.8% despite the beat and raise. That divergence should not be reduced to “sell the news.” Bloom entered the print with unusually high expectations and elevated volatility, while the broader AI complex was also under pressure. In addition, investors were still digesting short-seller allegations around materials sourcing and the execution risk embedded in a rapidly scaling data-center pipeline. A company can beat consensus decisively and still see its multiple compress if the market decides the durability threshold has risen faster than near-term earnings.
By August 12, 2026, BE had recovered well beyond the pre-earnings level. A live market quote captured at approximately 11:35 a.m. ET showed the stock near $236.08, about 41.5% above the July 28 regular-session close. That subsequent rerating reinforces the point that the immediate post-earnings reversal was not a clean verdict on Q2 fundamentals.
Earnings Call Highlights
- “Management said backlog is growing faster than revenue, while Bloom can also book, ship and recognize certain new orders within the same fiscal year.”
💡 Reading Between the Lines: The guidance model is no longer a simple backlog-conversion exercise. Bloom is deliberately reserving capacity for fast-cycle AI customers, which can produce upside when demand converts quickly but also increases the importance of execution, customer site readiness and forecasting discipline. - “CFO Simon Edwards described the operating leverage as structural: revenue grew 166% while operating expenses grew 48%, with R&D and G&A infrastructure largely fixed against a rapidly growing revenue base.”
💡 Reading Between the Lines: If product volume remains high, incremental revenue can carry unusually strong contribution margins. The valuation case increasingly depends on this cost architecture persisting through capacity expansion rather than reverting to a more labor- and overhead-intensive model. - “Management said the expanded Brookfield financing framework and Bloom’s modular ‘Copy Exactly!’ equipment reduce financing and project-timing friction, and that 2026 guidance is not dependent on a single project.”
💡 Reading Between the Lines: Financing is becoming part of Bloom’s competitive moat rather than merely a funding solution. If financiers can take title to fungible equipment and redeploy it across sites, Bloom can lower the revenue-at-risk from individual project delays; investors should still monitor concentration because one or two customers can dominate any single quarter’s reported revenue. - “Management said it will prioritize a strategic customer’s time-to-power even if expediting costs a point of quarterly margin, while pricing the solution on customer value rather than commodity electricity cost alone.”
💡 Reading Between the Lines: Bloom is explicitly optimizing for lifetime customer economics and speed rather than maximizing each quarter’s gross margin. This can create quarter-to-quarter margin noise, but it also suggests management believes scarcity value and accelerated AI revenue give Bloom room to defend pricing above a pure LCOE framework. - “Service non-GAAP gross margin reached 22%, the fifth consecutive quarter of double-digit service margin, and management said it believes a 20%+ level is sustainable over the long term.”
💡 Reading Between the Lines: Better stack life and fleet performance can transform service from a historical drag into a recurring-value layer on top of product sales. That matters for enterprise value because a larger installed base can generate higher-quality recurring economics and reinforce repeat-order behavior.
2. Deep Business Insights
Hidden Metrics That Matter
First, Q2’s gross profit was even more product-concentrated than revenue. Product revenue represented $935.413 million / $1,065.365 million = 87.8% of total revenue, calculated from company-reported figures. Product GAAP gross profit represented $341.456 million / $355.572 million = 96.0% of total GAAP gross profit, also calculated from company-reported figures. That 96% figure is strategically important: the earnings model is increasingly determined by Energy Server product pricing, factory cost-down and deployment volume rather than by a blended mix of lower-margin ancillary activities.
This is also why customers may choose Bloom even when another technology appears cheaper on a narrow cents-per-kilowatt-hour basis. Management’s commercial argument is built around time-to-power, modular deployment, permitting characteristics, reliability, financing availability and the ability to redeploy standardized equipment. For AI infrastructure, the economic comparison is not simply “fuel cell versus turbine cost.” It is the value of bringing a compute campus online months earlier and avoiding stranded accelerator capacity. That is a differentiated value proposition if Bloom can consistently execute it; the risk is that the pricing premium can narrow if competing power technologies improve delivery times.
Second, the quality of adjusted profitability needs to be viewed through stock-based compensation. The gap between non-GAAP and GAAP operating income was $239.642 million – $182.237 million = $57.405 million. Stock-based compensation of $56.402 million represented $56.402 million / $57.405 million = 98.3% of that operating-income adjustment and $56.402 million / $1,065.365 million = 5.3% of revenue, calculated from company-reported figures. This is preferable to an adjusted profit bridge dominated by restructuring charges, but it is still a real ownership cost through dilution. Shares outstanding rose from 280.045 million at December 31, 2025 to 293.354 million at June 30, 2026, an increase of approximately 4.8%, calculated from company-reported figures.
Cash generation was strong but should also be normalized across several quarters. Q2 operating cash flow of $226.432 million equaled 113.9% of reported net income of $198.856 million, calculated from company-reported figures. However, deferred revenue and customer deposits contributed $211.693 million of cash in the quarter, while accounts receivable and contract assets consumed a combined $224.336 million. The right conclusion is not that the cash flow was low quality; it is that Bloom’s working-capital model is becoming more consequential as deal sizes increase, so a multi-quarter conversion view is more informative than a single-quarter free-cash-flow margin.
One additional data point deserves attention. Related-party revenue was only $2.8 million in Q2 2026, versus $373.3 million in Q1 2026. On a reported-revenue basis, that is roughly 0.3% of Q2 revenue versus 49.7% of Q1 revenue, calculated from company-reported figures. This materially reduces the concern that Q2’s record revenue depended on the same related-party contribution pattern seen in Q1. It does not eliminate customer-concentration risk, because management explicitly said one or two customers can lead revenue in a given quarter.
Industry Chain Reactions
- ✅ Benefit — Vertiv Holdings (NYSE: VRT): Bloom’s Q2 is an indirect read-through for the broader AI data-center infrastructure stack. If on-site generation reduces power bottlenecks and pulls forward campus energization, spending on complementary electrical distribution, power management and thermal infrastructure can also be pulled forward. This is not Bloom guidance for Vertiv, but it strengthens the thesis that power availability can unlock rather than cap AI infrastructure deployment.
- ❌ Face Pressure — FuelCell Energy (NASDAQ: FCEL): Bloom’s scale, 37.2% non-GAAP product gross margin, expanded financing ecosystem and hyperscaler validation claims raise the competitive bar for smaller fuel-cell peers seeking data-center share. On the call, Sridhar said Bloom’s data-center fuel-cell market share was in the “very high 90s”; that is a management assertion rather than an independently audited market-share statistic, so it should be treated as a directional competitive claim, not a verified industry fact.
Valuation Framework and Key Risks
At approximately $236.08 intraday on August 12, 2026, BE is no longer priced as an early-stage fuel-cell turnaround. It is being valued as scarce, high-growth AI power infrastructure with substantial operating leverage.
Using the midpoint of management’s 2026 non-GAAP EPS guidance, $2.70, the stock trades at approximately $236.08 / $2.70 = 87.4x current-year adjusted EPS. Using the live market capitalization snapshot of roughly $76.2 billion and the $4.05 billion midpoint of revenue guidance, market capitalization is about 18.8x 2026 revenue. A rough enterprise value using $76.2 billion of market capitalization, $2.667 billion of cash and approximately $2.478 billion of recourse plus non-recourse debt is about $76.0 billion, excluding financing obligations and lease-like items; that implies approximately 18.8x enterprise value to 2026 revenue and about 89x enterprise value to the $850 million midpoint of non-GAAP operating income.
Those are demanding multiples. They imply that the market expects more than a one-year AI capex surge. To defend the valuation, Bloom likely needs a combination of continued backlog growth, sustained in-year bookings, high-30s product gross margins, service margins around or above 20%, manufacturing capacity additions without material cost leakage, and continued evidence that customers value months of time-to-power enough to support premium economics.
The bull case is therefore not simply “AI demand is strong.” It is that Bloom has become a speed-to-power platform with enough manufacturing modularity, financing access and product margin to translate AI power scarcity into durable earnings growth. The bear case is not simply “the stock is expensive.” It is that a large portion of future economics is already capitalized into the share price before investors have seen multiple years of normalized cash conversion and customer diversification at this new scale.
- Valuation risk: at roughly 87x the midpoint of 2026 adjusted EPS, even modest deceleration in bookings, margin expansion or AI infrastructure spending could trigger significant multiple compression.
- Project-timing and concentration risk: management said one or two customers can lead a quarter and that 2026 guidance includes both backlog conversion and in-year bookings. Modular equipment reduces project-specific exposure, but it does not eliminate timing risk.
- Margin-mix risk: management is willing to expedite deliveries at the expense of a point of quarterly margin. That can be rational for long-term value, but it means quarterly gross margin should not be extrapolated mechanically.
- Supply-chain and materials risk: management said Bloom has visibility for 25 GW of deployments and is not dependent on China for scandium. Those are management statements; given recent investor scrutiny, external diligence on critical-material sourcing remains warranted.
- Dilution risk: stock-based compensation was 5.3% of Q2 revenue on the operating-income reconciliation, and shares outstanding increased about 4.8% from year-end 2025 to June 30, 2026.
- Cash-conversion risk: Q2 free cash flow was strong, but working-capital movements were large. Customer deposits are economically valuable, yet investors should track whether cash conversion remains strong through different project and payment cycles.
- Competitive response risk: management argues time-to-power is more important than LCOE for AI customers, but turbine, engine, utility and alternative distributed-power suppliers are all incentivized to add capacity. A narrowing delivery-time advantage could pressure pricing power.
The valuation conclusion is therefore conditional. Q2 2026 materially improved the fundamental case by showing that Bloom can combine triple-digit reported revenue growth with positive GAAP operating income, strong product gross margin and positive free cash flow. But at the current multiple, the market is paying in advance for a multi-year continuation of that model. The next leg of upside will require evidence that the Q2 economics are repeatable, not simply another headline revenue beat.
3. Key FAQs
Did Bloom Energy beat Q2 2026 earnings expectations?
Yes. Bloom reported $1.065365 billion of revenue and $0.78 of non-GAAP diluted EPS. Using FactSet consensus cited by Dow Jones of $826.1 million of revenue and $0.41 of adjusted EPS, revenue beat by about 29.0% and adjusted EPS beat by about 90.2%. Consensus providers differed slightly, so investors should avoid mixing expectation sets when calculating the surprise.
What is Bloom Energy’s 2026 guidance after the Q2 2026 earnings report?
Bloom raised full-year 2026 revenue guidance to $3.9-$4.2 billion, maintained non-GAAP gross margin guidance at approximately 34%, raised non-GAAP operating income guidance to $800-$900 million, and raised non-GAAP EPS guidance to $2.55-$2.85. The company did not issue formal Q3 2026 revenue or EPS guidance.
Is BE stock expensive after Q2 2026 earnings?
On an intraday price near $236.08 on August 12, 2026, BE traded at roughly 87.4x the $2.70 midpoint of full-year 2026 adjusted EPS guidance and about 18.8x the midpoint of 2026 revenue guidance on a market-cap basis. That valuation can be supported only if investors expect unusually strong growth and margin durability beyond 2026. The key variables are backlog conversion, in-year bookings, product gross margin, service economics, cash conversion and the persistence of AI-driven time-to-power scarcity.
Source verification: Financial figures and formal guidance in this analysis are anchored to Bloom Energy’s official Q2 2026 earnings release, the official Q2 2026 earnings call page and webcast, and the official Q2 supplemental financial information. Bloom’s IR page provides the webcast and supplemental materials but did not publish a written transcript in the materials reviewed. Management-call wording in this article is therefore based on a published third-party transcript, with financial figures checked against company disclosures. Consensus comparisons use FactSet estimates cited by Dow Jones.
Disclaimer: This article/chart is for educational and informational purposes only and does not constitute investment advice of any kind. Past performance is not indicative of future results. Investors should independently evaluate their own risks.