

Key Takeaways
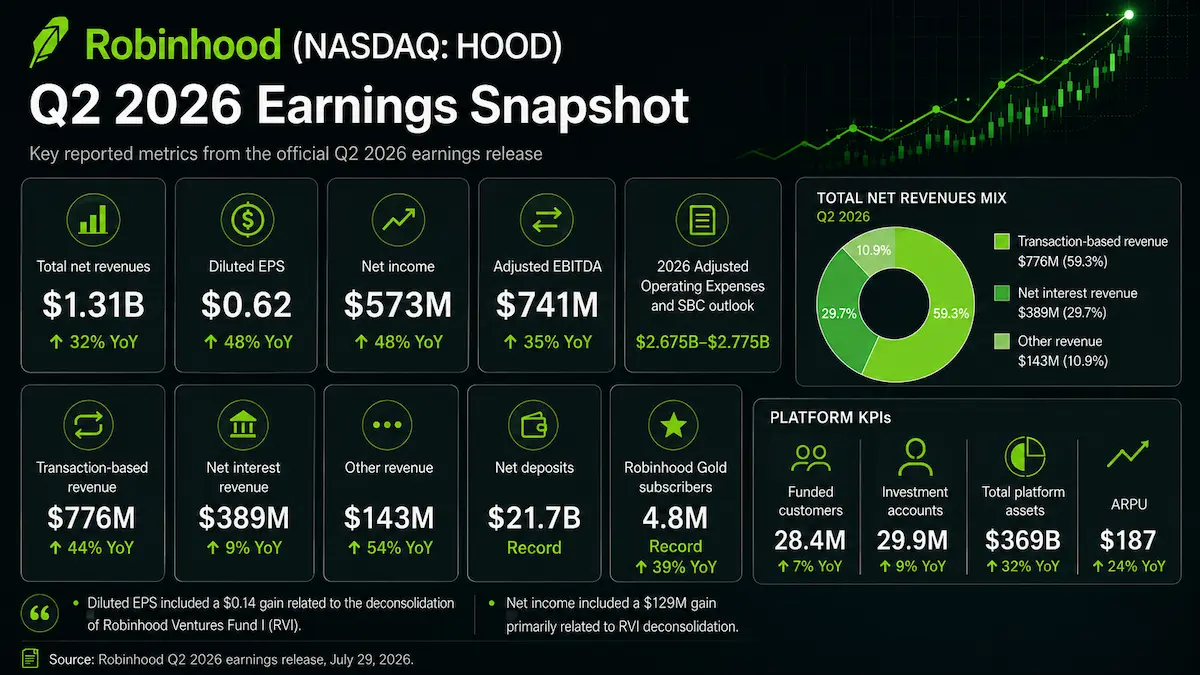
- Robinhood reported record Q2 2026 total net revenue of $1.308 billion, up 32% year over year, led by a 44% increase in transaction-based revenue to $776 million.
- GAAP diluted EPS was $0.62, but $0.14 came from gains primarily tied to the deconsolidation of Robinhood Ventures Fund I. A simple ex-gain EPS proxy is therefore $0.48, which is much closer to the underlying earnings result.
- Prediction-market event contracts generated $156 million of revenue, options generated $342 million and equities generated $129 million, while cryptocurrency transaction revenue fell 38% to $100 million. The mix is becoming less dependent on crypto, but more dependent on newer trading categories.
- Adjusted EBITDA rose 35% to $741 million, or a 56.7% margin, while management lowered and tightened full-year 2026 adjusted operating expense and SBC guidance to $2.675-$2.775 billion despite absorbing Rothera and WonderFi costs.
- The initial post-earnings share-price decline reflected earnings-quality, crypto and valuation concerns more than a simple headline miss. By August 12, 2026, HOOD had recovered to about $94.36 intraday, roughly 9% above its July 30 post-earnings close.
1. Core Earnings Breakdown
Revenue and Profitability Analysis
Robinhood’s Q2 2026 results were strong at the reported level, but the more important investment question is what drove the growth and how repeatable it is. Total net revenue reached $1.308 billion, up 32% from $989 million a year earlier and up 23% sequentially from $1.067 billion in Q1 2026.
- Transaction-based revenue: $776 million, up 44% year over year and equal to 59.3% of total revenue. This remains the largest revenue engine, but the internal mix changed materially.
- Options revenue: $342 million, up 29% year over year and 26.1% of total revenue. Options remain Robinhood’s largest individual transaction category, giving the company a durable active-trader monetization base but also keeping earnings sensitive to volatility and retail engagement.
- Event-contract revenue: $156 million, up more than 10x year over year and 11.9% of total revenue. Prediction markets have moved from experimental product to material earnings contributor; the investment debate now shifts from adoption to durability, take-rate stability and regulation.
- Equities revenue: $129 million, up 95% year over year and 9.9% of total revenue. The strong growth supports management’s market-share narrative and shows that Robinhood is monetizing active equity traders more effectively rather than relying solely on crypto cycles.
- Cryptocurrency transaction revenue: $100 million, down 38% year over year and only 7.6% of total revenue. This is the clearest weak spot. Total crypto notional volume was $40 billion, but $22 billion came from Bitstamp and Robinhood App crypto volume was only $18 billion, down 35% year over year, so the operational picture in the legacy app is weaker than the consolidated volume headline suggests.
- Net interest revenue: $389 million, up 9% year over year and 29.7% of total revenue. Higher interest-earning assets offset lower short-term rates and weaker securities-lending activity, making balance-sheet growth increasingly important to earnings resilience.
- Other revenue: $143 million, up 54% year over year and 10.9% of total revenue. Growth came primarily from Trump Account service revenue and higher Robinhood Gold subscription revenue, broadening monetization beyond trading.
Profitability also improved on an underlying basis, although the GAAP headline needs adjustment. Net income was $573 million, up 48%, for a reported net margin of 43.8%. However, net income included $129 million of gains primarily related to the RVI deconsolidation. Removing that amount mechanically produces a $444 million ex-gain net-income proxy and a 33.9% ex-gain net margin. This is calculated from company-reported figures and is not a company-defined adjusted net-income metric.
GAAP operating expenses rose 33% to $734 million. A simple GAAP operating-margin calculation is ($1.308 billion – $734 million) / $1.308 billion = 43.9%, calculated from company-reported figures. Adjusted operating expenses and SBC, a company non-GAAP measure, increased 23% to $641 million. Adjusted EBITDA rose 35% to $741 million, producing a 56.7% margin, broadly matching management’s rounded 57% disclosure. The key earnings-quality point is that adjusted EBITDA growth exceeded revenue growth, so the quarter was not strong only because of the RVI accounting gain.
Reported operating growth also needs a comparability caveat. Starting in June 2026, Funded Customers include WonderFi customers, Total Platform Assets include WonderFi cryptocurrency and Net Deposits include WonderFi results; Net Deposits also began including TradePMR in March 2026. The record customer and deposit figures are real reported numbers, but they are not perfectly organic like-for-like measures versus Q2 2025.
Expectations vs. Actual Results
- Revenue: $1.308 billion actual versus approximately $1.26 billion FactSet consensus cited before earnings. Result: ✅ Beat by about 3.8%.
- EPS: $0.62 GAAP reported versus a pre-report consensus around $0.41 in FactSet-based market coverage. Result: ✅ Headline beat, but the comparison overstates underlying earnings quality because $0.14 of reported EPS came from the RVI gain.
- Underlying EPS proxy: $0.62 – $0.14 RVI gain = $0.48, calculated from company-reported figures. Reuters/LSEG reported adjusted EPS of $0.48 versus a $0.44 analyst average. Result: ✅ Cleaner underlying beat of about 9.1%.
- GAAP operating margin: 43.9%, calculated from company-reported figures. A directly comparable verified public consensus operating-margin estimate was not disclosed in the FactSet/LSEG summaries reviewed, so no unverified estimate is inserted.
- Adjusted EBITDA: $741 million, 56.7% margin. Public post-earnings market summaries cited a Street estimate of roughly $630 million, implying an approximately 17.6% beat on this non-GAAP profitability measure.
The real source of the beat was broad rather than singular. Transaction revenue was strong in equities, options and prediction markets; net interest income held up despite lower short-term rates; Gold and service revenue expanded; and operating efficiency allowed adjusted EBITDA to outgrow revenue. The most important negative offset was crypto, where transaction revenue fell 38% and management said July crypto activity was running somewhat slower than Q2.
The market therefore had to decide whether to reward the diversified earnings engine or discount the quality and sustainability of the fastest-growing pieces. The first reaction was cautious. HOOD closed at $89.84 on July 29 before the earnings call, slipped roughly 0.8% in extended trading according to Reuters and then closed at $86.60 on July 30, a decline of about 3.6% from the prior close.
That reaction was not well explained by a generic “sell the news” label. Four issues mattered more. First, $0.14 of the $0.62 GAAP EPS came from a non-recurring RVI-related gain, making the headline EPS beat look larger than the underlying beat. Second, crypto remained weak and management’s July commentary suggested no immediate acceleration. Third, event contracts have become large enough that investors now need to underwrite seasonality, regulatory risk and take-rate durability rather than simply celebrate adoption. Fourth, the stock entered earnings with a premium valuation, so an earnings beat without formal Q3 revenue or EPS guidance was not sufficient to force an immediate re-rating.
Robinhood did not issue Q3 2026 revenue or EPS guidance. Instead, management provided operating color: July average daily volumes in equities, options and event contracts were running in a similar range to Q2, July take rates were also in a similar range, July net deposits were tracking toward roughly $4 billion before Trump Account deposits, and crypto activity was somewhat slower. For full-year 2026, management lowered and tightened adjusted operating expenses and SBC guidance to $2.675-$2.775 billion from $2.7-$2.825 billion, even though the new range now absorbs Rothera and WonderFi costs that had not been included in the prior outlook. The guidance excludes several potentially material items, including credit losses, pending-acquisition costs, certain restructuring and award-modification costs, and significant regulatory matters.
Earnings Call Highlights
- “Management said it can lower and tighten 2026 adjusted operating expense and SBC guidance while absorbing the added costs of Rothera and WonderFi.”
💡 Reading Between the Lines: The strategic message is that new growth bets are being funded from operating efficiencies rather than by allowing the cost base to expand at the same rate as product count. If sustained, that supports a higher long-term margin assumption; if excluded credit or regulatory costs rise, GAAP leverage could still disappoint. - “Prediction markets are being treated as a recurring customer-acquisition and engagement channel, not a one-event product, while Robinhood intends to route more flow through Rothera and remain connected to multiple venues.”
💡 Reading Between the Lines: Robinhood is trying to own both distribution and more of the exchange economics without becoming dependent on one venue. That can improve unit economics, but it also raises regulatory, liquidity and competitive-execution requirements as event contracts become a larger part of the model. - “New customers continue to adopt Gold at roughly 40%-50%, and management said customers who enter through one product often adopt others, including retirement, banking, credit card and prediction markets.”
💡 Reading Between the Lines: The key moat is increasingly cross-sell rather than commission-free brokerage itself. A customer acquired through a volatile product can become a recurring subscription, deposit, retirement or credit relationship, improving lifetime value and reducing reliance on any single trading cycle. - “Agentic Trading has passed 100,000 connected accounts, with options already added and crypto planned, but management acknowledged that setup friction and model behavior still limit mainstream use.”
💡 Reading Between the Lines: Agentic trading is strategically interesting but not yet a valuation pillar. The near-term economic value is optionality: if Robinhood can reduce setup friction and expose more platform tools to agents, automated activity could increase engagement and trading volume, but the product remains early and carries execution and compliance risk. - “July activity in equities, options and prediction markets was running near Q2 levels, while crypto was somewhat slower and take rates were broadly similar to Q2.”
💡 Reading Between the Lines: This was the closest management came to Q3 guidance. It argues against an immediate collapse in core trading activity, but it also signals that crypto is unlikely to be the near-term reacceleration engine investors once assumed.
2. Deep Business Insights
Hidden Metrics That Matter
One underappreciated metric is prediction-market monetization per contract. Robinhood reported $156 million of event-contract revenue and 13.6 billion event contracts traded in Q2. The simple calculation is $156 million / 13.6 billion = approximately $0.0115 of revenue per contract, or about 1.15 cents per contract. This is calculated from company-reported figures. It is not a company-disclosed take rate, because contract structures and economics can vary, but it provides a useful sensitivity anchor: once event contracts account for 11.9% of total company revenue, even small changes in per-contract economics can materially affect earnings.
A second hidden metric is how much of the 32% revenue growth came from monetization rather than user-count growth. Funded Customers rose 7% year over year, while ARPU rose 24%. Multiplying the two growth factors gives 1.07 × 1.24 = 1.3268, or approximately 32.7% implied revenue growth, very close to the reported 32%. This is calculated from company-reported figures. The implication is that Q2’s top-line growth was driven roughly as much by deeper wallet share and product monetization as by customer additions. The caveat is that the Funded Customer definition began including WonderFi customers in June, so the customer-growth series is not perfectly organic.
Why do customers choose Robinhood? The differentiation is no longer simply zero-commission equity trading. Robinhood is combining active trading, options, futures, prediction markets, crypto, cash management, banking, credit cards, retirement, advisory and international tokenized assets behind a common consumer interface. The earnings call provided evidence that these products are feeding one another: new customers show high Gold adoption, prediction-market users also use retirement products, the Gold Card has passed 1 million customers and banking deposits have exceeded $3 billion. That creates a distribution advantage in which one acquisition channel can monetize through several revenue pools.
The most important strategic test is whether this cross-sell remains efficient as the platform gets more complex. More products can raise lifetime value, but they also increase compliance, credit, customer-support and technology demands. The quarter’s lower expense outlook is therefore important because it suggests product breadth has not yet broken operating leverage.
Industry Chain Reactions
- ✅ Cboe Global Markets (CBOE) — Potential beneficiary. Robinhood’s event-contract growth validates retail demand for event-based derivatives. Management specifically discussed interest in financial KPI contracts and emphasized multi-venue connectivity. If the category broadens, established exchange operators with regulatory infrastructure can participate in a larger market, although Robinhood’s own Rothera economics could limit how much value leaks to third-party venues.
- ❌ Interactive Brokers (IBKR) — Potential pressure on ForecastEx economics. Robinhood said ForecastEx, IBKR’s designated contract market, was an early routing venue, but management expects more Robinhood flow to move through Rothera over time. Robinhood will remain multi-homed, so this is not a full displacement thesis, but a successful Rothera ramp could reduce the incremental value of Robinhood-originated event-contract volume to ForecastEx.
Valuation Framework and Key Risks
At approximately $94.36 intraday on August 12, 2026, HOOD had a market capitalization of roughly $86.1 billion and a trailing P/E of about 41.8x. For context, Interactive Brokers traded near 36.8x trailing earnings and Charles Schwab near 19.8x at the same time. These are not perfect comparables because Robinhood has a faster growth profile and a different mix of transaction, subscription and interest revenue, but the comparison shows that HOOD still carries a substantial growth premium.
The quality-adjusted earnings lens makes that premium more demanding. Q2 GAAP EPS of $0.62 annualizes to $2.48, implying a simple 38.0x run-rate multiple at $94.36, but that embeds the RVI gain. Using the $0.48 ex-RVI EPS proxy gives annualized run-rate EPS of $1.92 and a price-to-run-rate earnings multiple of about 49.1x. These are mechanical annualizations, calculated from company-reported figures, not forecasts.
An illustrative way to frame the expectation burden is that a 49.1x earnings multiple would need roughly 3.7 years of 20% annual EPS compounding to fall to approximately 25x if the share price did not move. That is not a forecast; it simply shows how much durable earnings growth is embedded in the current valuation.
- Prediction-market concentration and regulation: event contracts are already 11.9% of quarterly revenue. Sports seasonality, political-event cycles, pricing competition or adverse regulation could create meaningful volatility.
- Crypto weakness: crypto transaction revenue fell 38%, Robinhood App crypto volume fell 35% and management said July crypto activity was slower than Q2. Bitstamp adds scale, but it also makes consolidated volume less comparable with legacy organic activity.
- Credit-cycle exposure: provision for credit losses doubled year over year to $56 million while the margin book increased 127% to $21.6 billion and the credit-card business expanded. Higher monetization from lending and cards comes with higher loss sensitivity.
- Adjusted-versus-GAAP expense risk: the lowered expense outlook excludes credit losses, certain acquisition costs, potential significant regulatory matters and other items. Investors should not treat the $2.675-$2.775 billion range as a ceiling on GAAP operating expenses.
- Execution complexity: Robinhood is simultaneously scaling brokerage, prediction markets, banking, credit cards, advisory, international crypto, tokenized assets, a blockchain and agentic trading. Product velocity is a strength only if compliance, reliability and customer economics scale with it.
- Capital structure and dilution: Robinhood raised $2.2 billion through 0% convertible senior notes. Management said the capped-call structure creates no net dilution until the stock exceeds $300, and the company repurchased shares, but future capital allocation still matters to per-share value creation.
The valuation conclusion is therefore balanced. Q2 strengthened the case that Robinhood can grow beyond a single retail-trading cycle, and the combination of 32% revenue growth, a 57% adjusted EBITDA margin and lower expense guidance is economically meaningful. But at a premium multiple, the stock needs sustained net deposits, cross-sell, event-contract durability and credit discipline. The investment case is less about whether Q2 was good and more about whether the newer revenue pools can remain additive without increasing cyclicality or regulatory risk faster than earnings.
3. Key FAQs
Why did HOOD stock fall after Q2 2026 earnings even though Robinhood beat expectations?
The initial decline reflected a combination of factors. The $0.62 GAAP EPS headline included $0.14 of RVI-related gains, crypto revenue fell 38%, management did not issue formal Q3 revenue or EPS guidance, and prediction markets had become large enough that investors were debating sustainability and regulation. With HOOD already trading at a premium valuation, the market demanded more than a headline beat. The stock later recovered above its immediate post-earnings level.
How much of Robinhood’s Q2 2026 EPS came from one-time gains?
Robinhood reported GAAP diluted EPS of $0.62 and disclosed that $0.14 per share came from gains primarily related to the deconsolidation of Robinhood Ventures Fund I. A simple ex-gain EPS proxy is therefore $0.48. This calculation uses company-reported figures and should not be presented as an official company adjusted EPS metric.
What is Robinhood’s Q3 2026 guidance after the Q2 earnings report?
Robinhood did not provide formal Q3 revenue or EPS guidance. Management said July average daily volumes in equities, options and prediction markets were similar to Q2, take rates were also in a similar range, crypto was somewhat slower, and July net deposits were tracking toward roughly $4 billion before Trump Account deposits. For full-year 2026, the company lowered and tightened adjusted operating expenses and SBC guidance to $2.675-$2.775 billion.
Primary sources: Robinhood’s official Q2 2026 earnings release, official Q2 2026 earnings call transcript and Investor Relations page; consensus and immediate market-reaction references were cross-checked against Reuters/LSEG coverage.
Disclaimer: This article/chart is for educational and informational purposes only and does not constitute investment advice of any kind. Past performance is not indicative of future results. Investors should independently evaluate their own risks.