

Key Takeaways
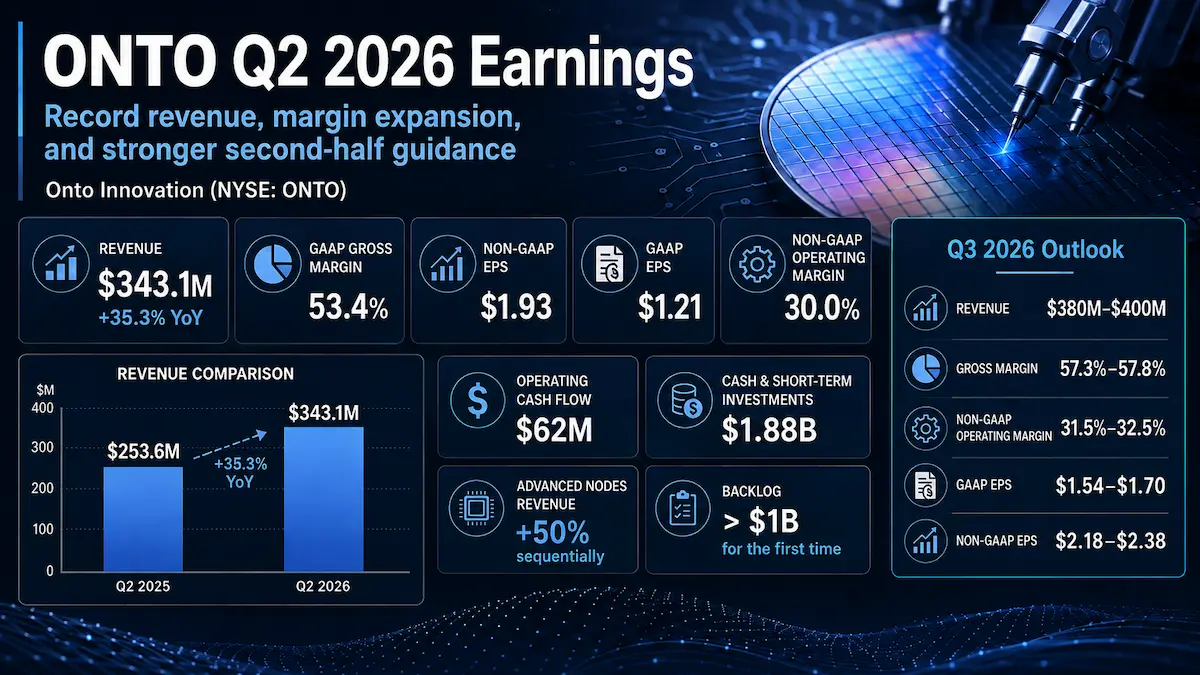
- Onto Innovation delivered Q2 2026 revenue of $343.129 million, up 35.3% year over year and 17.5% sequentially, versus a $325.25 million consensus estimate.
- Adjusted diluted EPS reached $1.93 versus $1.69 consensus, while non-GAAP operating margin expanded to 30.0%, 140 basis points above the high end of the company’s prior 28.0%-28.6% guidance.
- The quality of growth was stronger than the headline acquisition-assisted number: excluding Semilab USA’s disclosed $20.7 million Q2 contribution, legacy-business revenue was approximately $322.4 million, implying about 27.1% year-over-year growth, calculated from company-reported figures.
- Management raised second-half revenue growth to at least 25% above the first half, lifted the 2026 advanced-packaging growth outlook to about 80%, and disclosed backlog above $1.1 billion, with roughly 30%-40% tied to 2027.
- The stock closed at $308.30 on August 7, up 14.7% from the pre-earnings close, and traded around $336.77 intraday on August 12. The debate has therefore shifted from whether growth is accelerating to how much acceleration is already embedded in valuation.
1. Core Earnings Breakdown
Revenue and Profitability Analysis
Onto Innovation’s Q2 2026 revenue was $343.129 million, compared with $253.597 million in Q2 2025. That is reported growth of 35.3% year over year and 17.5% sequentially from $291.949 million in Q1 2026. The distinction between reported and operational growth matters because the November 2025 Semilab USA acquisition contributed $20.7 million of Q2 2026 revenue. Subtracting that contribution gives approximately $322.429 million of legacy-business revenue; $322.429 million divided by $253.597 million minus one equals approximately 27.1% year-over-year growth. This is calculated from company-reported figures and should be treated as an approximate legacy-business growth rate, not as a company-reported organic-growth metric.
The revenue mix shows why the earnings beat carried unusually strong incremental margins. Systems and software generated $294.040 million, or 85.7% of total revenue, up 37.1% year over year. This is the most important mix shift because the 10-Q explicitly attributes sequential gross-margin improvement to stronger sales of higher-margin inspection and metrology product lines. In other words, the quarter was not merely larger; it was larger in the part of the portfolio with the greatest operating leverage.
Parts revenue was $28.713 million, or 8.4% of revenue, up 44.7% year over year. That growth is a useful installed-base signal: more deployed systems and higher customer support activity create recurring demand for spares, making parts growth a secondary confirmation that the equipment cycle is translating into utilization rather than only purchase orders.
Services revenue was $20.376 million, or 5.9% of revenue, up 5.9% year over year. Services grew much more slowly than systems and parts, so the present earnings acceleration is still primarily a product-cycle story rather than a recurring-service mix story. That makes the upside more powerful when capex is rising, but it also leaves the model more exposed to future equipment-cycle normalization.
At the market level, Advanced Nodes revenue increased 50% sequentially to approximately $120 million, a new quarterly record and about 35.0% of total Q2 revenue, calculated from company-reported figures. Management said memory represented about 60% of Advanced Nodes and logic about 40%, with memory growing roughly 60% sequentially and logic more than 40%. That balance matters because it argues that the result was not dependent on one narrow memory inflection; Onto is gaining process-control content across both leading-edge memory and logic.
Advanced Packaging and Specialty Devices together represented nearly half of Q2 revenue. Within that mix, the inspection business, led by Dragonfly, grew 30% sequentially on 2.5D logic and HBM demand. Other packaging and specialty applications, including power and silicon carbide, declined sequentially as expected, but management expects those areas to rebound to Q1 levels in Q3. The portfolio is therefore rotating toward AI-related advanced packaging faster than the aggregate specialty-device label suggests.
Profitability improved on both GAAP and adjusted bases, but investors should not conflate the two. GAAP gross margin was 53.4%, versus 48.2% a year earlier. Non-GAAP gross margin was 57.0%, versus 54.5%. GAAP operating income was $63.550 million, or 18.5% of revenue, while non-GAAP operating income was $102.820 million, or 30.0%. GAAP diluted EPS was $1.21, versus $0.69 a year earlier; adjusted diluted EPS was $1.93, versus $1.25.
The $0.72 per-share gap between GAAP and adjusted EPS is material. The reconciliation included $0.17 per share of merger-and-acquisition-related expenses, $0.31 of restructuring and other items, $0.39 of intangible amortization, offset by a $0.15 tax adjustment. Semilab USA also contributed a $4.5 million operating loss in Q2. The right conclusion is not that adjusted earnings are low quality: operating cash flow of about $62 million slightly exceeded GAAP net income of $60.1 million. Rather, the acquisition strategy creates real recurring amortization and integration costs that should remain visible in a valuation model even when adjusted EPS is the better gauge of near-term operating momentum.
Expectations vs. Actual Results
- Revenue: $343.129 million actual versus $325.25 million consensus — ✅ beat by approximately $17.88 million, or 5.5%.
- Adjusted diluted EPS: $1.93 actual versus $1.69 consensus — ✅ beat by $0.24, or 14.2%.
- Non-GAAP operating margin: 30.0% actual versus prior company guidance of 28.0%-28.6% — ✅ beat the high end by 140 basis points. A reliable public Street consensus operating-margin figure was not available in the verified sources, so the comparison uses management’s prior guidance rather than an invented consensus number.
- GAAP operating margin: 18.5% actual versus prior company guidance of 17.8%-18.7% — within guidance, and 20 basis points below the high end. This is an important reminder that the headline margin beat was specifically an adjusted-margin beat.
- GAAP diluted EPS: $1.21 actual versus prior company guidance of $1.09-$1.18 — ✅ above the high end by $0.03.
- Adjusted diluted EPS versus company guidance: $1.93 actual versus $1.65-$1.73 — ✅ above the high end by $0.20.
The beat came from three sources. First, revenue volume was stronger than expected across both Advanced Nodes and Advanced Packaging. Second, product mix skewed toward higher-margin inspection and metrology systems. Third, operational improvements from extended factories, supply-chain localization, lower freight intensity and productivity gains converted the revenue upside into disproportionately stronger adjusted earnings.
The market had more reason to focus on guidance and backlog than on the backward-looking Q2 beat. For Q3 2026, Onto guided to revenue of $380 million-$400 million, gross margin of 57.3%-57.8%, GAAP operating margin of 21.4%-22.4%, non-GAAP operating margin of 31.5%-32.5%, GAAP diluted EPS of $1.54-$1.70 and adjusted diluted EPS of $2.18-$2.38. Management also said Q4 revenue should be higher than Q3 and raised second-half revenue growth to at least 25% above first-half revenue, versus a prior expectation of 15%.
That revision changes the earnings narrative. The first half produced $635.078 million of revenue. A second half at least 25% above that level implies at least about $793.8 million of H2 revenue, calculated from company-reported figures. Using the $390 million midpoint of Q3 guidance would leave roughly $403.8 million or more for Q4, consistent with management’s call commentary that the 25% floor points to Q4 revenue in the low-$400 million range. That is not a formal Q4 guidance range, but it shows the magnitude of the acceleration embedded in management’s updated second-half framework.
The stock reaction was consistent with investors rewarding the forward indicators rather than merely the reported beat. ONTO closed at $268.70 on August 6 before the earnings release and at $308.30 on August 7, a 14.7% one-day gain. It traded around $336.77 intraday on August 12, roughly 25.3% above the pre-earnings close. There is therefore no contradiction between the surface results and the price action: the market treated the $1.1 billion-plus backlog, the 80% advanced-packaging growth outlook and the step-up in second-half revenue as evidence that the earnings cycle is still moving upward.
Earnings Call Highlights
Management raised second-half revenue growth to at least 25% above the first half, from a prior 15% expectation, while indicating Q4 revenue should exceed Q3.
💡 Reading Between the Lines: This is more than a one-quarter beat. The internal demand plan has moved up enough to raise both volume and margin assumptions, which means the earnings revision cycle can continue if backlog converts on schedule. The key valuation question is now durability into 2027 rather than whether Q3 can beat.
Advanced-packaging growth for 2026 is now expected at approximately 80%, up from 50%, with more than $200 million of Dragonfly orders from a single OSAT partner and most of those deliveries scheduled for 2027.
💡 Reading Between the Lines: Dragonfly G5 is moving from a cyclical product win to a capacity-planning input for customers. A single large order increases concentration risk, but delivery timing into 2027 also extends revenue visibility beyond the current AI capex year and raises the probability that Onto is gaining wallet share within advanced packaging.
Backlog exceeded $1.1 billion, with management estimating roughly 60%-70% tied to 2026 and 30%-40% tied to 2027.
💡 Reading Between the Lines: Customers are ordering earlier than historical norms to secure supply. That improves near-term visibility, but it also means future investors must distinguish true end-demand expansion from timing pull-forwards; backlog quality will matter more than backlog size if lead times normalize.
Management expects the Dragonfly G5 mix to create additional average-selling-price lift, while extended factories and localized supply chains continue to support gross-margin expansion.
💡 Reading Between the Lines: The margin story has two engines: structural cost improvement and product-value improvement. The former can plateau; the latter can persist if G5 adoption broadens. That makes product mix, not simply revenue growth, the more important driver of the long-term earnings multiple.
Onto is expanding its served market through Atlas G6 below 2 nm, silicon photonics, panel-level packaging and a new X-ray process-control partnership with Rigaku.
💡 Reading Between the Lines: Management is deliberately widening the process-control wallet per customer rather than relying on one inspection platform. If the strategy works, Onto can compound faster than wafer-fab-equipment spending; if it fails, the $710 million planned Rigaku stake and prior Semilab acquisition could leave the company with more capital tied up in adjacencies than the market currently prices for.
2. Deep Business Insights
Hidden Metrics That Matter
One underappreciated metric is the amount of backlog relative to current revenue. Using the disclosed backlog floor of $1.1 billion and Q2 revenue of $343.129 million, $1.1 billion divided by $343.129 million equals approximately 3.2 times one quarter of revenue. This is calculated from company-reported figures. Using management’s 30%-40% 2027 backlog mix and the $1.1 billion floor implies roughly $330 million-$440 million of backlog associated with 2027, also calculated from company-reported figures. Because actual backlog is above $1.1 billion, these dollar figures are conservative floor-based estimates rather than precise company guidance.
The second hidden metric is acquisition-adjusted operating momentum. Reported Q2 growth was 35.3%, but Semilab USA contributed $20.7 million. The calculation is simple: $343.129 million less $20.7 million equals $322.429 million; $322.429 million divided by Q2 2025 revenue of $253.597 million minus one equals about 27.1%. This is calculated from company-reported figures. The implication is that the core business was already expanding at a high-20s rate even before counting acquired revenue. That materially improves the quality of the reported growth rate.
Why are customers choosing Onto? The answer is increasingly portfolio breadth tied to yield economics. In advanced packaging, Onto can combine Dragonfly inspection, metrology functions, JetStep lithography, Firefly process control and Discover software. In advanced nodes, Atlas G6, Iris films metrology and integrated metrology increase the number of process-control steps Onto can address per wafer-start expansion. Customers do not buy these tools because inspection itself is strategically interesting; they buy them because heterogeneous integration, HBM stacks, sub-2-nanometer structures and silicon-photonics packages make yield losses increasingly expensive. A supplier that can detect, measure and feed process data across multiple manufacturing steps can justify higher tool content when the cost of a defective advanced package rises faster than the cost of process control.
Industry Chain Reactions
- ✅ Benefit — Amkor Technology (NASDAQ: AMKR): Onto’s unusually strong 2.5D, HBM and OSAT-related demand is a positive read-through for advanced-packaging capacity utilization and customer willingness to commit capital further into 2027. The inference does not identify Amkor as Onto’s unnamed $200 million-plus OSAT customer; that customer was not disclosed. The investment relevance is broader: strong process-control ordering by OSATs suggests packaging complexity and capacity additions remain economically important.
- ❌ Face Pressure — Camtek (NASDAQ: CAMT): Onto identifies Camtek as a principal competitor in advanced-packaging inspection, while Camtek itself targets HBM, chiplets and advanced packaging. Dragonfly G5’s 30% sequential inspection growth, broadened applications and $200 million-plus single-OSAT order suggest Onto is competing aggressively for the same high-growth inspection budget. This does not imply Camtek’s end market is weakening; it implies a stronger market may still produce share pressure if Onto’s platform gains adoption faster.
Valuation Framework and Key Risks
At approximately $336.77 intraday on August 12, 2026, Onto’s market capitalization was about $16.7 billion. The Q2 balance sheet held $1.882 billion of cash, cash equivalents and marketable securities and approximately $1.472 billion of 2031 convertible notes, implying roughly $410 million of net cash before considering the planned Rigaku investment. On that basis, enterprise value is approximately $16.32 billion.
Traditional trailing GAAP valuation is demanding: market data at the time showed a trailing P/E of roughly 86 times. A more useful operating sanity check is to compare the current price with the Q3 adjusted EPS midpoint of $2.28. Annualizing that single-quarter midpoint gives $9.12 per share, and $336.77 divided by $9.12 equals about 36.9 times. This is not a full-year EPS forecast and should not be treated as one; it is simply a run-rate multiple showing how much of the premium disappears if Q3 earnings become sustainable rather than peak.
The same exercise on revenue is also instructive. The Q3 revenue midpoint is $390 million. Annualizing that quarter produces a $1.56 billion revenue run rate; approximately $16.32 billion of enterprise value divided by $1.56 billion equals about 10.5 times run-rate sales. Again, this is an illustrative run-rate framework, not a company forecast. At that multiple, investors are paying for continued high growth, sustained margin expansion and multi-year share gains rather than merely a cyclical rebound.
The biggest upside to the valuation framework is that Onto may be evolving from a narrower process-control supplier into a broader beneficiary of advanced-node and heterogeneous-packaging complexity. If Advanced Packaging grows around 80% in 2026, Advanced Nodes grows more than 35%, Dragonfly G5 lifts ASPs, and gross margin continues to expand into 2027, earnings could compound faster than revenue and justify a premium to slower semiconductor-equipment peers.
The risks are equally specific. First, backlog can contain timing risk: customers ordering earlier to secure supply can create future air pockets if capacity plans are delayed. Second, advanced packaging is becoming a larger part of the mix, which increases exposure to a concentrated set of AI, HBM and 2.5D investment programs. Third, the gap between GAAP and adjusted earnings remains large because of acquisition amortization, restructuring and integration items; investors should not capitalize adjusted EPS without considering the cash and strategic cost of M&A. Fourth, inventory increased to $379.243 million from $298.264 million at the start of the fiscal year, up about 27.2%, calculated from company-reported figures, as Onto positioned for faster revenue and supply continuity. That is rational in an upcycle but becomes a working-capital and obsolescence risk if customer schedules slip.
Capital allocation also deserves more attention than it receives in an earnings-beat narrative. Onto raised $1.5 billion of 0% convertible debt due 2031, generating about $1.2 billion of net cash after using part of the proceeds for roughly $200 million of share repurchases, capped-call purchases and fees. The capped call increases the strike price for dilution purposes to $509.06 per share, which mitigates but does not eliminate capital-structure complexity. Separately, Onto agreed to acquire a 27% stake in Rigaku for approximately $710 million, expected to close in the second half of 2026 and to be accounted for as a non-consolidated investment. If the strategic partnership expands Onto’s X-ray process-control opportunity, the investment could deepen the moat; if commercialization takes longer than expected, the market may question the return on capital.
The practical valuation conclusion is that ONTO no longer looks priced for a normal semiconductor-equipment cycle. The current price implies confidence in sustained AI-related packaging investment, ongoing market-share gains, continued margin expansion and meaningful 2027 backlog conversion. Those expectations are supported by Q2 evidence, but they also raise the cost of execution errors. The stock can continue to work if estimates keep rising; the risk/reward becomes less forgiving if bookings flatten, gross-margin gains stall or advanced-packaging growth normalizes faster than management currently sees.
3. Key FAQs
Why did ONTO stock rise after Q2 2026 earnings?
ONTO rose because the report combined a meaningful revenue and adjusted-EPS beat with stronger forward indicators. Revenue beat consensus by about 5.5%, adjusted EPS beat by 14.2%, non-GAAP operating margin reached 30.0%, management raised second-half revenue growth to at least 25% above the first half, and backlog exceeded $1.1 billion. The stock closed 14.7% higher on August 7, indicating the market placed substantial value on the upgraded growth path and 2027 visibility.
What was Onto Innovation’s Q3 2026 guidance after the Q2 earnings report?
Onto guided Q3 revenue to $380 million-$400 million, gross margin to 57.3%-57.8%, GAAP operating margin to 21.4%-22.4%, non-GAAP operating margin to 31.5%-32.5%, GAAP diluted EPS to $1.54-$1.70 and adjusted diluted EPS to $2.18-$2.38. Management also said Q4 revenue should exceed Q3 and indicated that its second-half revenue-growth floor points to Q4 revenue in the low-$400 million range, although no formal Q4 range was issued.
Is ONTO Q2 2026 earnings growth organic or acquisition-driven?
Both factors contributed, but the underlying business remained strong. Reported Q2 revenue grew 35.3% year over year. Semilab USA contributed $20.7 million of Q2 revenue. Excluding that disclosed contribution produces approximately $322.4 million of legacy-business revenue, or about 27.1% year-over-year growth, calculated from company-reported figures. That calculation is not a company-defined organic-growth metric, but it shows that most of the growth was not simply acquired revenue.
Primary sources include Onto Innovation’s official Q2 2026 earnings release, its Investor Relations quarterly-results page, and the Q2 2026 Form 10-Q filed with the SEC. Earnings-call wording was cross-checked against a published transcript; Onto’s IR materials provide webcast/replay access, but no company-issued text transcript was located as of August 12, 2026.
Disclaimer: This article/chart is for educational and informational purposes only and does not constitute investment advice of any kind. Past performance is not indicative of future results. Investors should independently evaluate their own risks.