

Key Takeaways
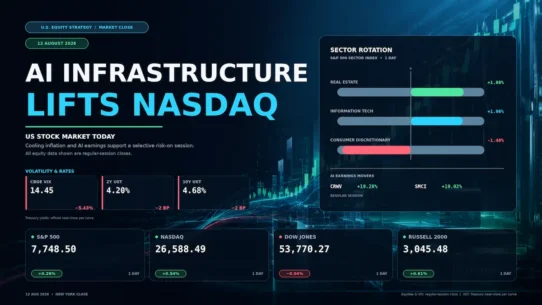
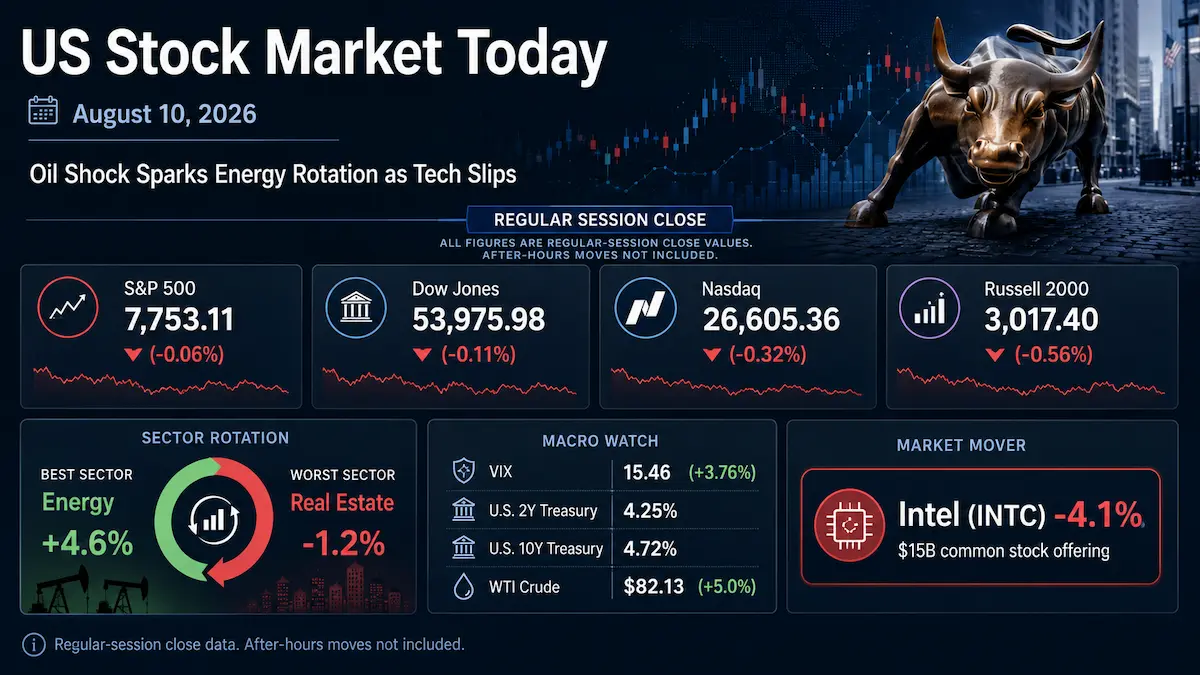
- The S&P 500 slipped 0.06% to 7,753.11, the Dow Jones Industrial Average fell 0.11% to 53,975.98, the Nasdaq Composite lost 0.32% to 26,605.36, and the Russell 2000 dropped about 0.56% to 3,017.40 in the regular session.
- Energy was the clear S&P 500 sector leader, rising 4.6%, while real estate was the worst performer at -1.2%. The split reflected a sharp oil-driven inflation and duration trade rather than broad-based equity liquidation.
- WTI crude settled around 5% higher at $82.13 a barrel as hopes for a near-term reopening of the Strait of Hormuz faded, reviving inflation concerns and pushing Treasury yields higher.
- The Cboe VIX closed at 15.46, up 0.56 point or 3.76%, while official constant-maturity data put the two-year Treasury yield at 4.25% and the 10-year at 4.72%.
- Intel fell 4.1% in the regular session after announcing a $15 billion common-stock offering, reinforcing investor sensitivity to dilution and the capital intensity of the AI infrastructure cycle.
1. Market Capital Flows and Sector Rotation:
The August 10 session was better described as a rotation shock than a market-wide risk-off event. Energy surged 4.6%, the best performance among the S&P 500 sectors, as the oil spike improved near-term cash-flow sensitivity for producers and refiners. Real estate fell 1.2%, the weakest sector, while utilities and consumer staples also lagged as higher Treasury yields reduced the relative appeal of bond-proxy equities. Technology weakened as well, with semiconductor pressure contributing to the Nasdaq’s underperformance. Large caps held up better than small caps: the S&P 500 lost only 0.06%, versus roughly 0.56% for the Russell 2000. Value-oriented exposure, led by energy, outperformed growth, while the session did not produce a classic defensive bid because several defensive, rate-sensitive groups were themselves pressured by higher yields.
Market breadth was weaker than the headline S&P 500 move suggested. Declining issues outnumbered advancers by roughly 1.39-to-1 on the NYSE and about 1.47-to-1 on the Nasdaq. That divergence matters: the capitalization-weighted S&P 500 was nearly flat, but the average stock faced more pressure, indicating that the index-level resilience understated the degree of internal de-risking.
Institutional Flow Insight: The price action is consistent with a tactical reduction in duration exposure rather than wholesale risk liquidation. Portfolio managers may have trimmed high-multiple technology, REITs and other yield-sensitive positions as oil revived inflation risk and pushed discount rates higher, while adding commodity-linked earnings exposure in energy. The modest rise in VIX and limited decline in the S&P 500 argue against a broad volatility-targeting unwind. With July CPI only two sessions away, the more plausible institutional response was selective risk rebalancing toward better near-term cash-flow sensitivity and away from assets whose valuations depend more heavily on stable or falling long-term yields.
2. Decoding the Biggest Market Movers:
Intel (INTC)
Intel fell 4.1% in the regular session after announcing a $15 billion underwritten public offering of common stock. The company said proceeds are intended for general corporate purposes, including capital expenditures and working capital, and that the underwriters are expected to receive a 30-day option to purchase up to an additional $2.25 billion of shares. Intel framed the financing around sustained AI-compute demand and opportunities in physical AI, purpose-built silicon, advanced packaging and external wafers, but the market’s immediate reaction focused on dilution and the amount of capital required to fund the expansion.
The financing should be read against Intel’s latest officially reported operating profile. For Q2 2026, Intel reported revenue of $16.1 billion, up 25% year over year, GAAP gross margin of 40.4%, GAAP EPS of -$2.16 and non-GAAP EPS of $0.42. Management’s official Q3 outlook calls for revenue of $15.8 billion to $16.8 billion, GAAP gross margin of 41.0%, non-GAAP gross margin of 42.0%, GAAP EPS of $0.31 and non-GAAP EPS of $0.38. Intel’s IR site provides the earnings release, webcast and management’s Prepared Remarks for the July 23 earnings call; the figures cited here are drawn only from those official disclosures.
For the broader semiconductor complex, Intel’s decline highlights a key valuation issue in the AI cycle: demand visibility can remain strong while the financing burden becomes more important to equity holders. A capital-intensive expansion funded with new shares raises the hurdle rate investors apply to future returns on foundry, packaging and AI infrastructure investment. That concern landed on a day when Nvidia also fell 2.9%, adding pressure to the Nasdaq and reinforcing scrutiny of how aggressively the industry is funding the next leg of AI capacity.
3. Macro Indicators and Market Outlook
The Cboe VIX closed at 15.46, up 0.56 point or 3.76% from the prior close of 14.90. The direction was consistent with the weaker equity session and a rise in event hedging ahead of inflation data, but the absolute level remained subdued. A VIX in the mid-teens does not signal market panic; instead, it suggests investors paid somewhat more for near-term protection without moving into a disorderly volatility regime.
Official constant-maturity data put the U.S. two-year Treasury yield at 4.25% on August 10, up about 6 basis points from 4.19% on August 7, while the 10-year yield rose to 4.72% from 4.65%, an increase of about 7 basis points. The 2s10s curve therefore remained positively sloped at roughly 47 basis points. The simultaneous rise in front-end and long-end yields is consistent with a market reassessing both near-term policy sensitivity and longer-run inflation or term-premium risk after the oil surge. It should not be interpreted as confirmation of any specific Federal Reserve move from a single session.
Oil was the most useful cross-asset signal. WTI crude settled near $82.13 a barrel, up about 5%, as expectations for a near-term resolution around the Strait of Hormuz weakened. That move directly strengthened energy equities while simultaneously increasing the inflation premium embedded in bond yields, creating a two-sided equity effect: better nominal earnings leverage for energy companies but a higher discount rate for long-duration growth and rate-sensitive defensives.
Upcoming Economic Data & Catalysts:
- Consumer Price Index for July 2026 (Release date: August 12, 2026): Investors will focus on whether consumer inflation confirms, offsets or complicates the disinflation narrative following the weak July payroll report. The release is likely to matter most through its impact on real yields, Federal Reserve policy pricing and valuation-sensitive growth stocks.
- Producer Price Index for July 2026 (Release date: August 13, 2026): PPI will provide a second read on pipeline inflation and corporate input-cost pressure. A meaningful surprise could affect Treasury yields, margin assumptions and the market’s willingness to pay premium multiples for companies with less pricing power.
Market Insights:
The session was not driven by broad risk appetite. It was a narrow, macro-sensitive rotation in which energy strength offset weakness across technology, small caps and rate-sensitive groups. Negative breadth shows that the nearly unchanged S&P 500 understated internal pressure, while the VIX level argues that investors were hedging rather than capitulating. The current pattern could reverse if oil retreats and yields stabilize, but the downside risk would increase if the 10-year yield extends materially above the August 10 level, breadth deteriorates further, earnings estimates are revised lower, inflation surprises to the upside, or VIX breaks decisively out of the mid-teens.
Trading & Investment Strategy:
Risk management should take priority ahead of CPI and PPI. Position sizes can be kept moderate around macro-event risk, with new exposure added in stages rather than all at once. Energy offers strong earnings sensitivity to the oil move, but chasing a sector after a 4.6% one-day gain increases entry risk; investors should distinguish durable free-cash-flow improvement from a purely geopolitical price spike. In growth equities, incremental buying is better supported if Treasury yields stabilize and breadth improves. Across sectors, predefined loss limits, diversified exposures and disciplined entry levels remain preferable to using leverage to force a directional view before the inflation data.
4. Key FAQs About the US Stock Market Today
Why did the US stock market move on August 10, 2026?
U.S. stocks edged lower because a roughly 5% jump in WTI crude revived inflation concerns and pushed Treasury yields higher as hopes for a quick Strait of Hormuz resolution faded. Higher discount rates weighed on technology, REITs and other duration-sensitive assets, while energy rallied sharply. Intel’s 4.1% decline after its $15 billion equity-offering announcement added company-specific pressure to the semiconductor complex.
Which sectors performed best and worst in the US stock market on August 10, 2026?
Energy was the best-performing S&P 500 sector, up 4.6%, while real estate was the worst at -1.2%. The rotation reflected the same macro shock from opposite directions: higher oil prices improved the earnings backdrop for energy companies, while rising Treasury yields reduced the relative appeal and valuation support of rate-sensitive real estate. Utilities and consumer staples also lagged, so the day was not a simple move from cyclicals into defensives.
What should investors watch after the US stock market close on August 10, 2026?
The next major checkpoints are the July CPI release on August 12 and July PPI on August 13, together with the response of the two-year and 10-year Treasury yields. Investors should also monitor whether market breadth improves, whether VIX remains contained in the mid-teens, and whether oil holds above the levels that triggered Monday’s rotation. A renewed rise in yields combined with weaker breadth would be a more consequential risk signal than the modest index declines seen on August 10.
Selected Primary Sources
Disclaimer: This article is intended solely for the exchange of investment ideas and does not constitute investment advice of any kind.