

Key Takeaways
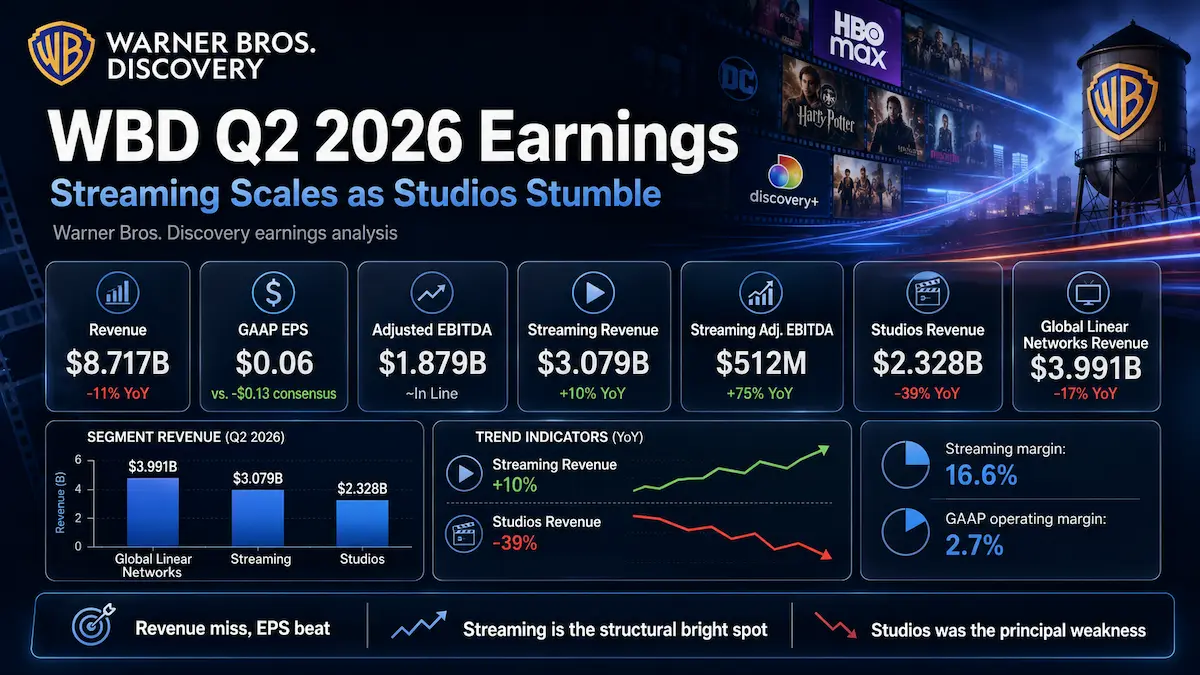
- WBD Q2 2026 revenue was $8.717 billion, down 11% reported and 12% ex-FX, missing the $9.29 billion LSEG consensus by roughly 6.2%. The shortfall was concentrated in Studios and linear advertising, not Streaming.
- GAAP diluted EPS of $0.06 beat the LSEG consensus loss of $0.13, but the quality of that beat was mixed: WBD still posted a $271 million pre-tax loss and recorded a $433 million income-tax benefit.
- Streaming was the structural bright spot: revenue rose 10% to $3.079 billion and Adjusted EBITDA reached $512 million, up 75% reported and 63% ex-FX, for a 16.6% margin calculated from company-reported figures.
- Studios was the principal earnings weakness. Revenue fell 39% to $2.328 billion and Adjusted EBITDA collapsed 89% to $96 million, far below the roughly $300 million pre-earnings estimate cited by Guggenheim.
- At $25.62 at 11:24 a.m. ET on August 7, 2026, Paramount Skydance’s $31.00 base cash merger consideration represented about 21.0% gross upside from the quoted WBD price. That spread makes legal timing and deal completion at least as important to valuation as standalone quarterly earnings.
1. Core Earnings Breakdown
Revenue and Profitability Analysis
Warner Bros. Discovery reported second-quarter 2026 revenue of $8.717 billion versus $9.812 billion a year earlier. That is an 11% decline on a reported basis and a 12% decline on WBD’s ex-FX basis. The distinction matters: currency provided a modest benefit to reported growth, but the underlying operating picture was still materially negative. Distribution revenue increased 1% both reported and ex-FX to $4.950 billion, while advertising declined 22% to $1.724 billion and content revenue declined 26% to $1.828 billion.
GAAP profitability improved at the operating line even as revenue contracted. WBD generated $237 million of GAAP operating income compared with a $185 million operating loss in Q2 2025. That implies a 2.7% GAAP operating margin, calculated as $237 million divided by $8.717 billion of revenue, versus negative 1.9% a year earlier. The company reported approximately $1.9 billion of Adjusted EBITDA, down 6% ex-FX. Using the exact segment, corporate and elimination figures disclosed in the 10-Q, consolidated Adjusted EBITDA calculates to $1.879 billion, or a 21.6% Adjusted EBITDA margin, versus approximately 19.9% a year earlier. This is a non-GAAP profitability measure and should not be confused with GAAP operating margin.
- Streaming: Revenue was $3.079 billion, up 10% reported and ex-FX, while Adjusted EBITDA increased to $512 million from $293 million. On a gross segment-to-consolidated revenue basis, Streaming represented 35.3% of consolidated revenue, calculated from company-reported figures. Investment read-through: Streaming has moved beyond a subscriber-growth story into an operating-leverage story; the key question is increasingly how much incremental revenue can fall through to EBITDA without compromising content quality and global acquisition momentum.
- Studios: Revenue was $2.328 billion, down 39% reported and ex-FX, while Adjusted EBITDA fell 89% to $96 million. On the same gross segment-to-consolidated basis, Studios represented 26.7% of consolidated revenue. Investment read-through: this was not merely an accounting timing issue. The theatrical slate underperformed management’s own expectations, television revenue faced difficult licensing comparisons, and the segment’s 4.1% Adjusted EBITDA margin demonstrates how quickly front-loaded film economics can compress profitability when releases disappoint.
- Global Linear Networks: Revenue was $3.991 billion, down 17% reported and ex-FX, while Adjusted EBITDA declined only 4% reported and 5% ex-FX to $1.446 billion. The segment represented 45.8% of consolidated revenue on a gross segment-to-consolidated basis. Investment read-through: the near-term cash-harvest economics were better than the revenue trend because sports costs fell sharply without the NBA, but a 10% decline in domestic linear subscribers remains a structural erosion signal rather than a cyclical issue.
The gross segment percentages above intentionally exceed 100% because WBD reports material inter-segment activity; consolidated revenue included a net $681 million corporate and inter-segment elimination. That accounting structure is important when judging the economics of internally licensed content: a profit may appear in Studios before being eliminated at the consolidated level and then re-emerge economically over time through Streaming or Networks monetization.
At the consolidated level, the most important product-mix transition is therefore straightforward. Streaming is becoming a larger, higher-margin growth asset; Global Linear Networks remains a substantial cash generator but is shrinking; and Studios is the volatile bridge between intellectual-property creation and monetization across theatrical, television, licensing, games, streaming and consumer products. WBD’s long-term investment case depends less on eliminating that volatility than on making the portfolio resilient enough that one weak theatrical quarter does not overwhelm the rest of the enterprise.
Expectations vs. Actual Results
- ❌ Revenue: $8.717 billion actual versus $9.29 billion LSEG consensus. Miss of approximately $573 million, or 6.2%.
- ✅ GAAP diluted EPS: $0.06 actual versus an expected loss of $0.13 according to LSEG. The headline beat was substantial, but it was not equivalent to a comparable core operating beat.
- ℹ️ GAAP operating margin: 2.7% actual, calculated from $237 million of operating income and $8.717 billion of revenue, versus negative 1.9% a year ago. A reliable publicly disclosed consensus for GAAP operating margin was not available in the sources reviewed, so assigning a fabricated beat or miss would be inappropriate.
- ✅ / In line on adjusted profitability: exact consolidated Adjusted EBITDA calculates to $1.879 billion from company-reported segment, corporate and elimination figures, versus a publicly cited Street consensus of approximately $1.87 billion. That is only about a 0.5% positive variance, effectively in line.
The true source of the revenue miss was the unfavorable mix between strong Streaming growth and much weaker Studios and linear advertising. Studios revenue declined by $1.473 billion year over year, while Global Linear Networks revenue fell by $812 million. Streaming added $286 million. Those are year-over-year movements rather than segment-level consensus variances, but they show where the consolidated revenue pressure came from. More directly against pre-earnings expectations, Guggenheim had modeled roughly $300 million of Studios Adjusted EBITDA; WBD delivered only $96 million.
The EPS beat needs a quality adjustment. WBD produced $237 million of GAAP operating income, but $511 million of net interest expense and other below-the-line items left the company with a $271 million pre-tax loss. A $433 million income-tax benefit then helped produce $162 million of consolidated net income and $149 million of net income available to WBD. In other words, the positive EPS print was real under GAAP, but the magnitude of the surprise over consensus overstates the quarter’s underlying earnings momentum. The cleaner read is that operating profitability improved, consolidated Adjusted EBITDA was roughly in line with Street expectations, and the Studios miss was offset by stronger economics elsewhere.
The linear-network result also requires normalization. The absence of NBA rights reduced Q2 advertising revenue by $414 million, but it reduced costs of revenue by $760 million. That asymmetry explains why Global Linear Networks revenue fell 17% while Adjusted EBITDA declined only 5% ex-FX and its calculated Adjusted EBITDA margin expanded to 36.2% from 31.5%. Investors should not read that margin expansion as evidence that linear demand improved; it is partly the economic consequence of losing an expensive sports package whose revenue and cost profile disappeared together.
For Q3 2026, WBD did not issue a formal numerical revenue, EPS or GAAP operating-margin range. That absence is important: any precise Q3 revenue or EPS figure presented as company guidance would be an estimate, not management guidance. The operational outlook was more specific. Management expects subscriber-related revenue growth to accelerate further during the second half of 2026 and remain healthy into 2027. JB Perrette said Streaming distribution growth would have been in the low teens excluding the prior related-party distribution renewal and described that trajectory as solid for the remainder of the year. Global Linear Networks operating expenses are expected to improve by a high-single-digit percentage for full-year 2026. WBD also warned that Streaming margins can fluctuate, particularly around front-loaded marketing for Harry Potter in Q4, while maintaining a long-term 20%+ Streaming Adjusted EBITDA margin target.
The market reaction was more constructive than the revenue miss alone would suggest. WBD rose 1.66% on August 6 to close at $26.40 even as the broader market fell. However, that move was not a clean earnings signal: the U.K. Competition and Markets Authority also cleared Paramount Skydance’s acquisition of WBD on the same day. By 11:24 a.m. ET on August 7, WBD was quoted at $25.62, down 0.56% on the session. The correct interpretation is not a generic “sell the news” narrative. The stock is trading as a merger-arbitrage security whose daily price reflects earnings, legal developments, regulatory milestones, timing risk and the probability of receiving the merger consideration.
Earnings Call Highlights
Streaming has crossed the threshold from turnaround to scalable profit engine: quarterly revenue exceeded $3 billion for the first time and Adjusted EBITDA reached $512 million.
💡 Reading Between the Lines: Management is shifting the investor debate away from whether HBO Max can become profitable and toward the durability of margin expansion. The next valuation test is whether double-digit subscriber-related revenue growth can coexist with sustained content investment and a path from a 16.6% Q2 margin toward the 20%+ long-term target.
“The quarter, obviously, in the film business, wasn’t what we expected.”
💡 Reading Between the Lines: CFO Gunnar Wiedenfels did not try to reframe the weak film slate as purely timing. Reaffirming the medium-to-long-term $3 billion-plus Studios Adjusted EBITDA target therefore raises the execution bar for the 2027 slate, television production, licensing, games, consumer products and experiences to offset theatrical volatility.
Management sees the Warner Bros. library as a replenishing, high-margin licensing asset, with healthy demand even for older television shows.
💡 Reading Between the Lines: The library is an underappreciated stabilizer because WBD can monetize the same intellectual property across third parties and internal platforms. Internal licensing can depress immediate segment visibility through eliminations, but it can improve consolidated economics later if the content reduces churn or raises engagement inside HBO Max.
Streaming distribution growth would have been in the low teens excluding the prior related-party renewal, and management expects the trajectory to remain solid through the rest of 2026.
💡 Reading Between the Lines: This matters more than raw subscriber additions because it points to improving monetization, not only footprint expansion. If pricing, wholesale distribution and ad-supported monetization all contribute, Streaming revenue quality should become less dependent on promotional subscriber growth.
Management remains highly confident in the Paramount transaction, but the closing is on hold pending legal proceedings or June 1, 2027.
💡 Reading Between the Lines: Capital allocation is now constrained by an event-driven end state. Investors should value WBD through both a deal-completion lens and a standalone downside lens; operating progress matters because it supports the latter if legal or timing risk prevents the merger from closing as expected.
2. Deep Business Insights
Hidden Metrics That Matter
Metric 1 — the ad-supported mix is becoming a monetization flywheel, not just a cheaper subscription tier. More than half of HBO Max retail gross additions in Q2 came through the ad-supported tier, and approximately 40% of global HBO Max subscribers were on that tier at quarter-end, up 11% year over year. Streaming advertising revenue increased 8% ex-FX despite a 16% ex-FX year-over-year headwind from the absence of the NBA, while international Streaming advertising revenue rose 73% ex-FX following launches in Germany, Italy, the U.K. and Ireland.
The hidden implication is yield expansion. WBD explicitly said international ad fill rates remain lower, which means subscriber growth has arrived before full monetization. For advertisers, WBD offers premium scripted entertainment, live sports and news across a growing global digital footprint; for distribution partners, HBO and Warner Bros. franchises can support acquisition and retention; and for brands, WBD is increasingly pairing that inventory with cross-platform measurement and an agentic advertising stack built on AWS. The differentiation is not simply scale. It is the ability to connect premium intellectual property, a broad content library and linear-plus-streaming inventory through multiple monetization windows.
Metric 2 — the Global Linear Networks margin expansion is largely a sports-rights reset. Q2 Adjusted EBITDA margin was 36.2% = $1.446 billion / $3.991 billion, versus 31.5% = $1.512 billion / $4.803 billion a year earlier, calculated from company-reported figures. Yet the NBA absence reduced advertising revenue by $414 million while reducing costs of revenue by $760 million. The gross $346 million difference between those two disclosed effects, calculated from company-reported figures, shows why profit held up much better than revenue. This is economically helpful for near-term cash generation, but it should not be capitalized as evidence of healthier linear demand because domestic linear subscribers still fell 10%.
A second cash-flow lens reinforces that distinction between reported earnings and economic value. Q2 free cash flow was $572 million after approximately $350 million of merger and separation-related cash items. Those transaction-related items equal roughly 61% of reported free cash flow, calculated as $350 million / $572 million from company-reported figures. Separately, management expects roughly 150 basis points of annual interest-cost savings after refinancing the remaining $15 billion bridge facility; a simple 1.50% × $15 billion approximation equals about $225 million of potential annual pre-tax interest savings, calculated from company-reported figures. The actual realized benefit will depend on benchmark rates, currency and loan balances, but the refinancing meaningfully improves the cash-cost profile while the deal remains delayed.
Industry Chain Reactions
- ✅ Benefit — Amazon (AMZN): WBD announced in June that its next-generation advertising technology is being built on AWS, its preferred cloud provider. Q2’s growth in ad-supported HBO Max subscribers and WBD’s stated opportunity to improve international fill rates increase the strategic relevance of the cloud, data and automation infrastructure behind that monetization push. The direct financial read-through is likely small relative to Amazon’s scale, but directionally it supports AWS workload and advertising-technology usage.
- ❌ Face Pressure — Netflix (NFLX): WBD’s Streaming segment is now profitable at scale, with improving distribution growth, a rising ad-supported mix and a deep premium-content pipeline. If the Paramount transaction closes, the combined HBO Max and Paramount+ footprint would add further scale against Netflix for viewing time, subscriber budgets and connected-TV advertising. The pressure is not one-way, however: WBD also describes healthy third-party demand for its library, so Netflix can simultaneously be a licensing customer. The competitive threat is therefore strongest in consumer attention and ad inventory, not necessarily in content-supply relationships.
Valuation Framework and Key Risks
WBD is no longer best analyzed as a conventional standalone media multiple. At $25.62 at 11:24 a.m. ET on August 7, 2026, the stock traded $5.38 below Paramount Skydance’s $31.00 base cash consideration. The gross spread is approximately 21.0%, calculated as ($31.00 – $25.62) / $25.62. The merger agreement also provides ticking consideration after September 30, 2026 at $0.00277778 per calendar day, capped at $0.25 per 90-day period. That additional payment is contingent on the merger actually closing and should not be treated as guaranteed return.
The size of the spread is the market’s price for legal, timing and break risk. WBD says the closing is on hold until the earlier of five days after the relevant legal proceedings are complete or June 1, 2027. Reuters reported that California and 11 other states are seeking to block the transaction and that a federal trial is scheduled for March 2027. The U.K. clearance on August 6 reduced one regulatory uncertainty, but it did not resolve the U.S. litigation. Consequently, investors should resist annualizing the 21% gross spread as if it were a fixed-income yield.
The standalone downside case is anchored by three operating facts. First, domestic linear subscribers declined 10%, and WBD itself expects linear subscriber declines to continue. Second, Studios generated only $96 million of Q2 Adjusted EBITDA, showing that even an improved franchise strategy cannot eliminate slate volatility. Third, WBD ended Q2 with approximately $29.7 billion of net debt and 3.4x net leverage, based on $33.1 billion of gross debt, $3.4 billion of cash and restricted cash, and $8.8 billion of last-twelve-month Adjusted EBITDA.
The upside case is equally specific. Streaming is now producing more than $500 million of quarterly Adjusted EBITDA with a nearly 17% margin, management sees subscriber-related revenue growth accelerating in the second half, and the ad-supported mix leaves room for international yield improvement. The balance-sheet refinancing reduces financing drag, while the library and television businesses provide monetization channels that are less binary than theatrical box office. If those operating improvements continue, they raise the fundamental value of WBD in a deal-break scenario and make the merger consideration easier to underwrite economically.
The most relevant valuation framework is therefore a two-layer model: merger value on top, standalone fundamentals underneath. The signed $31 cash price creates the visible ceiling reference before ticking consideration, while the discount to that price reflects probability and time. Underneath that spread, Streaming margin durability, Studios normalization, linear cash conversion and leverage determine how painful a failed or substantially delayed transaction could be. For current shareholders, the merger litigation path is the dominant near-term catalyst; for fundamental investors, Q2 2026 shows that the quality of the standalone asset mix is improving, but not uniformly.
3. Key FAQs
Did WBD beat Q2 2026 earnings expectations?
WBD beat the LSEG GAAP EPS expectation but missed revenue. GAAP diluted EPS was $0.06 versus an expected loss of $0.13, while revenue of $8.717 billion was below the $9.29 billion consensus. The EPS beat should be interpreted cautiously because WBD recorded a $271 million pre-tax loss and a $433 million income-tax benefit. Consolidated Adjusted EBITDA was approximately $1.879 billion based on the disclosed reconciliation, essentially in line with the roughly $1.87 billion Street consensus cited before earnings.
Why did WBD revenue fall in Q2 2026 despite HBO Max growth?
Streaming revenue rose 10% to $3.079 billion, but that increase was overwhelmed by a 39% decline in Studios revenue and a 17% decline in Global Linear Networks revenue. Consolidated advertising fell 22%, with the absence of the NBA creating a major year-over-year headwind, while content revenue fell 26% primarily because of lower theatrical revenue. The quarter therefore illustrates WBD’s portfolio transition: the growth engine is improving faster than the legacy and hit-driven businesses are stabilizing.
What does the Paramount merger mean for WBD stock after Q2 2026 earnings?
The merger makes WBD an event-driven stock as much as an earnings stock. Paramount Skydance agreed to pay $31.00 per WBD share in cash, plus applicable ticking consideration if closing occurs after September 30, 2026. At $25.62 on August 7, the base-price spread was about 21%. The discount reflects uncertainty because the transaction remains delayed by U.S. legal proceedings. Q2 fundamentals still matter: stronger Streaming economics and lower financing costs can support the standalone value if the deal is delayed or fails, while linear erosion, Studios volatility and leverage remain the principal downside risks.
Source verification note: WBD’s Investor Relations site publishes the official Q2 2026 webcast and earnings materials. At the time of verification, it did not expose a company-hosted text transcript; management remarks were cross-checked against the official materials and a Quartr-powered transcript.
Primary company sources: Warner Bros. Discovery Q2 2026 earnings release, Q2 2026 shareholder letter, Q2 2026 Form 10-Q, and WBD’s official Q2 2026 earnings-call webcast page. Additional verification used the Quartr-powered earnings-call transcript, the SEC-filed Paramount merger terms, and WBD’s official AWS advertising-technology announcement. For ongoing filings and earnings materials, see Warner Bros. Discovery Investor Relations.
Disclaimer: This article/chart is for educational and informational purposes only and does not constitute investment advice of any kind. Past performance is not indicative of future results. Investors should independently evaluate their own risks.