Key Takeaways
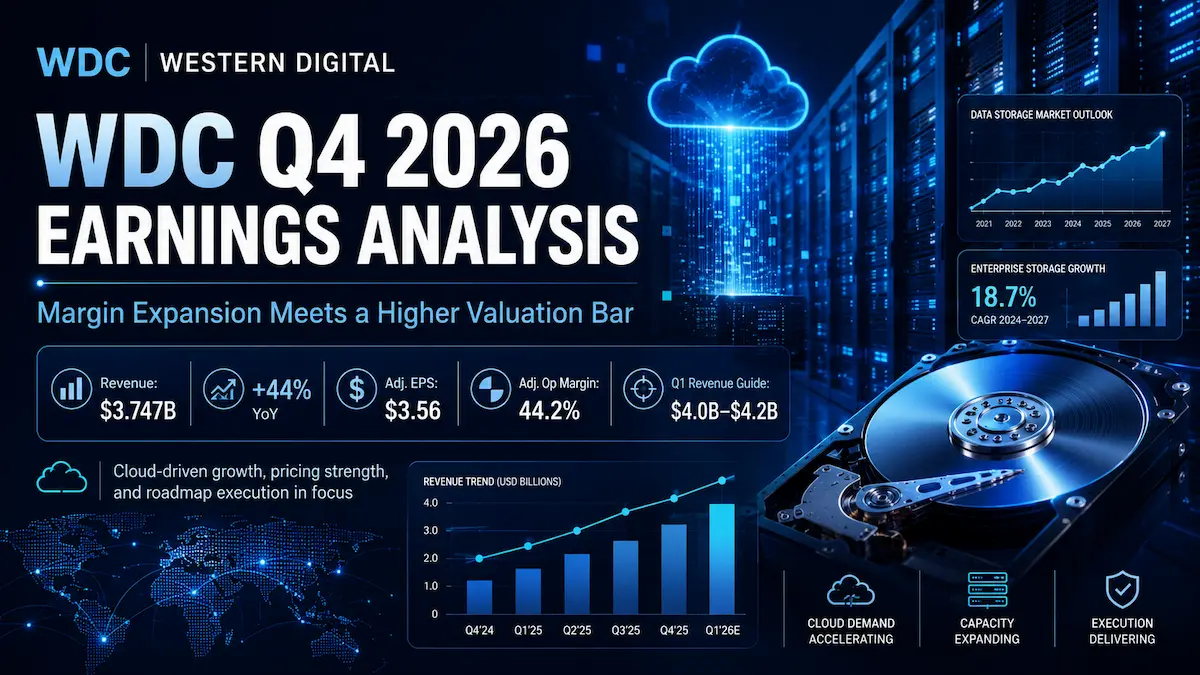
- Western Digital reported Q4 FY2026 revenue of $3.747 billion, up 44% year over year and 12% sequentially, beating the LSEG consensus by approximately 1.5%.
- Adjusted diluted EPS reached $3.56 versus the $3.30 consensus, while adjusted operating margin expanded to 44.2%; the earnings beat was driven more by pricing, mix and cost discipline than by an upside volume surprise.
- GAAP diluted EPS of $8.21 materially overstated recurring earnings power because it included a $2.050 billion gain on Western Digital’s retained interest in Sandisk.
- Q1 FY2027 guidance was above consensus at the midpoint, but Q4 exabyte shipment growth of 22% lagged the company’s medium-term demand framework of 25% or more, raising the execution bar for the 40TB ePMR and 44TB HAMR ramps.
- At an intraday price of $470.87 on August 6, 2026, WDC traded at about 46.1 times FY2026 adjusted EPS and 29.4 times the annualized midpoint of Q1 adjusted EPS guidance, leaving limited room for volume, pricing or roadmap slippage.
1. Core Earnings Breakdown
Revenue and Profitability Analysis
Western Digital’s fiscal fourth quarter ended July 3, 2026, with revenue of $3.747 billion. Reported revenue increased 44% from $2.605 billion a year earlier and 12% from the prior quarter. The company did not provide a separate constant-currency or “operational growth” bridge, so the 44% figure should be understood strictly as reported growth. The more useful operating decomposition is volume plus price and product mix: exabyte shipments increased 22% year over year, while a calculated revenue-per-exabyte proxy rose 18.3%, indicating that pricing and mix were at least as important as shipment growth.
- Cloud revenue was approximately $3.335 billion, or 89% of total revenue, and increased 43% year over year. The investment implication is that WDC is now overwhelmingly a data-center storage company: hyperscale capital spending, nearline qualification cycles and long-term supply agreements matter far more to the earnings model than PC replacement demand.
- Client revenue was $225 million, or 6% of revenue, and increased 61% year over year. The growth rate is strong, but the segment is too small to diversify the model meaningfully; its primary value is incremental factory loading and channel breadth rather than strategic control of the earnings cycle.
- Consumer revenue was $187 million, or 5% of revenue, and increased 38% year over year. This business remains useful for brand monetization and inventory flexibility, but it is not large enough to offset a material slowdown in cloud procurement.
Profitability was the central positive. GAAP gross margin was 54.1%, while adjusted gross margin was 54.4%, a narrow 30-basis-point gap that indicates the gross-profit improvement was substantially operational. GAAP operating income was $1.563 billion, equivalent to a 41.7% operating margin. Adjusted operating income was $1.655 billion, or 44.2% of revenue. The 250-basis-point difference between GAAP and adjusted operating margin was meaningful but not large enough to undermine the core margin story.
The quality of GAAP net income was very different. GAAP diluted EPS was $8.21, compared with adjusted diluted EPS of $3.56. The principal reason was a $2.050 billion gain on Western Digital’s retained interest in Sandisk, partly offset by $362 million of costs related to debt and equity transactions. Consequently, GAAP EPS should not be annualized or used as the primary valuation denominator. The balance-sheet value created by the Sandisk separation is real, but the accounting gain is non-recurring and does not represent HDD operating earnings.
Cash conversion was also strong. Operating cash flow was $1.389 billion, capital expenditures were $108 million and free cash flow was $1.281 billion. That equates to a 34.2% free-cash-flow margin and 77.4% conversion of adjusted operating income into free cash flow, both calculated from company-reported figures. The low 2.9% capex-to-revenue ratio reflects a business model in which technology transitions and manufacturing productivity can generate substantial cash without semiconductor-like capital intensity.
Expectations vs. Actual Results
Metric | Actual or Guidance | Expectation or Reference Point | Result |
|---|---|---|---|
Q4 FY2026 revenue | $3.747 billion | $3.690 billion LSEG consensus | ✅ Beat by $57 million, or 1.5% |
Q4 FY2026 adjusted diluted EPS | $3.56 | $3.30 LSEG consensus | ✅ Beat by $0.26, or 7.9% |
Q4 FY2026 adjusted operating margin | 44.2% | 40.8% implied by the midpoint of prior company guidance | ✅ Approximately 340 basis points above |
Q1 FY2027 revenue guidance | $4.0 billion to $4.2 billion | $4.04 billion LSEG consensus | ✅ Midpoint is 1.5% above consensus |
Q1 FY2027 adjusted EPS guidance | $3.85 to $4.15 | $3.81 LSEG consensus | ✅ Midpoint is 5.0% above consensus |
Q1 FY2027 adjusted gross margin guidance | 55.0% to 56.0% | No comparable LSEG margin consensus disclosed in the cited report | ✅ Further sequential expansion at the midpoint |
The operating-margin comparison above is not a Street consensus figure. It is calculated from Western Digital’s prior Q4 guidance midpoint: ($3.65 billion revenue × 51.5% gross margin − $390 million operating expenses) ÷ $3.65 billion revenue = 40.8%. Actual adjusted operating margin of 44.2% therefore exceeded that implied framework by roughly 340 basis points. This is calculated from company-reported guidance and results.
The beat came from a favorable combination of price per terabyte, higher-value nearline products and cost reductions rather than an exceptional shipment surprise. Management said blended price per terabyte increased in the high teens year over year, while cost per terabyte declined approximately 8%. Exabyte shipments rose 22%, solid in absolute terms but below the 25%-plus medium-term demand framework emphasized by management and below the pace investors had recently become accustomed to.
The market therefore focused less on whether WDC technically beat quarterly consensus and more on whether the result justified a premium multiple. Revenue exceeded consensus by only 1.5%, whereas EPS beat by 7.9%. That asymmetry signals a margin-led beat. Margin-led upside is valuable, but it becomes harder to extrapolate when price per terabyte is already rising at a high-teens rate and competitors are setting a demanding profitability benchmark.
The Q1 outlook was constructive. At the midpoint, revenue of $4.1 billion and adjusted EPS of $4.00 were above consensus. The midpoint also implies an adjusted operating margin of approximately 45.9%, calculated as ($4.1 billion × 55.5% gross margin − $395 million operating expenses) ÷ $4.1 billion. Still, the guide did not create enough upside relative to elevated expectations, particularly when investors compared WDC’s 55%-56% gross-margin outlook with Seagate’s stronger near-term margin profile.
WDC shares fell sharply despite the headline beat. The stock traded at $470.87 at 11:19 a.m. Eastern Time on August 6, down approximately 9.3% from the prior close, after a steeper post-market decline immediately following the report. The disconnect was not caused by acquisition dilution: Western Digital did not announce a dilutive transaction. It was also more specific than a generic “sell the news” explanation. The market repriced three issues: Q4 exabyte growth did not match the most optimistic demand assumptions, the gross-margin guide did not widen WDC’s relative advantage over Seagate, and the stock entered the print at a valuation that required both strong numbers and upward revisions to the longer-term earnings path.
Earnings Call Highlights
- Management maintained a medium-term exabyte demand growth framework of at least 25%, while acknowledging that quarterly shipments can be affected by customer qualification and deployment timing. 💡 Reading Between the Lines: The long-term demand signal remains strong, but the 22% Q4 shipment increase shows that quarterly revenue cannot be modeled as a smooth 25%-plus volume curve. A premium valuation requires investors to distinguish durable AI-related storage demand from timing-driven shipment volatility.
- The 40TB ePMR platform entered volume production with two customers, UltraSMR was ramping with a third major customer, and the platform is expected to exceed half of nearline exabyte shipments by Q3 FY2027. 💡 Reading Between the Lines: The next two to three quarters are an execution test rather than a concept-validation phase. Successful qualification and yield progression can support price per terabyte and gross margin; delays would reduce the credibility of the current earnings run-rate.
- Western Digital said its 44TB HAMR product remains on track for the first half of calendar 2027, with a 50TB product planned for the second half of calendar 2027. 💡 Reading Between the Lines: WDC is using ePMR and UltraSMR to bridge the capacity roadmap while HAMR matures. This lowers immediate transition risk, but it also means investors must monitor whether customers view the bridge as competitive enough against Seagate’s earlier HAMR deployment.
- Management is discussing long-term agreements extending into 2029-2031 and described strong visibility into future volume requirements, while commercial pricing structures remain under negotiation. 💡 Reading Between the Lines: Longer agreements can reduce cyclicality and improve capacity planning, but volume visibility is not equivalent to margin protection. The valuation benefit depends on whether contract pricing preserves returns during future changes in supply-demand balance.
- High-bandwidth HDD samples have been provided to five customers, targeting up to eight times current throughput without a corresponding increase in power consumption. 💡 Reading Between the Lines: WDC is attempting to expand the value proposition from low-cost capacity into power-efficient data access. If adopted, this could increase content value per drive and defend HDD economics in AI storage architectures; if adoption remains niche, it should not be assigned material value in the base-case model.
- The capital-return framework remains centered on dividends and share repurchases, after approximately $3.1 billion was returned to shareholders during FY2026. 💡 Reading Between the Lines: Western Digital has the cash generation and balance sheet to return capital, but buyback value creation becomes more sensitive at a high earnings multiple. Repurchases are most accretive when supported by durable free cash flow rather than temporary price-per-terabyte strength.
2. Deep Business Insights
Hidden Metrics That Matter
The first underappreciated metric is a blended revenue-per-exabyte proxy. Q4 FY2026 revenue of $3.747 billion divided by 231 exabytes shipped equals approximately $16.22 million of revenue per exabyte. A year earlier, $2.605 billion divided by 190 exabytes equaled approximately $13.71 million per exabyte. The increase was 18.3%, calculated from company-reported figures.
This is not a company-disclosed average selling price and should not be treated as a pure price measure because revenue includes differences in end-market and product mix. It is nevertheless a useful economic proxy. The arithmetic explains almost the entire reported revenue increase: 1.22 times shipment growth multiplied by 1.183 times revenue per exabyte equals approximately 1.443, or 44.3% growth. In other words, Q4 revenue growth was nearly evenly dependent on volume and price/mix. That matters because high-teens price/mix improvement is unlikely to compound indefinitely without either sustained supply discipline or continued migration toward higher-value capacity products.
The second hidden metric is the combination of free-cash-flow conversion and capital intensity. Free cash flow of $1.281 billion divided by revenue of $3.747 billion equals a 34.2% margin. Free cash flow divided by adjusted operating income of $1.655 billion equals 77.4% conversion. Capital expenditures of $108 million divided by revenue equal only 2.9%. Each figure is calculated from company-reported results.
This combination explains why customers and shareholders may both prefer a scaled HDD supplier. Customers need multi-year roadmaps, high-volume qualification support, predictable reliability and the ability to deliver capacity at favorable total cost of ownership. WDC’s differentiation is not simply drive capacity. It is the ability to combine areal-density improvements, firmware, UltraSMR, power efficiency, qualification resources and long-term supply planning at hyperscale volumes. For shareholders, the same platform can produce strong cash generation because incremental revenue does not require proportionate capital spending.
One additional capital-allocation ratio deserves attention. Western Digital returned approximately $3.1 billion to shareholders in FY2026 against $3.511 billion of free cash flow, equivalent to 88.3%, calculated from company-reported figures. That is a high payout ratio. It is sustainable only if working-capital benefits and favorable pricing do not reverse sharply, and it raises the importance of repurchase discipline when the stock trades at a premium multiple.
Industry Chain Reactions
- ✅ Benefit — Marvell Technology (NASDAQ: MRVL): Marvell supplies HDD controllers and related silicon used in high-capacity nearline and enterprise storage. WDC’s shift toward 40TB products, higher-bandwidth architectures and rising cloud exabytes can increase the value of controller, preamplifier and signal-processing content. The caveat is that exabyte growth does not translate one-for-one into drive-unit growth because capacity per drive is rising.
- ❌ Face Pressure — Seagate Technology (NASDAQ: STX): WDC’s 40TB ePMR ramp, planned 44TB HAMR launch and negotiations for agreements extending beyond 2029 can pressure Seagate’s share and pricing if WDC executes on schedule. The near-term read-through is mixed, however: Seagate currently benefits from an earlier HAMR position and a stronger relative margin benchmark, so WDC’s roadmap is a medium-term competitive threat rather than evidence that Seagate is losing momentum today.
Valuation Framework and Key Risks
At an intraday share price of $470.87 on August 6, 2026, WDC’s market capitalization was approximately $162.5 billion. The stock traded at 46.1 times FY2026 adjusted EPS of $10.22. Using the Q1 FY2027 adjusted EPS midpoint of $4.00 as a simple quarterly run-rate produces $16.00 of annualized EPS and a 29.4-times multiple. This annualization is a sensitivity tool, not a forecast, because quarterly pricing, mix, seasonality and shipment timing can change.
On cash flow, FY2026 free cash flow of $3.511 billion implies a 2.2% free-cash-flow yield on the cited market capitalization. With $1.579 billion of cash, $1.052 billion of current debt and no reported long-term debt at quarter-end, estimated enterprise value was approximately $161.9 billion, or roughly 46.1 times FY2026 free cash flow. These figures show that the market is already capitalizing substantial future earnings growth rather than valuing WDC as a conventional cyclical hardware company.
A useful valuation sensitivity starts with the $16.00 annualized Q1 EPS midpoint. At 25 times that run-rate, the implied value is $400 per share; at 30 times, $480; and at 35 times, $560. These are not price targets. They illustrate the expectations embedded in the current price. Around $470.87, the market is effectively requiring WDC to sustain an earnings profile close to the Q1 guide while preserving a high-growth multiple.
That valuation can be defended if four conditions hold simultaneously: medium-term exabyte growth remains at or above 25%; high-teens price and mix gains do not reverse abruptly; adjusted gross margin remains in the mid-50% range or improves; and the 40TB ePMR-to-HAMR transition occurs without qualification, yield or reliability setbacks. The stock’s post-earnings decline shows that investors are no longer rewarding a simple beat. They require evidence that current margins are durable through the next technology transition.
- Pricing normalization risk: Q4 revenue growth relied materially on an 18.3% increase in the revenue-per-exabyte proxy. A return to flat or declining price per terabyte would place more weight on volume growth and cost reductions.
- Volume and customer-timing risk: Cloud represented 89% of revenue. Large qualification or deployment shifts at a small number of hyperscale customers can create material quarterly volatility even when long-term demand remains intact.
- Technology execution risk: The 40TB ePMR ramp, UltraSMR adoption, 44TB HAMR schedule and later 50TB roadmap must meet customer reliability and yield requirements. A delay would affect both share and the margin narrative.
- Competitive risk: Seagate’s HAMR lead and relative gross-margin performance can constrain WDC’s valuation multiple unless WDC demonstrates comparable capacity, cost and qualification outcomes.
- Long-term agreement risk: Multi-year volume visibility is valuable, but contract terms could cap upside or create unfavorable pricing obligations if industry economics change.
- Capital-allocation risk: Repurchasing shares at elevated multiples can destroy value if current earnings reflect peak pricing. The 88.3% FY2026 free-cash-flow payout ratio leaves less room for execution errors.
3. Key FAQs
Did Western Digital beat WDC Q4 2026 earnings expectations?
Yes. Western Digital reported Q4 FY2026 revenue of $3.747 billion versus the $3.690 billion LSEG consensus, a 1.5% beat. Adjusted diluted EPS was $3.56 versus $3.30 expected, a 7.9% beat. The larger EPS beat relative to revenue indicates that pricing, mix, gross margin and operating discipline were the primary sources of upside.
Why did WDC stock fall after its Q4 2026 earnings beat?
The stock fell because the result did not exceed an already elevated valuation bar. Q4 exabyte shipments increased 22%, below management’s 25%-plus medium-term framework, while the revenue beat was modest and the EPS beat was margin-led. Investors also compared WDC’s Q1 gross-margin outlook with Seagate’s strong profitability and demanded greater evidence that WDC’s pricing, product mix and technology roadmap can sustain the current earnings run-rate.
What is Western Digital’s Q1 FY2027 guidance and what does it imply for valuation?
Western Digital guided to revenue of $4.0 billion to $4.2 billion, adjusted gross margin of 55%-56% and adjusted diluted EPS of $3.85-$4.15. At the midpoint, revenue and EPS were approximately 1.5% and 5.0% above the cited LSEG consensus, respectively. At $470.87 per share, annualizing the $4.00 EPS midpoint produces a 29.4-times run-rate multiple, which implies that investors expect strong execution rather than a normal cyclical fade.
Primary sources: Western Digital’s official Q4 FY2026 financial results, the official Q4 FY2026 earnings presentation, and the official earnings-call webcast page. Consensus estimates and the immediate market reaction were cross-checked against Reuters’ LSEG-based report. Western Digital’s Investor Relations site had not published a standalone written transcript as of August 6, 2026; call remarks were checked against the archived webcast and an accessible third-party transcript.
Disclaimer: This article/chart is for educational and informational purposes only and does not constitute investment advice of any kind. Past performance is not indicative of future results. Investors should independently evaluate their own risks.