Key Takeaways
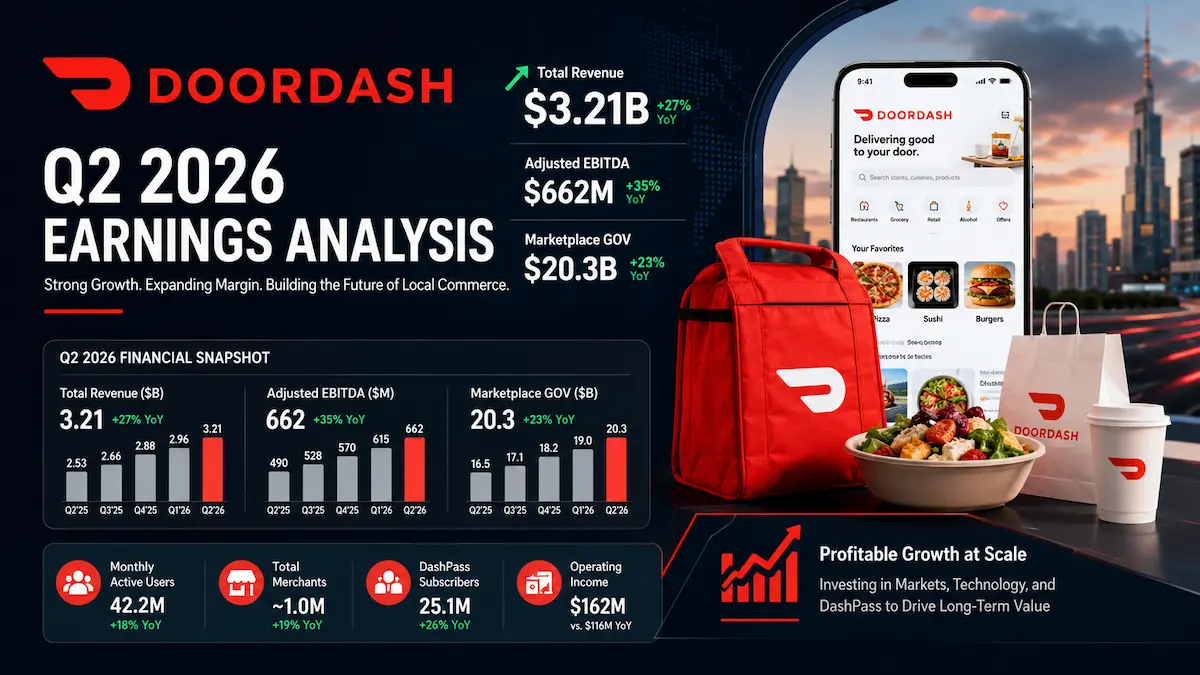
- DoorDash reported Q2 2026 revenue of $4.454 billion, up 35.6% year over year and 2.6% above the $4.34 billion consensus, while GAAP diluted EPS of $0.46 missed the $0.47 FactSet estimate by one cent.
- Reported growth benefited materially from Deliveroo. Revenue excluding Deliveroo was $4.071 billion, up approximately 24.0%, versus reported growth of 35.6%.
- Adjusted EBITDA of $914 million beat the LSEG consensus of $841.8 million by 8.6%, but GAAP operating margin fell to 3.5% from 5.0% a year earlier as depreciation and amortization, R&D, G&A and legal or regulatory costs increased.
- DashPass remains the central demand flywheel: U.S. paid membership additions over the last 12 months exceeded the prior 24 months combined, and members generated about 75% of U.S. grocery and retail orders.
- At an intraday price of $209.04 on August 6, 2026, DASH traded at roughly 27.6 times trailing adjusted EBITDA and 42.9 times trailing free cash flow, leaving limited tolerance for slower organic growth or delayed margin expansion.
1. Core Earnings Breakdown
Revenue and Profitability Analysis
DoorDash delivered a strong headline quarter, but the investment signal is more nuanced than the 36% reported revenue growth rate suggests. Q2 revenue was $4.454 billion, up 35.6% from $3.284 billion a year earlier. Marketplace gross order value, or Marketplace GOV, rose 36.4% to $33.078 billion, and Total Orders increased 27.5% to 970 million.
The operational growth rate was lower because Deliveroo was not included in the prior-year comparison. DoorDash disclosed Q2 revenue excluding Deliveroo of $4.071 billion, implying approximately 24.0% year-over-year growth. Total Orders excluding Deliveroo grew 17%, Marketplace GOV excluding Deliveroo grew 23%, and revenue excluding Deliveroo grew 24%. The correct interpretation is therefore not that the underlying platform suddenly accelerated to the mid-30% range, but that a still-strong low-to-mid-20% organic business was supplemented by acquisition revenue.
DoorDash does not report separate revenue for U.S. restaurants, grocery and retail, international markets or merchant software. Any percentage allocation among those categories would therefore be fabricated. The most decision-useful approach is to analyze the operating disclosures for each product pillar:
- U.S. restaurants: Marketplace GOV growth accelerated slightly from Q1, supported by strong DashPass membership. This matters because the core restaurant marketplace is not merely funding expansion elsewhere; it is still compounding at a rate high enough to absorb investment in grocery, international markets and autonomy.
- U.S. grocery and retail: DoorDash described these categories as its fastest-growing marketplace business, with materially improving unit economics and a path to gross-profit positivity by the end of 2026. The strategic significance is larger than the near-term revenue contribution because grocery expands order frequency, basket size and the utility of DashPass.
- International markets: Growth excluding Deliveroo was consistent with Q1 while unit economics improved. Deliveroo accelerated MAU, order and subscription growth and exceeded internal profit expectations. The investment case depends on converting this broader geographic footprint into repeatable local scale without assuming global network effects that management itself says do not exist.
- Merchant services and software: Management said the business serves more than 150,000 companies and grew 40% year over year. Reservations booked through DoorDash marketplaces increased more than 150% quarter over quarter. This is strategically important because software, advertising, loyalty, reservations and first-party ordering can deepen merchant relationships beyond delivery commissions.
Profitability improved sharply on DoorDash’s adjusted framework. GAAP gross profit rose 38.2% to $2.223 billion, and GAAP gross margin expanded to 49.9% from 49.0% a year earlier. Contribution Profit increased 43.1% to $1.641 billion, while Contribution Profit as a percentage of Marketplace GOV rose to 5.0% from 4.7%. Adjusted EBITDA increased 39.5% to $914 million, and adjusted EBITDA as a percentage of Marketplace GOV reached 2.8%, versus 2.7% a year earlier and 2.4% in Q1.
The GAAP picture was less favorable. Operating income was $156 million, down from $163 million, producing a 3.5% operating margin versus 5.0% a year earlier. GAAP net income attributable to common stockholders fell 30% to $200 million, and diluted EPS declined to $0.46 from $0.65. The principal pressure points were depreciation and amortization of $295 million, up 86%; R&D expense of $535 million, up 52%; G&A expense of $538 million, up 39%; and sales and marketing expense of $821 million, up 35%. Stock-based compensation and related payroll taxes included in the adjusted EBITDA reconciliation increased to $349 million from $282 million, while legal, tax and regulatory items rose to $98 million from $29 million.
This is the central earnings-quality issue. Adjusted EBITDA showed genuine improvement in unit economics, advertising and Deliveroo contribution, but the gap between adjusted and GAAP profitability widened because amortization, stock compensation and legal or regulatory costs remain economically relevant to shareholders. Investors should therefore track both the 2.8% adjusted EBITDA-to-GOV margin and the 3.5% GAAP operating margin rather than relying on either measure alone.
Cash generation was strong. Q2 operating cash flow was $944 million and free cash flow was $742 million, up from $504 million and $355 million, respectively. Trailing-12-month free cash flow reached $2.139 billion. The quarter converted 81.2% of adjusted EBITDA into free cash flow, although working-capital timing can make any single quarter unusually strong or weak.
Expectations vs. Actual Results
Metric | Q2 2026 Actual | Consensus or Benchmark | Surprise | Result |
|---|---|---|---|---|
Revenue | $4.454 billion | $4.34 billion | +$114 million, or +2.6% | ✅ Beat |
GAAP diluted EPS | $0.46 | $0.47 FactSet estimate | -$0.01 | ❌ Slight miss |
Marketplace GOV | $33.078 billion | $32.08 billion LSEG estimate | +$998 million, or +3.1% | ✅ Beat |
Adjusted EBITDA | $914 million | $841.8 million LSEG estimate | +$72.2 million, or +8.6% | ✅ Beat |
Adjusted EBITDA / Marketplace GOV | 2.76% | 2.62% implied consensus | +14 basis points | ✅ Better than expected |
GAAP operating margin | 3.50% | No verified public consensus; 5.0% in Q2 2025 | -150 basis points year over year | ⚠️ GAAP margin contracted |
Q3 2026 Marketplace GOV guidance | $33.0-$34.0 billion | $32.64 billion LSEG estimate | Midpoint 2.6% above consensus | ✅ Midpoint beat |
Q3 2026 adjusted EBITDA guidance | $950 million-$1.10 billion | $979.6 million LSEG estimate | Midpoint 4.6% above consensus; low end 3.0% below | ✅ Favorable midpoint, wide range |
The main beat did not come from a one-cent EPS surprise. It came from Marketplace GOV, revenue and adjusted EBITDA. Management attributed the profitability upside primarily to better-than-expected unit economics in advertising and order subtotal monetization, as well as Deliveroo volumes and contribution profit that exceeded internal assumptions. This is higher-quality than a beat driven solely by lower discretionary spending, but it is not fully structural because management said some upside arrived late in the quarter and therefore could not be reinvested at its required return threshold.
Consensus data providers differed on Marketplace GOV: Reuters cited an LSEG estimate of $32.08 billion, while FactSet-linked coverage referenced approximately $32.9 billion. DoorDash exceeded both. The investment conclusion is unchanged, but the size of the surprise depends on the consensus feed.
The market was more likely to focus on adjusted EBITDA, organic growth and guidance than on the one-cent GAAP EPS miss. Revenue growth excluding Deliveroo remained 24%, grocery and retail unit economics improved, Deliveroo became contribution-profit positive, and Q3 guidance was above consensus at the midpoint. Against those positives, management warned that adjusted EBITDA as a percentage of Marketplace GOV should decline sequentially in Q4 because of seasonal Dasher costs, higher insurance expense and increased spending on the global technology platform and autonomous delivery.
DASH closed at $207.27 before the earnings release and traded near $209.23 after hours. On August 6, it opened at $214.67 and reached an intraday high of $220.00, but faded to $209.04 by 11:25 a.m. Eastern Time, up only 0.85% from the prior close. The gap between the strong initial move and the later fade suggests that investors accepted the quarter as fundamentally good but were unwilling to assign a materially higher valuation while Q4 margins remain investment-heavy and the stock already discounts substantial long-term execution.
Earnings Call Highlights
- Management said grocery and other new verticals are growing faster than restaurants and remain on track to become gross-profit positive by the end of 2026. 💡 Reading Between the Lines: DoorDash is approaching the point where grocery may shift from a drag on consolidated unit economics to an incremental profit contributor. The remaining question is whether gross-profit positivity can translate into contribution profit after marketing, fulfillment and support costs.
- Deliveroo posted accelerating MAU, order and subscription growth, improved unit economics and contribution-profit positivity, while the unified global technology stack is expected to deliver additional benefits beginning around early 2027. 💡 Reading Between the Lines: The acquisition is contributing sooner than feared, but the largest integration synergies are still prospective. Valuation support therefore depends on successful technology migration without disrupting local execution or reigniting customer acquisition costs.
- U.S. paid DashPass subscriber growth was among the strongest of the last two years, and members accounted for approximately 75% of U.S. grocery and retail orders. 💡 Reading Between the Lines: DoorDash is intentionally accepting lower gross-margin percentages on member orders in exchange for higher frequency, retention and lifetime profit dollars. The model works only if cross-category engagement remains durable and promotional intensity does not rise faster than customer lifetime value.
- The Q2 adjusted EBITDA beat was driven by better advertising and subtotal economics, stronger Deliveroo volumes and contribution profit, and late-quarter efficiencies that management did not have time to reinvest. 💡 Reading Between the Lines: The beat reflects real operating leverage, but management explicitly does not intend to maximize quarterly margin. Forecasts should assume that a portion of future efficiency gains will be recycled into product, selection, quality, AI, autonomy and international expansion.
- Management said traffic from external agentic-commerce partners remains low, while DoorDash is prioritizing end-to-end physical-world execution, Ask DoorDash, internal AI productivity and autonomous delivery. 💡 Reading Between the Lines: Agentic commerce is not yet a meaningful revenue driver. DoorDash’s strategic bet is that inventory data, fulfillment, exception handling and merchant integration will make it an infrastructure partner to future digital assistants, but the near-term financial effect is higher development spending rather than material incremental sales.
2. Deep Business Insights
Hidden Metrics That Matter
1. Deliveroo contributed approximately 8.6% of Q2 revenue, calculated from company-reported figures.
Calculation: $383 million of Deliveroo revenue divided by $4.454 billion of total revenue equals approximately 8.6%. Revenue excluding Deliveroo was $4.071 billion, and $4.071 billion divided by Q2 2025 revenue of $3.284 billion implies 24.0% operational growth. Reported revenue growth was 35.6%, so the acquisition added roughly 11.6 percentage points to the headline growth rate.
This bridge is critical for valuation. A 24% organic revenue growth rate is still exceptional for a company of DoorDash’s scale, but it deserves a different multiple than a sustainable 36% organic growth rate. Investors should model Deliveroo separately until comparable periods normalize and should focus on whether consolidated contribution profit grows faster than the acquired revenue base.
2. Free-cash-flow conversion improved, but per-share value creation remains the harder test, calculated from company-reported figures.
Calculation: Q2 free cash flow of $742 million divided by adjusted EBITDA of $914 million equals 81.2% conversion. Q2 free cash flow divided by revenue equals 16.7%. Trailing-12-month free cash flow was $2.139 billion. DoorDash also repurchased 6.8 million shares for $1.049 billion through August 5, implying an average repurchase price of approximately $154.26 per share.
Despite the buyback, weighted-average diluted shares were 439 million in Q2 2026 versus 438 million a year earlier. The program has therefore not yet produced a lower diluted share base. That does not make the repurchases unattractive, especially because the average purchase price was below the August 6 market price, but it does mean investors should judge capital allocation by free cash flow per diluted share rather than aggregate free cash flow alone.
Customers choose DoorDash because the company combines four capabilities that are difficult to replicate in isolation: consumer membership and discovery, broad local selection, merchant demand-generation and software tools, and physical fulfillment with real-time exception handling. DashPass improves affordability and habit formation; merchant services support first-party ordering, advertising, loyalty and reservations; and the logistics network manages inventory uncertainty, merchant preparation, dispatch and customer support. The unique asset is not a single app feature. It is the integration of digital demand with local operational execution.
That distinction is especially important in grocery. Consumers value price, in-stock accuracy, substitutions, delivery speed and basket completeness simultaneously. Management said DashMart fulfillment services produced roughly ten-times-better error rates in early deployments because DoorDash controls the inventory. If that performance scales economically, DoorDash could differentiate on reliability rather than competing only through promotions or take rates.
Industry Chain Reactions
- ✅ Benefit — Kroger (NYSE: KR): DoorDash’s grocery expansion, DashPass-driven order frequency and partnership with Kroger can extend digital demand and same-day delivery reach without Kroger building every customer-acquisition and last-mile capability internally. The benefit is strongest if DoorDash generates incremental baskets rather than merely shifting existing store purchases into a higher-cost fulfillment channel.
- ❌ Face Pressure — Uber Technologies (NYSE: UBER): DoorDash’s accelerating U.S. restaurant growth, leadership claims in new-vertical order volume, improving international economics and unified technology platform increase the competitive burden on Uber Eats. Uber may need to defend membership value, merchant selection and delivery quality while maintaining its own margin targets.
These are strategic read-throughs, not forecasts of the named companies’ quarterly results. DoorDash does not disclose partner-level revenue or competitor-level market-share data sufficient to quantify the exact earnings impact.
Valuation Framework and Key Risks
At $209.04 per share on August 6, 2026, DoorDash had an equity market capitalization of approximately $91.84 billion. The company reported $4.424 billion of cash, $923 million of short-term investments and $869 million of long-term investments, against $2.727 billion of convertible notes. Excluding restricted cash, that implies approximately $3.489 billion of net cash and an enterprise value near $88.35 billion.
Trailing adjusted EBITDA was approximately $3.202 billion, calculated as Q3 2025 adjusted EBITDA of $754 million plus Q4 2025 of $780 million plus Q1 2026 of $754 million plus Q2 2026 of $914 million. The resulting enterprise-value-to-trailing-adjusted-EBITDA multiple is approximately 27.6 times.
Trailing free cash flow was $2.139 billion, implying a market-cap-to-free-cash-flow multiple of approximately 42.9 times and a free-cash-flow yield of 2.3%. The trailing GAAP P/E was approximately 109 times. GAAP P/E is not the cleanest standalone measure because acquisition amortization, stock compensation and legal or regulatory items can distort period comparisons, but the high multiple still confirms that the market expects sustained growth and future operating leverage.
A useful expectations framework is to ask how much free cash flow DoorDash must produce before the valuation looks less demanding. At the current market capitalization, a 30-times free-cash-flow multiple would require approximately $3.06 billion of annual free cash flow, 43% above the latest trailing figure. A 25-times multiple would require approximately $3.67 billion, 72% above trailing free cash flow. DoorDash does not need to deliver that increase in one year, but the arithmetic shows that the current price embeds several years of execution rather than only the next quarter.
The valuation can be supported if organic revenue remains near or above 20%, grocery and international categories become durable contribution-profit generators, advertising and merchant software improve monetization, and technology investment eventually reduces duplicated costs. The multiple is vulnerable if reported growth converges rapidly toward the mid-teens after Deliveroo comparisons normalize, if Q4 margin seasonality becomes a persistent investment reset, or if autonomy and AI spending grows without measurable returns.
Key risks include:
- Acquisition masking: Deliveroo added approximately 11.6 percentage points to reported revenue growth, making organic deceleration easier to overlook.
- Margin reinvestment: Management intends to recycle efficiency gains into growth, so adjusted EBITDA beats may not translate into a straight-line margin expansion path.
- GAAP-adjusted divergence: Stock compensation, amortization and legal or regulatory costs remain large relative to GAAP operating income.
- Labor, insurance and regulation: Dasher classification, minimum-pay rules, price controls, insurance costs and tax disputes can alter unit economics by market.
- Integration execution: Deliveroo and Wolt operate in locally competitive markets with no automatic global network effect. Technology migration must preserve selection, reliability and consumer retention.
- Competitive intensity: Uber, Instacart, Amazon and local platforms can compete through membership bundling, merchant economics, logistics density and promotions.
- Capital-allocation risk: Buybacks have absorbed more than $1 billion in 2026, yet the diluted share count has not declined year over year.
- Autonomy and AI uncertainty: The projects may improve long-run fulfillment cost and product conversion, but near-term adoption, regulation, capital intensity and return timing remain uncertain.
3. Key FAQs
Did DoorDash beat Q2 2026 earnings estimates?
DoorDash beat revenue, Marketplace GOV and adjusted EBITDA expectations but slightly missed GAAP EPS. Revenue of $4.454 billion was 2.6% above the $4.34 billion consensus. Adjusted EBITDA of $914 million was 8.6% above the $841.8 million LSEG estimate. GAAP diluted EPS of $0.46 was one cent below the $0.47 FactSet estimate.
Why did DASH stock fade after the Q2 2026 earnings report?
The stock initially rose because revenue, GOV, adjusted EBITDA and Q3 guidance were better than expected. The move faded because the valuation already assumes strong execution, management expects adjusted EBITDA margin to decline sequentially in Q4, and reported growth was partly acquisition-driven. The intraday reversal was therefore more consistent with valuation discipline and margin caution than with a weak quarter.
Is DASH stock expensive after Q2 2026 earnings?
At $209.04, DASH traded at approximately 27.6 times trailing adjusted EBITDA and 42.9 times trailing free cash flow, with a trailing free-cash-flow yield of about 2.3%. Those multiples can be justified by durable 20%-plus organic growth and expanding long-term margins, but they provide limited protection if growth slows or investment spending delays free-cash-flow-per-share expansion.
Primary sources: DoorDash’s official Q2 2026 financial results and the official Q2 2026 earnings-call webcast archive. Consensus comparisons were cross-checked against Reuters reporting based on LSEG data.
Disclaimer: This article/chart is for educational and informational purposes only and does not constitute investment advice of any kind. Past performance is not indicative of future results. Investors should independently evaluate their own risks.