Key Takeaways
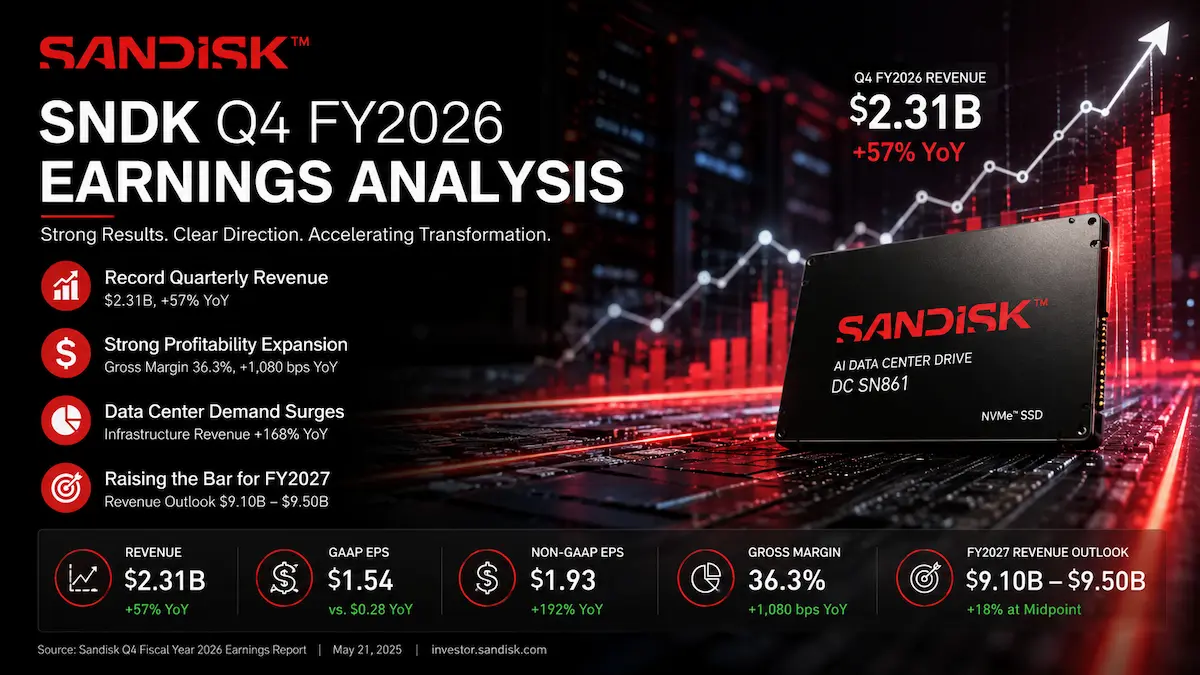
- Sandisk reported fiscal Q4 2026 revenue of $8.965 billion, up 51% sequentially and 372% year over year, while non-GAAP diluted EPS of $39.25 exceeded the FactSet consensus of $34.96.
- The headline growth rate overstated underlying unit growth: management attributed approximately one-third of sequential revenue growth to higher volume and two-thirds to higher pricing.
- Datacenter revenue doubled sequentially to $2.977 billion, but Edge remained the largest business at $5.432 billion; Consumer fell 32% sequentially to $556 million.
- New Business Model agreements now represent minimum contracted revenue of $93.9 billion at floor pricing and cover more than half of FY2027 bits and roughly two-thirds of FY2028 bits.
- The stock reaction reflected an expectations problem rather than a weak quarter: Q1 FY2027 revenue guidance midpoint of $10.55 billion was below the approximately $10.82 billion consensus, while gross-margin guidance implied modest sequential normalization.
1. Core Earnings Breakdown
Revenue and Profitability Analysis
Sandisk delivered a numerically exceptional fiscal fourth quarter, but the quality of the growth needs to be separated from the reported growth rate. Revenue reached $8.965 billion, increasing 51% from Q3 FY2026 and 372% from the prior-year quarter. The year-over-year comparison reflects an unusually favorable NAND pricing cycle, a major customer-mix shift and a low prior-year base. It should not be interpreted as comparable operational unit growth.
Management provided the most important bridge: approximately one-third of the sequential revenue increase came from higher bit volume and two-thirds came from higher pricing. For the full fiscal year, bit growth was only in the mid-teens even though revenue increased 175%. That distinction matters because pricing-led earnings can produce extraordinary operating leverage while remaining more sensitive to future supply-demand normalization than volume-led growth.
End Market | Q4 FY2026 Revenue | Share of Total Revenue | Sequential Growth | Year-over-Year Growth | Investment Interpretation |
|---|---|---|---|---|---|
Datacenter | $2.977 billion | 33.2% | 103% | 1,298% | Datacenter is the strategic mix engine and the clearest evidence that Sandisk is moving beyond transactional consumer NAND, but it is not yet the largest revenue contributor. |
Edge | $5.432 billion | 60.6% | 48% | 392% | Edge remains the core earnings base. Higher storage content and premium-device mix are offsetting weak PC and smartphone units, making pricing and content per device more important than unit shipments. |
Consumer | $556 million | 6.2% | -32% | -5% | The decline shows real demand elasticity and slower price transmission in retail channels. Consumer is now a diversification and channel asset rather than the principal earnings driver. |
Profitability was stronger than revenue alone suggests. GAAP gross margin was 84.6%, up 6.2 percentage points sequentially and 58.4 percentage points year over year. Non-GAAP gross margin was also 84.6% because the only gross-profit adjustment was $6 million of stock-based compensation. GAAP operating income was $7.037 billion, equivalent to a calculated GAAP operating margin of 78.5%. Non-GAAP operating income was $7.104 billion, producing the company-reported non-GAAP operating margin of 79.2%, up from 70.9% in Q3.
The GAAP and adjusted EPS relationship was unusual. GAAP diluted EPS of $43.97 exceeded non-GAAP EPS of $39.25 because GAAP results included an approximately $804 million gain on marketable equity securities, principally related to Sandisk’s Nanya investment. The adjusted figure excluded that gain and added back $67 million of stock-based compensation. Investors should therefore use $39.25, not $43.97, when evaluating recurring quarterly earnings power.
Earnings quality was still high after removing non-operating gains. Adjusted free cash flow was $5.035 billion, or a 56% margin, compared with non-GAAP net income of $6.162 billion. The resulting 81.7% cash conversion ratio is calculated as $5.035 billion divided by $6.162 billion and is calculated from company-reported figures. However, reported operating cash flow of $7.126 billion included $1.938 billion of NBM prepayments and deposits; Sandisk appropriately excluded those contractual cash inflows from adjusted free cash flow.
Expectations vs. Actual Results
Metric | Actual or Guidance | Expectation or Benchmark | Variance | Result |
|---|---|---|---|---|
Q4 FY2026 revenue | $8.965 billion | $8.48 billion FactSet consensus | +$485 million, or +5.7% | ✅ Beat |
Q4 FY2026 non-GAAP diluted EPS | $39.25 | $34.96 FactSet consensus | +$4.29, or +12.3% | ✅ Beat |
Q4 FY2026 non-GAAP operating margin | 79.2% | 73.9% implied at the midpoint of prior company guidance | +5.3 percentage points | ✅ Beat benchmark |
Q1 FY2027 revenue guidance | $10.3 billion to $10.8 billion; midpoint $10.55 billion | Approximately $10.82 billion FactSet consensus | -$270 million, or -2.5%, at midpoint | ⚠️ Below consensus |
Q1 FY2027 non-GAAP EPS guidance | $44.00 to $46.00; midpoint $45.00 | Approximately $44.72 consensus | +$0.28, or +0.6%, at midpoint | ➖ Roughly in line |
Q1 FY2027 non-GAAP gross-margin guidance | 83.0% to 85.0%; midpoint 84.0% | 84.6% in Q4 FY2026 | -0.6 percentage point sequentially at midpoint | ⚠️ Mild normalization |
The operating-margin comparison uses an implied benchmark rather than a published Wall Street consensus. Sandisk’s prior Q4 guidance called for revenue of $7.75 billion to $8.25 billion, non-GAAP gross margin of 79% to 81%, and non-GAAP operating expenses of $480 million to $500 million. At the respective midpoints, implied non-GAAP operating margin was approximately 73.9%: (($8.0 billion × 80.0%) − $490 million) ÷ $8.0 billion. Labeling this as an implied company-guidance benchmark avoids inventing a consensus margin figure that was not publicly disclosed in the sources reviewed.
The Q4 beat came from three sources. First, pricing contributed about twice as much as volume to sequential revenue growth. Second, gross margin finished 3.6 percentage points above the high end of prior guidance, while operating expenses remained within guidance. Third, Datacenter revenue reached $2.977 billion, above the approximately $2.74 billion estimate cited by Barron’s, more than offsetting Consumer revenue of $556 million, which was below the approximately $874 million estimate cited by MarketWatch.
The market cared more about the forward revenue and margin trajectory than the historical beat. The Q1 revenue midpoint was below consensus, while the 84% gross-margin midpoint implied that further pricing gains would not automatically produce another sequential margin expansion. EPS guidance was roughly in line because the company still expects extraordinary operating leverage, but investors were already capitalizing a highly favorable NAND environment.
SNDK fell 5.4% during the August 5 regular session to $1,350.50, then traded near $1,230 in early August 6 premarket indications, approximately 9% below the prior close. The reaction was not adequately explained by the phrase “sell the news.” The more defensible explanation is that revenue guidance failed to clear a very elevated expectation bar after a 469% year-to-date gain through the August 5 close. There was no announced acquisition dilution. In fact, Sandisk expanded its buyback authorization. The valuation, guidance ceiling, modest gross-margin step-down and management’s emphasis on durability over maximizing spot-market upside were the relevant variables.
Earnings Call Highlights
- NBM agreements now cover more than 50% of FY2027 bits and roughly two-thirds of FY2028 bits, with $93.9 billion of minimum contracted revenue at floor pricing. 💡 Reading Between the Lines: Sandisk is attempting to replace three-month NAND visibility with multi-year contracted economics. The valuation case can therefore migrate from a pure spot-price multiple toward a contracted-cash-flow framework, but only if customer commitments remain enforceable through a downturn.
- Management expects NBM gross margins around 80%, with variable pricing upside and $16.5 billion of financial guarantees supporting customer obligations. 💡 Reading Between the Lines: Sandisk is deliberately trading some peak spot-price optionality for floors, duration and downside protection. A slightly lower near-term gross margin can be economically rational if it reduces the probability and severity of the next trough.
- Sandisk began revenue shipments of its QLC Stargate platform, while Datacenter reached 38% of exiting bit mix and HBF remained in deep customer engagement. 💡 Reading Between the Lines: The product mix is expanding from performance-oriented TLC enterprise SSDs into high-capacity AI data lakes. HBF and KV-cache opportunities could create a new valuation layer, but management did not provide a commercial shipment timetable or pricing premium, so investors should not capitalize that opportunity as current earnings.
- Supply growth remains targeted at the mid-to-high teens through node transitions rather than major wafer additions, while FY2027 sellable-bit growth is expected in the mid-teens. 💡 Reading Between the Lines: Technology-led bit growth supports low capital intensity and free cash flow, while higher inventory requirements under NBMs constrain near-term sellable supply. This is supportive for pricing but introduces execution risk around BiCS8, BiCS10 and inventory management.
- The board added $14 billion to repurchase authorization, leaving $15.5 billion remaining, and management stated that buybacks are currently preferable to dividends. 💡 Reading Between the Lines: Management views the balance sheet and cash-generation profile as strong enough for aggressive capital return. The program can materially reduce share count, but value creation depends on repurchase price, not authorization size.
2. Deep Business Insights
Hidden Metrics That Matter
Metric 1: NBM financial-guarantee coverage. Pro forma remaining performance obligations were $91.1 billion after including two agreements signed after quarter-end, while cash deposits and financial instruments totaled $16.5 billion. The coverage ratio is 18.1%, calculated as $16.5 billion ÷ $91.1 billion and calculated from company-reported figures. This is not equivalent to 18.1% cash collateral on Sandisk’s balance sheet because much of the protection is provided through third-party financial institutions. It nevertheless creates a meaningful economic penalty for non-performance, and management said coverage rises as agreements approach completion.
Metric 2: repurchase execution price. Sandisk spent $4.524 billion to repurchase 2.836 million shares in Q4. The implied average price was approximately $1,595 per share, calculated as $4.524 billion ÷ 2.836 million shares and calculated from company-reported figures. That average was about 18.1% above the August 5 closing price of $1,350.50. The remaining $15.5 billion authorization equaled approximately 7.3% of the company’s $212.0 billion market capitalization at that close. Future repurchases below the Q4 average would be more accretive, but the first tranche illustrates why capital allocation discipline must be assessed separately from cash-generation strength.
Customers choose Sandisk for more than NAND availability. The company controls chip-level design and intellectual property, co-develops and manufactures through its Flash Ventures relationship with Kioxia, designs controllers and complete storage systems, and serves Datacenter, Edge and Consumer markets. That vertical integration gives strategic customers three benefits: supply visibility, roadmap coordination and the ability to qualify multiple product types from one technology platform. The breadth of TLC, QLC, enterprise SSD, embedded and branded products also lets Sandisk direct bits toward the highest-value end markets instead of depending on a single device category.
Industry Chain Reactions
- ✅ Benefit — Micron Technology (NASDAQ: MU): Sandisk’s pricing-led growth, allocation beyond calendar 2027 and strong AI-storage demand support the broader thesis that memory suppliers retain pricing power. Micron remains a competitor, so the benefit is industry-level rather than company-specific; disciplined supply and rising storage intensity are favorable, while aggressive capacity expansion would weaken the read-through.
- ❌ Face Pressure — Apple (NASDAQ: AAPL): Higher NAND pricing increases bill-of-materials pressure across premium smartphones and computing devices. Apple’s scale, product pricing and supplier diversification provide protection, but Sandisk’s comments that higher consumer prices are already affecting total addressable demand indicate that component inflation can eventually reach device margins or replacement cycles.
Valuation Framework and Key Risks
At the August 5 close of $1,350.50, Sandisk’s market capitalization was approximately $212.0 billion. Early August 6 premarket indications near $1,230 reduced the implied equity value materially, but the valuation debate remains the same: investors must decide whether the company’s current profitability represents durable contracted economics or a cyclical peak supported by extreme NAND pricing.
- FY2026 adjusted P/E: $1,350.50 ÷ $70.88 adjusted EPS = 19.1 times.
- Q1 FY2027 annualized adjusted P/E: $1,350.50 ÷ ($45 midpoint EPS × 4) = 7.5 times.
- FY2026 adjusted free-cash-flow yield: $8.743 billion ÷ $212.0 billion market capitalization = 4.1%.
All three calculations are based on company-reported figures and the August 5 closing market value. The gap between a 19.1-times trailing adjusted P/E and a 7.5-times annualized Q1 run-rate multiple is the central valuation issue. Annualizing one quarter assumes that pricing, mix and margins remain near current levels, which is not a conservative assumption for a memory company. Conversely, using only FY2026 understates the earnings power embedded in already-issued Q1 guidance.
Illustrative Normalized P/E | Normalized EPS Implied by $1,350.50 Share Price | What the Market Would Be Assuming |
|---|---|---|
15 times | Approximately $90 | Significant margin normalization and a return to a more conventional semiconductor multiple. |
12 times | Approximately $112.50 | NBMs improve durability, but peak pricing and more than 80% gross margins do not persist indefinitely. |
10 times | Approximately $135 | Current earnings remain unusually strong, but the market applies a cyclical discount to the run rate. |
The stock does not require Q1 EPS to miss for downside to occur. It only requires investors to lower the duration assigned to those earnings. The principal risks are:
- Pricing and gross-margin normalization: two-thirds of sequential revenue growth came from pricing, and Q1 gross-margin guidance already indicates a modest step-down at midpoint.
- NBM concentration and contract behavior: multi-year agreements improve visibility, but large strategic customers can still alter deployment schedules, mix and negotiations. Financial guarantees reduce but do not eliminate this risk.
- AI infrastructure duration: management expects NAND demand to accelerate with inference and agentic AI, but hyperscaler capital spending, architecture choices and KV-cache implementation remain external variables.
- Edge demand elasticity: management expects 2026 PC and smartphone units to decline in the mid-teens, with higher content compensating. A weaker premium-device mix would challenge that offset.
- Technology and manufacturing execution: BiCS8, BiCS10, controller design and the Kioxia joint venture must deliver cost, yield and performance improvements on schedule.
- Capital allocation: the Q4 average repurchase price was materially above the post-earnings price. Aggressive buybacks create value only when conducted below long-term intrinsic value.
3. Key FAQs
Why did SNDK stock fall after beating Q4 2026 earnings?
SNDK fell because the market was focused on the next quarter, not the reported quarter. Q1 FY2027 revenue guidance midpoint of $10.55 billion was below the approximately $10.82 billion consensus, and gross-margin guidance of 83% to 85% implied mild normalization. After a 469% year-to-date gain through August 5, investors required a larger guidance beat to support the existing earnings-duration assumptions.
What were Sandisk’s Q4 2026 revenue, EPS and margins?
Sandisk reported Q4 FY2026 revenue of $8.965 billion, GAAP diluted EPS of $43.97, non-GAAP diluted EPS of $39.25, GAAP gross margin of 84.6%, non-GAAP gross margin of 84.6% and non-GAAP operating margin of 79.2%. GAAP EPS was higher than adjusted EPS because GAAP results included an approximately $804 million gain on equity securities that was excluded from non-GAAP earnings.
Is Sandisk’s 84.6% gross margin sustainable after Q4 2026?
The Q1 FY2027 guide of 83% to 85% indicates that management expects margins to remain exceptionally high in the near term, but not necessarily expand every quarter. Sustainability depends on NAND supply discipline, NBM floor economics, product mix, AI-storage demand and technology transitions. Investors should model a range of normalized margins rather than treat 84.6% as a permanent level.
Primary sources: Sandisk’s official Q4 FY2026 earnings release, official Q4 FY2026 earnings presentation, and official earnings-call webcast page. Sandisk did not publish a separate official text transcript on its IR page at the time of review; management commentary was checked against the official webcast and the Quartr-sourced call transcript. Consensus estimates and price reaction were cross-checked against Investor’s Business Daily and MarketWatch.
Disclaimer: This article/chart is for educational and informational purposes only and does not constitute investment advice of any kind. Past performance is not indicative of future results. Investors should independently evaluate their own risks.