
⚡ Key Takeaways
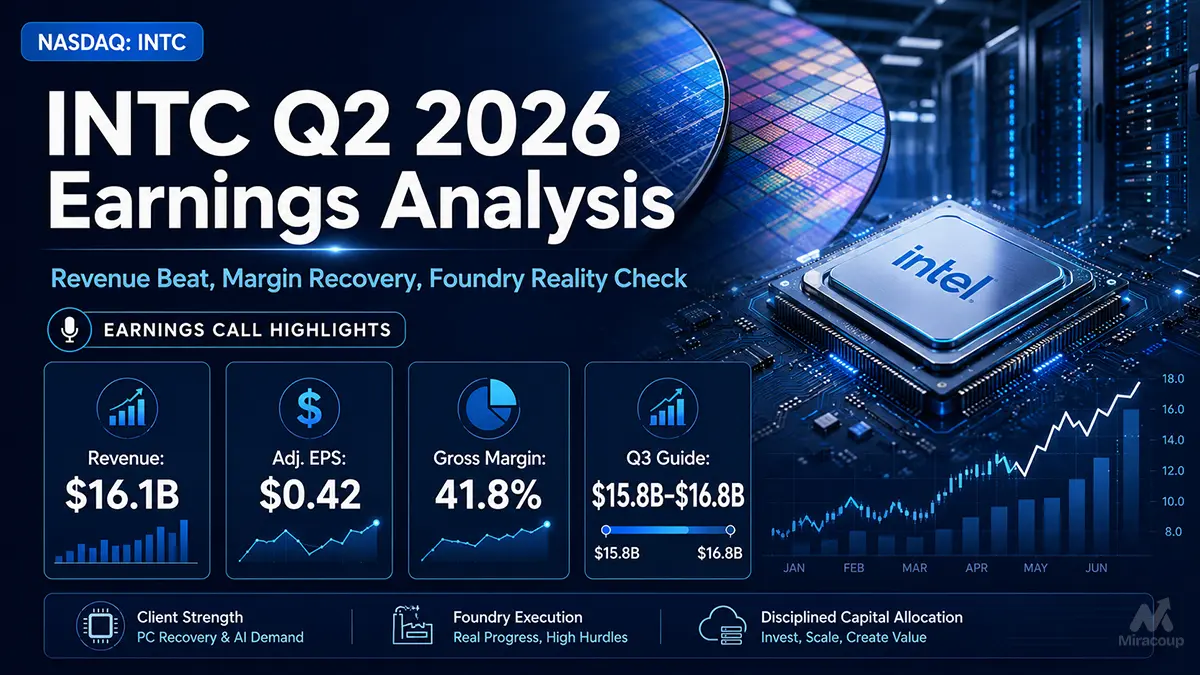
- Intel delivered a genuine earnings beat: Q2 revenue reached $16.128 billion, up 25% year over year and approximately 11.8% above Wall Street consensus, while non-GAAP EPS of $0.42 doubled the pre-release estimate.
- The quality of the operating recovery improved materially: non-GAAP gross margin expanded to 41.8% and non-GAAP operating margin reached 17.2%, driven by data-center demand, premium product mix, better factory yields and tighter operating expenses.
- The Foundry headline remains misleading without context: Intel Foundry reported $5.765 billion of segment revenue, but only $293 million came from external customers, while the division still recorded a $2.089 billion operating loss.
Part 1: Core Earnings Breakdown
1. Revenue and Profitability Analysis
Intel reported Q2 2026 revenue of $16.128 billion, representing 25% year-over-year growth from $12.859 billion. This was Intel’s strongest reported revenue growth in more than 15 years and came in approximately $1.71 billion above the $14.42 billion pre-release consensus.
The quarter was more than a headline revenue beat. Intel finally demonstrated meaningful operating leverage:
- GAAP gross margin: 40.4%, up 12.9 percentage points year over year.
- Non-GAAP gross margin: 41.8%, up 12.1 percentage points and 2.8 percentage points above Intel’s previous 39% guidance.
- GAAP operating margin: 11.1%, versus a 24.7% operating loss margin in Q2 2025.
- Non-GAAP operating margin: 17.2%, versus negative 3.9% one year earlier.
- Non-GAAP EPS: $0.42, versus a loss of $0.10 in Q2 2025.
- Operating cash flow: $7.006 billion, compared with $2.050 billion in the prior-year quarter.
Intel nevertheless reported GAAP EPS of negative $2.16 and a GAAP net loss attributable to Intel of $11.033 billion. The apparent contradiction was primarily caused by a $12.529 billion non-cash mark-to-market loss on a derivative liability linked to Intel shares held in escrow under its agreement with the U.S. Department of Commerce. The GAAP loss therefore does not reflect the underlying profitability of Intel’s product operations, although the associated capital-structure complexity and potential dilution should not be ignored.
Business Segment Breakdown
- Client Computing and Physical AI Group: $8.877 billion, up 13%. This represented approximately 55% of consolidated revenue. Growth reflected stronger premium product mix, pricing and demand for Intel’s client processors, including AI PC and physical AI applications.
- Data Center and AI: $6.262 billion, up 59%. DCAI accounted for approximately 38.8% of consolidated revenue. This was the standout business, benefiting from AI infrastructure investment, higher demand for server CPUs and a richer mix of premium Xeon products.
- Total Intel Products: $15.139 billion, up 28%. Intel Products generated $4.817 billion of segment operating income, equal to an operating margin of approximately 31.8%.
- Intel Foundry: $5.765 billion, up 31%. The reported growth was dominated by internal manufacturing transactions. Intel eliminated $5.477 billion of intersegment revenue at the consolidated level.
- All Other: $701 million, down 33%. The decline largely reflected the previous deconsolidation of Altera.
Quick Take: Q2 marked a proper operating reset. Intel is no longer relying solely on cost cuts to defend earnings; stronger server demand, premium pricing, improving yields and factory throughput are now contributing simultaneously. The critical question is whether this operating leverage can survive the next capacity expansion cycle.
2. Expectations Versus Actual Results
Metric | Q2 2026 Actual | Verified Benchmark | Result |
|---|---|---|---|
Total Revenue | $16.128 billion | $14.42 billion Street consensus | ✅ Beat by $1.71 billion, or approximately 11.8% |
Non-GAAP EPS | $0.42 | $0.21 Street consensus | ✅ Beat by $0.21, or 100% |
Non-GAAP Gross Margin | 41.8% | 39.0% previous company guidance | ✅ Beat guidance by 2.8 percentage points |
Non-GAAP Operating Margin | 17.2% | No reliable public consensus disclosed in the cited primary or consensus sources | ✅ Improved 21.1 percentage points year over year; not scored against Street |
GAAP EPS | Negative $2.16 | Not comparable with adjusted consensus due to the escrowed-share mark-to-market charge | ⚠️ Distorted by a $12.529 billion non-cash accounting loss |
Q3 2026 Guidance
Metric | Intel Guidance | Pre-Release Market Benchmark | Read-Through |
|---|---|---|---|
Revenue | $15.8 billion to $16.8 billion | Approximately $15.1 billion | ✅ Midpoint of $16.3 billion was roughly 7.9% above expectations |
Non-GAAP Gross Margin | 42.0% | 41.8% in Q2 2026 | ✅ Guidance implies further sequential margin expansion |
Non-GAAP EPS | $0.38 | Approximately $0.27 before the release | ✅ Materially ahead of pre-earnings expectations |
GAAP EPS | $0.31 | Not directly comparable | ✅ Guidance implies a return to positive reported earnings |
The Q3 outlook matters because it suggests the Q2 beat was not merely caused by customers pulling orders forward. Intel is guiding for revenue to remain above $16 billion at the midpoint while gross margin continues to expand, despite rising investment in manufacturing capacity.
3. Earnings Call Highlights
- “Strong demand for our products continues to outpace our growing supply. This marks the seventh consecutive quarter of exceeding our financial expectations.” 💡 Reading Between the Lines: Intel’s near-term problem has shifted from insufficient demand to insufficient supply. That supports pricing and product mix, but it also means revenue growth could remain capped until additional wafer, substrate and component capacity comes online.
- “My confidence in our foundry process roadmap has grown significantly since joining over a year ago.” 💡 Reading Between the Lines: Management is signalling that Intel 18A execution and early 14A engagement have cleared important internal milestones. However, roadmap confidence is not yet the same as bankable external revenue; investors should demand evidence through customer tape-outs, volume commitments and external Foundry sales.
- “We are meaningfully increasing our investments in equipment, clean room space, and substrates.” 💡 Reading Between the Lines: Intel is prioritising capacity capture over near-term free cash flow. Management raised its 2026 gross capital expenditure plan from approximately $18 billion to more than $20 billion, so the earnings rerating now carries a heavier cash-conversion test.
Part 2: Deep Business Insights
1. Hidden Key Metrics the Headlines Missed
External Foundry Revenue Was Only $293 Million
The most important figure in the entire filing was not the reported $5.765 billion of Intel Foundry revenue. It was the disclosure that external Foundry revenue was only $293 million.
- External revenue represented only 5.1% of Intel Foundry segment revenue.
- It represented approximately 1.8% of Intel’s consolidated revenue.
- The remaining Foundry revenue was substantially generated by manufacturing services supplied to Intel’s own product divisions.
- Intel also stated that much of the external revenue increase came from Altera becoming an external customer after its deconsolidation.
This is the clearest reality check on the Foundry narrative. Intel has made genuine manufacturing progress, but it has not yet built a large third-party wafer foundry comparable with TSMC. A proper Foundry rerating requires external customers to move from test chips and packaging engagements into sustained high-volume production.
Foundry Losses Remain Economically Material
Intel Foundry recorded a $2.089 billion operating loss, equivalent to a negative operating margin of approximately 36%. This improved substantially from a $3.168 billion loss and negative 72% margin in Q2 2025, but it still absorbed roughly 43% of the $4.817 billion operating profit generated by Intel Products.
Intel disclosed that the Foundry improvement benefited partly from lower period charges, while the early Intel 18A ramp continued to carry high wafer costs. The key metric to watch is therefore not Foundry revenue growth in isolation, but the combination of:
- External revenue growth;
- 18A and 18A-P yield progression;
- Foundry operating loss reduction;
- Advanced packaging capacity utilisation; and
- Customer volume commitments for 18A and 14A.
Adjusted Free Cash Flow Was Negative $8.419 Billion
Intel generated $7.006 billion of operating cash flow, yet reported adjusted free cash flow of negative $8.419 billion. The reconciliation included a $12.216 billion net partner-contribution outflow, alongside capital expenditure and finance-lease payments.
This does not invalidate the operating recovery, but it demonstrates why Intel cannot be valued purely on adjusted EPS. The turnaround remains capital intensive, and shareholders need stronger evidence that manufacturing investment will translate into sustainable returns on invested capital.
Why Customers May Still Choose Intel
Intel’s unique selling proposition is not simply that it produces CPUs. The company can combine:
- A deeply embedded global x86 software and enterprise ecosystem;
- Client and server CPUs;
- Purpose-built ASIC design capabilities;
- Advanced packaging technologies;
- Leading-edge process development; and
- High-volume semiconductor manufacturing in the United States.
Intel describes itself as the only company conducting both leading-edge logic research and high-volume manufacturing in the United States. For governments and customers seeking geographic diversification away from an Asia-concentrated semiconductor supply chain, this domestic manufacturing footprint has strategic value.
The collaboration with Fortinet illustrates the potential model: Intel can provide design support, process technology, packaging and manufacturing rather than selling only a standard processor. This integrated offering is particularly relevant for security, defence, networking and other applications where supply-chain control matters.
2. Semiconductor Supply-Chain Read-Through
✅ Potential Beneficiary: ASML Holding — ASML
Intel’s decision to raise manufacturing investment is a positive read-through for semiconductor equipment suppliers, particularly ASML. Intel has already disclosed the use of ASML’s EXE High-NA EUV technology in the production ramp for selected Intel 18A products.
Higher Intel spending on leading-edge wafer capacity, clean-room space and future nodes should support demand for lithography systems and related services. The main caveat is timing: semiconductor equipment orders, deliveries and revenue recognition can span multiple quarters or years.
❌ Potential Relative Pressure: Advanced Micro Devices — AMD
Intel’s 59% DCAI revenue growth, stronger Xeon demand and premium server CPU pricing represent a competitive read-through for AMD. A more credible Intel product roadmap could slow AMD’s server market-share gains and intensify pricing competition in enterprise and cloud CPUs.
This is relative pressure rather than an outright bearish industry signal. AI infrastructure demand remains sufficiently strong to support multiple CPU suppliers, while AMD retains competitive products and exposure to accelerators. The risk is that Intel’s recovery reduces the amount of incremental share available to AMD.
3. Valuation Framework and Key Risks
At approximately $81.88 per share on July 30, 2026, Intel had an indicated equity market capitalisation of roughly $417.9 billion.
Using simple annualised run-rate calculations rather than Wall Street forward forecasts:
- The shares traded at approximately 6.5 times annualised Q2 revenue.
- The shares traded at approximately 48.7 times annualised Q2 non-GAAP EPS.
- Using Q3 non-GAAP EPS guidance of $0.38, the shares traded at approximately 53.9 times the simple annualised guided EPS run rate.
These are not conventional forward valuation multiples, but they are useful for understanding what the market is discounting. At this valuation, investors are already paying for more than a cyclical CPU recovery. The share price implies a combination of sustained AI-driven growth, continued margin expansion, credible Foundry execution and substantially better future cash generation.
What the Bull Case Requires
- DCAI revenue growth remains strong after supply normalises.
- Non-GAAP gross margin moves sustainably above the low-40% range.
- Intel 18A yields improve sufficiently to reduce Foundry unit costs.
- Advanced packaging becomes a material external revenue stream.
- External Foundry customers progress into meaningful production volume.
- Higher capital expenditure generates acceptable long-term returns rather than prolonged cash burn.
Principal Risks
- Foundry commercialisation risk: external Foundry revenue remains small relative to Intel’s investment and operating losses.
- Capital intensity: the increase in equipment and capacity spending could delay free-cash-flow recovery.
- Execution risk: delays, weak yields or cost overruns on Intel 18A, 18A-P or 14A would damage the turnaround thesis.
- Supply-chain risk: Intel expects shortages involving substrates, memory and other components to persist into 2027.
- Competitive risk: Intel continues to face AMD and Arm-based CPUs, Nvidia’s expanding platform strategy and TSMC’s established foundry ecosystem.
- Valuation risk: the current multiple leaves limited room for revenue, margin or customer-conversion disappointments.
- Capital-structure complexity: escrowed shares and conditional government warrants create potential dilution and make GAAP earnings more volatile.
Buy-Side View: Q2 2026 was Intel’s most convincing operating quarter in years. The product recovery is real, pricing is firmer and management has restored near-term earnings momentum. However, the stock is no longer priced like a distressed turnaround. The next leg of the rerating must be earned through external Foundry revenue, lower Foundry losses and demonstrably better free-cash-flow conversion.
Part 3: Key FAQs
Did Intel beat Q2 2026 earnings expectations?
Yes. Intel reported Q2 2026 revenue of $16.128 billion versus approximately $14.42 billion expected. Non-GAAP EPS was $0.42 versus a consensus estimate of approximately $0.21. Non-GAAP gross margin of 41.8% was also 2.8 percentage points above Intel’s prior guidance.
Why was Intel’s Q2 2026 GAAP EPS negative despite the earnings beat?
Intel’s GAAP EPS of negative $2.16 was primarily caused by a $12.529 billion non-cash mark-to-market loss on a derivative liability related to Intel shares held in escrow under its U.S. government agreement. Excluding designated adjustments, Intel generated non-GAAP net income of $2.197 billion and non-GAAP EPS of $0.42.
Is Intel Foundry profitable after Q2 2026?
No. Intel Foundry reported a Q2 operating loss of $2.089 billion on segment revenue of $5.765 billion, equivalent to a negative operating margin of approximately 36%. Moreover, only $293 million of Foundry revenue came from external customers, meaning the business remains predominantly an internal manufacturing operation.
Transcript methodology: Intel Investor Relations published the official prepared remarks and earnings-call audio replay, but not an official verbatim transcript of the analyst Q&A. Management quotations were cross-checked against Intel’s official materials and available transcript records.
Primary sources: Review Intel’s official Q2 2026 earnings release, Q2 2026 Form 10-Q, and official Q2 2026 earnings call page.
Disclaimer: This article/chart is for educational and informational purposes only and does not constitute investment advice of any kind. Past performance is not indicative of future results. Investors should independently evaluate their own risks.