

Key Takeaways
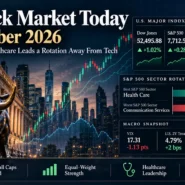
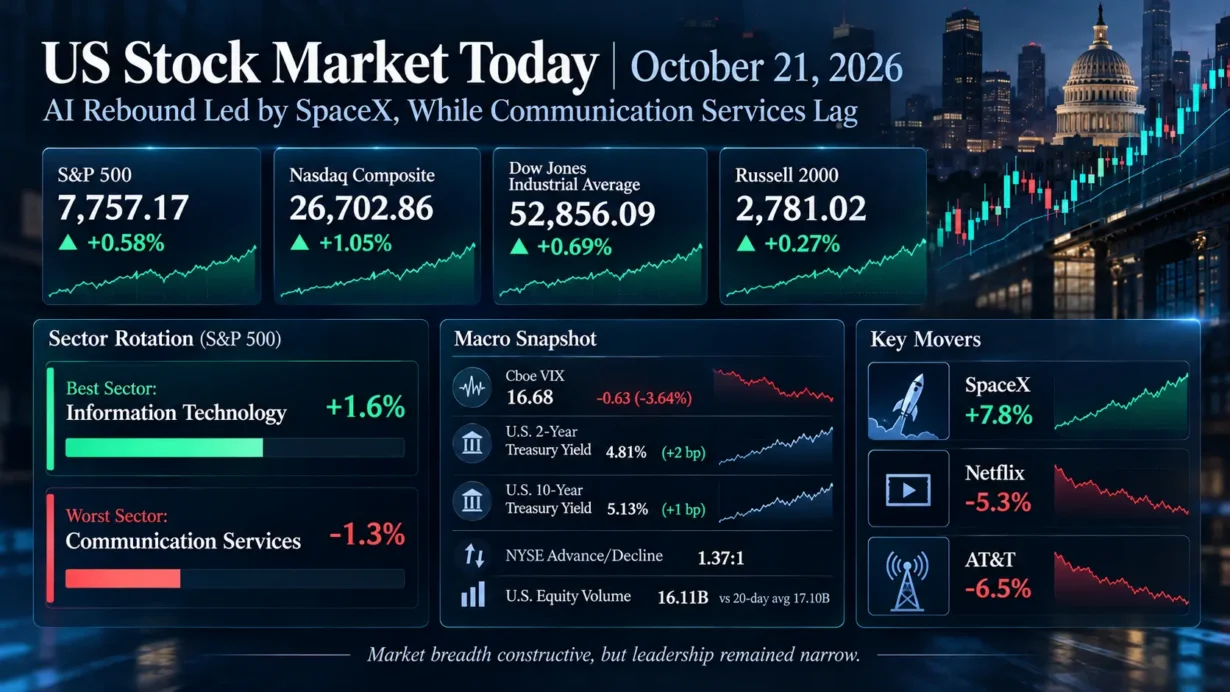
- The S&P 500 closed at 7,757.17 (+0.58%), the Nasdaq Composite at 26,702.86 (+1.05%) and the Dow at 52,856.09 (+0.69%). The Russell 2000 gained just 0.27% to 2,781.02.
- S&P 500 Information Technology led all 11 sectors (+1.6%); Communication Services ranked last (−1.3%). SpaceX (+7.8%) revived enthusiasm for AI profitability, while Netflix (−5.3%) and AT&T (−6.5%) weighed on the laggard sector.
- Market participation was constructive, not overwhelming: NYSE advancers beat decliners 1.37 to 1, while 16.11 billion shares traded across U.S. exchanges versus a 17.10 billion-share 20-session average.
- The Cboe VIX finished at 16.68 (−0.63 point, or −3.64%), although Treasury’s two-year yield rose 2 basis points to 4.81% and its 10-year yield rose 1 basis point to 5.13%.
1. Market Capital Flows and Sector Rotation
Wednesday’s advance was primarily an earnings-driven repricing of AI exposure, not a broad relief rally powered by falling rates. The S&P 500 Information Technology sector gained 1.6%, helped by a 2.0% rise in the Philadelphia Semiconductor Index; Communication Services lost 1.3%, a 2.9-percentage-point sector performance gap. The Nasdaq’s 1.05% rise far exceeded the small-cap Russell 2000’s 0.27%, favoring larger, growth-oriented businesses with visible AI revenue. Industrial cyclicals participated as well: the industrial-sector ETF proxy advanced 0.9%, while defensive consumer staples and rate-sensitive real estate ETF proxies lost 0.7% and 0.8%, respectively. These ETF figures are not S&P sector-index returns, and the session does not establish a definitive growth-versus-value factor spread.
Breadth tempered the bullish headline. NYSE advancers outnumbered decliners 1.37 to 1 and Nasdaq advancers led 2,690 to 2,068, yet Nasdaq new 52-week lows (216) significantly exceeded new highs (53). Turnover of 16.11 billion shares was below its 17.10 billion 20-session average. Participation extended beyond a handful of stocks, but leadership remained concentrated enough to warrant monitoring. Reuters closing market data; AP index closes; sector ETF returns.
Institutional Flow Insight: The relative performance is consistent with investors selectively rebuilding exposure to businesses capable of translating AI capital spending into reported revenue and earnings, while discounting ad-monetization delays and telecom competitive risks. That is an inference from prices and disclosures, not verified institutional transaction data. With Treasury yields slightly higher, prospective cash-flow duration and valuation discipline still matter; neither a blanket risk-on allocation nor an October rebalancing explanation is established by the evidence.
2. Decoding the Biggest Market Movers
SpaceX (SPCX)
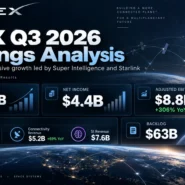
SpaceX gained 7.8% during the regular session after its October 20 third-quarter release documented $14.575 billion in revenue (+161% year over year), $2.791 billion in operating income, $4.404 billion in GAAP net income and $0.35 in diluted EPS, versus a $0.36 per-share loss a year earlier. Its Super Intelligence segment generated $7.560 billion in revenue versus $813 million a year earlier, making it the largest revenue segment; Connectivity added $5.248 billion. The critical qualification is capital intensity: quarterly capital expenditure reached $19.593 billion, exceeding reported quarterly revenue. This supports a more credible AI earnings narrative but does not by itself establish attractive free-cash-flow conversion or valuation. On the earnings call, management discussed a possible combination with Tesla, while expressly warning that no transaction had been agreed; a merger is not an established outcome. The read-through lifted Super Micro Computer (+9.6%), Dell (+5.3%) and HPE (+3.7%). Super Micro’s October 20 revenue and gross-margin update was explicitly preliminary and unaudited, not finalized earnings. Sources: SpaceX’s SEC-filed results, official earnings webcast, call transcript and Super Micro’s official preliminary update.
Netflix (NFLX)
Netflix fell 5.3% despite actual third-quarter revenue of $12.874 billion (+11.8% year over year), $0.87 in diluted EPS, a 34.6% operating margin (versus 28.2% a year earlier) and $2.884 billion of free cash flow. The valuation issue was forward execution rather than a collapse in current profitability. Netflix reduced its management outlook for 2026 advertising revenue to approximately $2.7 billion from approximately $3.0 billion, citing slower ad-product rollouts, and guided to a 26.0% operating margin for the fourth quarter. Those figures are guidance, not realized results. Management’s earnings discussion described partner integrations as a bottleneck, reinforcing the market’s focus on monetization quality. The selloff added to the Communication Services sector’s drag alongside telecom losses associated with concerns over SpaceX’s potential wireless competition. Sources: Netflix’s October 20 SEC-filed shareholder letter and earnings-call transcript.
3. Macro Indicators and Market Outlook
The Cboe Volatility Index closed at 16.68, down 0.63 point (3.64%) from 17.31 on October 20. Lower implied volatility was consistent with the equity rebound and reduced near-term demand for broad-market protection, although the index alone cannot isolate hedging flows or remove event risk. Historical VIX closing series; Cboe’s October 21 market review.
The U.S. Treasury’s October 21 indicative par yields were 4.81% for two years (+2 basis points from October 20) and 5.13% for ten years (+1 basis point). The two-year/ten-year slope was therefore positive 32 basis points, narrowing by 1 basis point on the day. The modest rise in yields argues against attributing the stock rally to easier discount rates. Front-end rates remain sensitive to Federal Reserve policy and inflation data, while the long end also reflects growth, debt-supply and term-premium considerations. One day’s change does not prove any particular future Fed decision. These are Treasury’s daily par-yield observations, not a claim about executable 4 p.m. bond prices. Official Treasury yield series.
Upcoming Economic Data & Catalysts:
- Federal Open Market Committee policy meeting (Release date: October 28, 2026): The October 27–28 meeting concludes with a policy decision; investors will assess the statement and press conference for inflation and growth risk, without presuming a change in rates.
- BEA Personal Income and Outlays, September 2026 (Release date: October 29, 2026, 8:30 a.m. ET): The report includes the PCE inflation measures and consumer-spending detail relevant to subsequent policy pricing and corporate demand assumptions. It is scheduled after the October Fed meeting.
Market Insights: This was a selective risk-on session with positive breadth but disproportionate leadership from AI-sensitive technology rather than a synchronized advance. The thesis would weaken if Treasury yields rose sharply, AI earnings or cash conversion disappointed, the Nasdaq’s weak new-high/new-low profile persisted, or implied volatility reversed higher. The post-close releases from other companies should be evaluated separately from October 21’s official 4 p.m. equity returns.
Trading & Investment Strategy: Favor position sizes consistent with portfolio volatility and liquidity limits; scale into high-conviction exposures rather than chasing earnings gaps. Differentiate infrastructure companies reporting profitable growth from those relying primarily on unfinalized projections. Diversify sector and factor risks, define exit or stop-loss levels before entry, and reassess positions if earnings revisions, rates or market breadth undermine the initial case. No single session justifies aggressive leverage.
4. Key FAQs About the US Stock Market Today
Why did the US stock market move on October 21, 2026?
Strong reported SpaceX earnings and Super Micro’s explicitly preliminary business update improved sentiment toward AI-related stocks. That outweighed Netflix’s softer advertising outlook and telecom weakness, even as Treasury yields edged up.
Which sectors performed best and worst in the US stock market on October 21, 2026?
S&P 500 Information Technology was the top-performing sector, up 1.6%, driven by AI infrastructure and semiconductor strength. Communication Services was last, down 1.3%, hurt by Netflix’s guidance and competition concerns affecting wireless carriers. These are S&P sector-index returns, not ETF returns.
What should investors watch after the US stock market close on October 21, 2026?
Watch the October 28 Fed decision, the September PCE inflation release on October 29, changes in the two-year and ten-year Treasury yields, and whether participation broadens beyond AI leaders. Subsequent earnings must validate revenue growth against margins, capital spending and free cash flow.
Disclaimer: This article is intended solely for the exchange of investment ideas and does not constitute investment advice of any kind.