


Key Takeaways
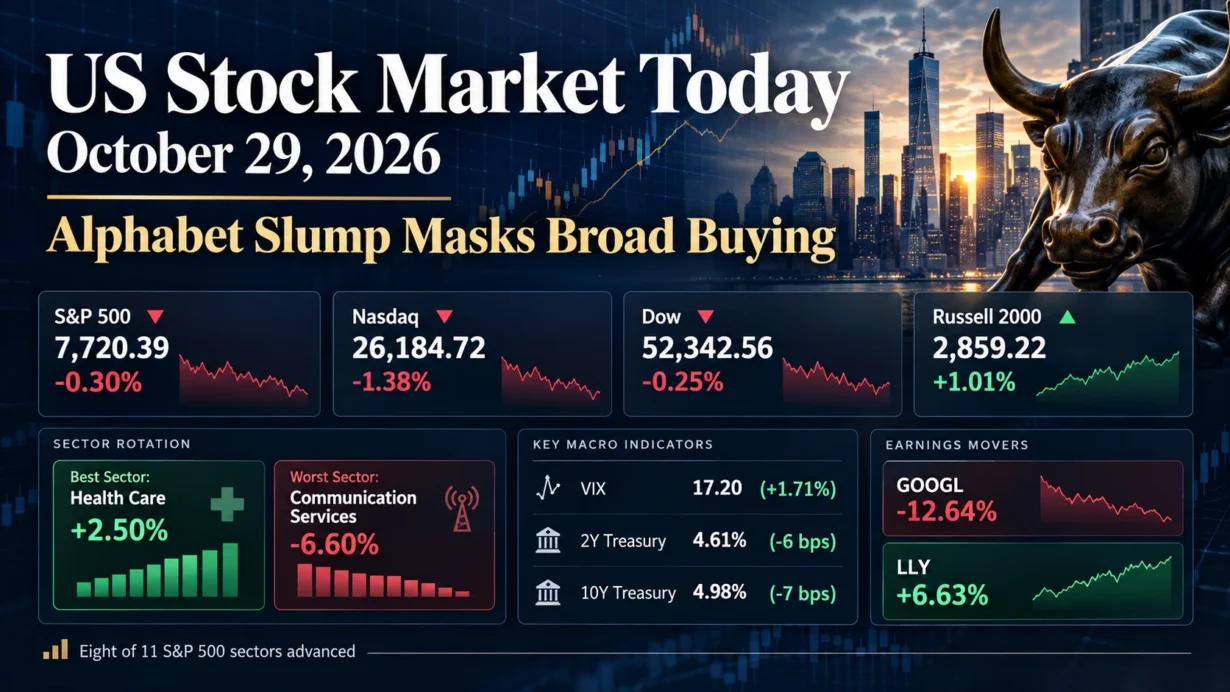
- The S&P 500 fell 0.30% to 7,720.39, the Nasdaq Composite lost 1.38% to 26,184.72, and the Dow slipped 0.25% to 52,342.56; the Russell 2000 rose 1.01% to 2,859.22 at the October 29 regular-session close.
- Eight of 11 S&P 500 sectors advanced. Health care led (+2.50%), while communication services plunged 6.60%; the equal-weight S&P 500 ETF (RSP) gained 1.20%.
- Alphabet (GOOGL) sank 12.64% as investors reassessed AI capital intensity; Eli Lilly (LLY) climbed 6.63% on strong reported sales and higher full-year revenue guidance.
- Third-quarter real GDP grew at a 3.4% annualized rate and September PCE inflation reached 3.6% year over year, yet official two- and 10-year Treasury par yields both declined.
1. Market Capital Flows and Sector Rotation:
Thursday’s index-level decline concealed a much healthier tape. Among the S&P 500 GICS sector indices, health care (+2.50%), real estate (+2.25%) and consumer staples (+1.64%) led; communication services (-6.60%), information technology (-0.88%) and consumer discretionary (-0.63%) lagged. Eight sectors finished positive. These are sector-index changes, not sector ETF returns, which can differ because of index construction and concentration limits. (Sector close data; independent sector cross-check.)
Small caps outperformed large caps: the Russell 2000 gained 1.01% while the cap-weighted S&P 500 fell 0.30%. The Invesco S&P 500 Equal Weight ETF rose 1.20%, reinforcing the breadth divergence without treating an ETF return as an index return. Financials (+1.52%) and industrials (+1.00%) participated alongside defensive health care and staples. The pattern favored diversified, rate-sensitive and value-leaning exposures over concentrated mega-cap growth; it was not a blanket retreat from cyclical risk.
Institutional Flow Insight: A plausible interpretation is that investors reduced exposure to expensive, capital-intensive AI leaders and recycled risk into businesses with clearer near-term earnings visibility. Lower Treasury yields may also have helped real estate and small caps. Potential month-end rebalancing or tighter concentration-risk budgets could amplify that rotation, but a single session’s prices cannot establish that institutions executed these trades or that value stocks universally outperformed growth stocks.
2. Decoding the Biggest Market Movers:
Alphabet (GOOGL)
Alphabet Class A shares closed at $283.82, down 12.64% in regular trading (historical closing quote). Its SEC-filed third-quarter earnings release reported revenue of $127.577 billion (+25% year over year), GAAP diluted EPS of $2.12 and a 31.8% operating margin. Google Cloud revenue rose 103% to $30.7 billion, while Google Search and other advertising revenue increased 12%. These are substantial operating gains, not evidence of a broad revenue contraction.
The valuation issue was cash conversion and the scale of AI spending: quarterly capital expenditures reached $51.355 billion against $42.290 billion in operating cash flow, producing negative free cash flow of $9.065 billion. Management’s earnings-call transcript retained its published 2026 capital expenditure guidance of $195 billion to $205 billion and flagged near-term cloud margin pressure from third-party compute capacity; Google’s official edited CEO remarks emphasized strong AI demand. The selloff is consistent with a higher discount applied to uncertain future returns on infrastructure, and Alphabet’s index weight magnified the drag on communication services and the Nasdaq. This interpretation is not proof of investors’ individual motives.
Eli Lilly (LLY)
Eli Lilly closed at $1,373.70, up 6.63% (historical closing quote). Its October 29 investor-relations release reported third-quarter revenue of $24.397 billion (+39%), GAAP EPS of $7.22, non-GAAP EPS of $7.48, and a GAAP gross margin of 83.9%. Growth was driven principally by Mounjaro and Zepbound, with volume up 53% despite a 15% decline in realized prices. The company raised 2026 revenue guidance from $85–87 billion to $91–92 billion and non-GAAP performance-margin guidance from 49.0–50.5% to 52.0–52.5%.
The guidance nuance matters: full-year non-GAAP EPS guidance moved down to $35.00–$36.00 from $35.50–$36.50 because acquired in-process R&D charges outweighed an improvement in the underlying earnings outlook. The quarter also included approximately $900 million in milestone and rebate-estimate benefits, which should not be mechanically annualized. Lilly’s earnings-call transcript provides further business context. Its advance supported health care’s leadership and highlighted investor preference for visible product demand, while leaving pricing pressure and the sustainability of elevated margins as important valuation tests.
3. Macro Indicators and Market Outlook
The Bureau of Economic Analysis advance estimate showed third-quarter real GDP growth of 3.4% annualized, versus 2.2% in the second quarter. The separate September PCE release showed headline inflation of 0.5% month over month and 3.6% year over year; core PCE rose 0.3% monthly and 3.1% annually. Strong activity alongside persistent inflation argues against treating the day’s equity rotation as an unambiguous monetary-easing trade. On October 28, the Federal Reserve held its policy range at 3.75–4.00%, with two dissenters favoring a 25-basis-point increase.
The Cboe VIX finished at 17.20, up 0.29 point (+1.71%) from 16.91 (VIX closing history). Its modest rise was directionally consistent with negative cap-weighted benchmarks, but not with a marketwide liquidation: small caps and most sectors gained. The reading suggests selective index hedging and earnings-event risk rather than, on its own, evidence of systemic stress.
On the U.S. Treasury’s official daily par yield curve, the two-year yield fell 6 basis points to 4.61% and the 10-year fell 7 basis points to 4.98% on October 29. The 10-year/2-year spread narrowed one basis point to +37 basis points. Short yields are sensitive to policy expectations, while long yields also embed growth, inflation and term-premium considerations; the joint decline does not establish any particular future Fed decision.
Upcoming Economic Data & Catalysts:
- Job Openings and Labor Turnover Survey (September 2026) (Release date: November 3, 2026, 10:00 a.m. ET): Job openings and hiring/quit dynamics will test labor-market resilience and short-end yield pricing.
- Employment Situation (October 2026) (Release date: November 6, 2026, 8:30 a.m. ET): Payrolls, unemployment and wage growth could reshape growth expectations, Fed sensitivity and equity risk appetite.
Market Insights: The October 29 selloff was driven disproportionately by concentrated mega-cap weakness, not weak participation across the market. The clearest confirmation of a durable rotation would be sustained equal-weight and small-cap leadership alongside stable earnings revisions. A reversal could come from renewed long-yield pressure, deteriorating breadth, weaker corporate guidance, policy surprises or a sustained acceleration in VIX.
Trading & Investment Strategy: Manage benchmark concentration before adding exposure; scale into diversified positions rather than chasing one-day sector winners. Favor businesses where cash generation and earnings quality support valuation, size rate-sensitive and small-cap holdings for higher volatility, and set position-specific risk limits or exit criteria before entry. Treat the next labor releases and changes in breadth as checkpoints, not guaranteed signals.
4. Key FAQs About the US Stock Market Today
Why did the US stock market move on October 29, 2026?
Alphabet’s 12.64% drop overwhelmed broader gains in the cap-weighted indexes, while Lilly supported health care. GDP growth of 3.4%, September PCE inflation of 3.6% year over year and declining Treasury yields created a mixed macro backdrop rather than a uniform risk-off move.
Which sectors performed best and worst in the US stock market on October 29, 2026?
Health care led the S&P 500 sector indices with a 2.50% gain, followed by real estate at 2.25%. Communication services was weakest, down 6.60%, heavily affected by Alphabet. Eight of 11 sectors advanced, consistent with selective deconcentration rather than indiscriminate selling.
What should investors watch after the US stock market close on October 29, 2026?
Watch the November 3 JOLTS release and November 6 employment report, the two- and 10-year Treasury yields, VIX, and whether equal-weight stocks continue to outperform cap-weighted benchmarks. Monitor AI infrastructure cash flow and earnings guidance for signs of renewed valuation pressure.
Disclaimer: This article is intended solely for the exchange of investment ideas and does not constitute investment advice of any kind.