



Key Takeaways
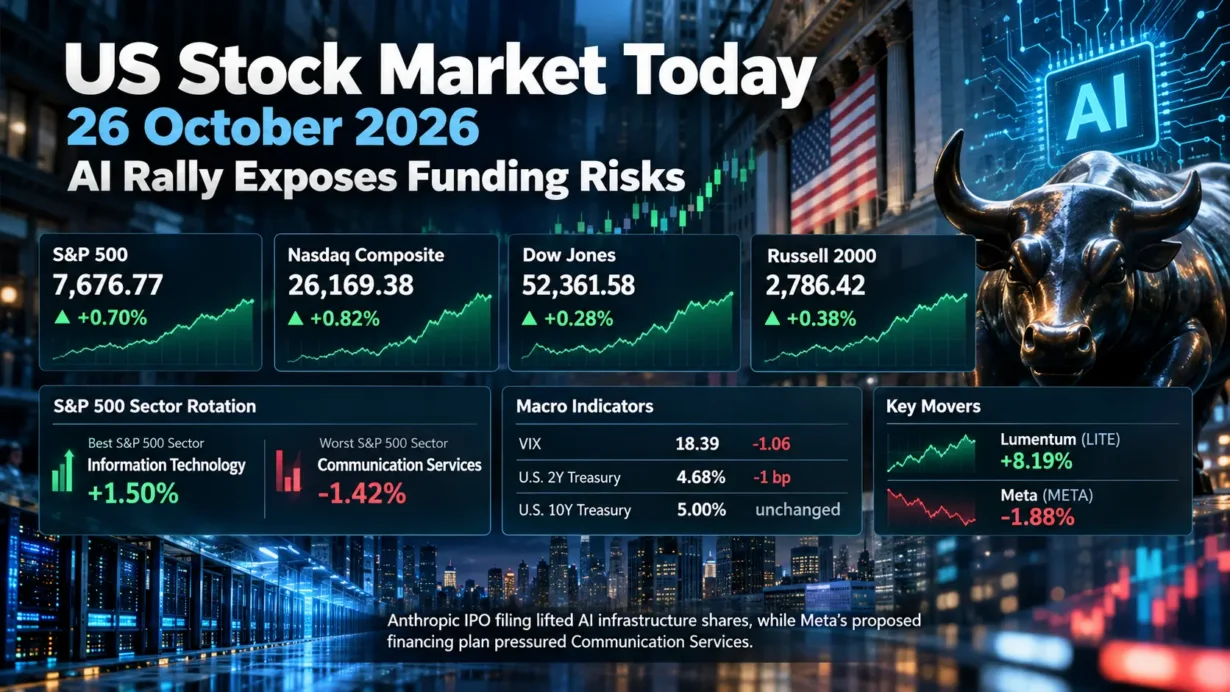
- The S&P 500 gained 0.70% to 7,676.77; the Nasdaq Composite rose 0.82% to 26,169.38; the Dow advanced 0.28% to 52,361.58; and the Russell 2000 added 0.38% to 2,786.42.
- S&P 500 information technology led at +1.50%, while communication services fell 1.42%. The equal-weight S&P 500 ETF gained just 0.35%, signaling concentrated leadership.
- Anthropic’s October 26 IPO filing revived the AI infrastructure trade. Lumentum rose 8.19%, while Meta lost 1.88% after disclosing a potential $95 billion equity-financing plan.
- The VIX closed at 18.39, down 1.06 points; the Treasury’s two-year par yield was 4.68%, down 1 basis point, and its 10-year yield held at 5.00%. The Fed decision and GDP/PCE releases remain ahead.
1. Market Capital Flows and Sector Rotation
Monday’s advance was a selective bet on AI monetization, not an indiscriminate technology rally. S&P 500 information technology gained 1.50%, the strongest of the 11 sectors, while communication services declined 1.42%, the weakest. Semiconductor strength was notable: the Philadelphia Semiconductor Index rose approximately 2.8%. Optical-networking suppliers benefited from renewed attention to the computing and connectivity requirements of advanced AI systems; large internet-platform stocks did not move together. These are S&P sector returns, not ETF returns (sector close; Reuters market report).
Large-cap, growth-oriented exposures led. The S&P 500’s 0.70% gain exceeded the Russell 2000’s 0.38%; the equal-weight S&P 500 ETF (RSP) returned 0.35%. As comparable style proxies, the iShares S&P 500 Growth ETF (IVW) gained 1.08%, versus 0.31% for its Value counterpart (IVE). Some cyclicals participated: industrials ETF XLI rose 1.42% and consumer discretionary ETF XLY rose 1.03%. Defensive ETF proxies lagged, with consumer staples XLP down 0.34% and utilities XLU down 0.02%. ETF returns are presented as style and industry proxies, not official sector-index performance (RSP; IVW; IVE; sector ETFs).
Breadth was positive but unconvincing relative to headline index gains. Advancers outnumbered decliners 1.36-to-1 on the NYSE and 1.09-to-1 on the Nasdaq; Nasdaq new 52-week lows (349) far exceeded new highs (82). Consolidated U.S. share volume was 16.7 billion, below the preceding 20-session average of 17.2 billion, according to Reuters. That combination supports a narrow-leadership reading without implying that most stocks fell.
Institutional Flow Insight: Price action is consistent with investors favoring businesses that can sell AI capacity or connectivity while scrutinizing companies financing the buildout. This is an inference from returns, not verified institutional transaction data. A 5% 10-year Treasury yield raises the hurdle rate for long-duration earnings, and elevated expectations leave little tolerance for weaker margins or equity dilution. Position trimming ahead of the Fed and month-end rebalancing may also have influenced risk budgets, but neither can be established from the tape alone.
2. Decoding the Biggest Market Movers
Lumentum Holdings (LITE)
Lumentum closed at $818.10, up 8.19% in the regular session. StoneX initiated Buy coverage on October 26, adding a stock-specific catalyst to the broader optical-infrastructure rebound following Anthropic’s S-1. Peer Coherent advanced approximately 6%, suggesting renewed investor interest in high-bandwidth photonics rather than a company-wide earnings announcement that day (analyst-coverage report).
The underlying operating evidence predates Monday. In its latest official earnings release of August 11, Lumentum reported fiscal Q4 2026 revenue of $1,006.3 million, up 109.3% year over year, a 47.4% GAAP gross margin and a 27.8% GAAP operating margin. GAAP diluted EPS was negative $84.65, primarily reflecting a $7.8 billion one-time, noncash debt-extinguishment loss; separately, non-GAAP diluted EPS was $3.23. Its published fiscal Q1 2027 revenue guidance was $1.225 billion–$1.275 billion, an outlook rather than a reported result. Management discussed 1.6T cloud modules and optical circuit switching on the August earnings call. The investment test is whether demand translates into sustained shipments and margins; an IPO filing by a separate company is not a new purchase order.
Meta Platforms (META)
Meta finished at $630.56, down 1.88%, as investors repriced the funding side of the AI trade. Its October 26 investor-relations announcement detailed approximately $35 billion of launched underwritten offerings: roughly $22.5 billion of common shares linked to forward-sale agreements and $12.5 billion of mandatory-convertible preferred depositary shares. A further $60 billion at-the-market program is contemplated, not established or executed. The often-cited $95 billion is potential financing, not cash already raised.
Meta’s latest October 21 Q3 earnings release reported $64.601 billion in revenue, up 26% year over year, GAAP diluted EPS of $3.83 and a 20% GAAP operating margin. That margin includes a $9.89 billion litigation-settlement charge and should not be read as a clean measure of recurring advertising profitability. Quarterly capital expenditures, including finance-lease principal, totaled $34.91 billion; free cash flow was negative $2.12 billion. Meta’s stated 2026 capex outlook of $135 billion–$145 billion remains guidance, not actual spending. On its official Q3 earnings-call transcript, management identified scaling its AI product, growing revenue and optimizing compute costs as priorities. The broader read-through: suppliers can benefit from AI capacity deployment even as investors demand clearer returns on capital, funding discipline and dilution protection from hyperscalers. That distinction also matters for communication-services valuations.
3. Macro Indicators and Market Outlook
The Cboe VIX settled at 18.39, down 1.06 index points, or 5.45%, from Friday’s 19.45 close. The decline aligned with higher equities and indicated lower near-term implied S&P 500 volatility, but it does not establish that institutions removed hedges or that event risk disappeared (VIX closing history).
In the U.S. Treasury’s October 26 daily par-yield series, the two-year yield stood at 4.68%, down 1 basis point from October 23, while the 10-year was unchanged at 5.00%. The 10-year minus two-year spread widened marginally from 31 to 32 basis points. These are Treasury constant-maturity par yields, not live trade prints. The essentially stable curve offers little evidence of a decisive one-day shift in Fed expectations; a 5% long yield nonetheless keeps discount-rate, inflation-persistence and term-premium risks relevant to expensive growth equities.
Upcoming Economic Data & Catalysts:
- Federal Open Market Committee policy decision (Release date: October 28, 2026, 2:00 p.m. ET): The statement and subsequent press conference will inform short-rate expectations and the market’s assessment of inflation versus growth risks.
- BEA advance Q3 2026 GDP and September 2026 Personal Income and Outlays, including PCE inflation (Release date: October 29, 2026, 8:30 a.m. ET): Actual growth, spending and inflation readings can reset real-yield assumptions, earnings expectations and the equity risk premium.
Market Insights: This was selective risk-taking, not a fully confirmed broad-market breakout. Positive exchange breadth and a falling VIX support the rebound, while equal-weight underperformance, Nasdaq new-low concentration and the Meta–Lumentum divergence expose its limits. A sharp move above the 5% 10-year yield, disappointing AI monetization, downward earnings revisions, weaker breadth, a volatility rebound or a policy surprise could reverse leadership.
Trading & Investment Strategy: Maintain position sizes consistent with portfolio drawdown limits and distinguish cash-generating AI beneficiaries from capital-intensive projects with uncertain payback periods. Favor staged entries over chasing an 8% single-session jump; diversify across sectors, reassess valuation against realized earnings and company-stated guidance, and set predetermined exit or stop-loss criteria tied to the investment thesis. Preserve liquidity ahead of the Fed and economic releases, and avoid leverage that magnifies event-driven gaps.
4. Key FAQs About the US Stock Market Today
Why did the US stock market move on October 26, 2026?
Anthropic’s verified IPO filing improved sentiment toward AI infrastructure, supporting semiconductors and optical-networking suppliers. Treasury yields were nearly flat on the official par curve, while Meta’s newly disclosed equity-financing plan restrained the broader rally. The S&P 500 rose 0.70% as investors approached a Fed decision and major earnings reports.
Which sectors performed best and worst in the US stock market on October 26, 2026?
S&P 500 information technology led with a 1.50% gain, supported by AI-related hardware demand expectations; communication services ranked last at negative 1.42%, reflecting pressure on major platform names, particularly Meta. This describes observed price leadership, not confirmed institutional fund flows.
What should investors watch after the US stock market close on October 26, 2026?
The October 28 FOMC decision and October 29 GDP and PCE releases are the next confirmed macro catalysts. Watch the 10-year Treasury yield around 5%, equal-weight participation versus capitalization-weighted gains, VIX direction and whether major technology earnings validate AI investment returns. None alone guarantees the next market move.
Disclaimer: This article is intended solely for the exchange of investment ideas and does not constitute investment advice of any kind.