


Key Takeaways
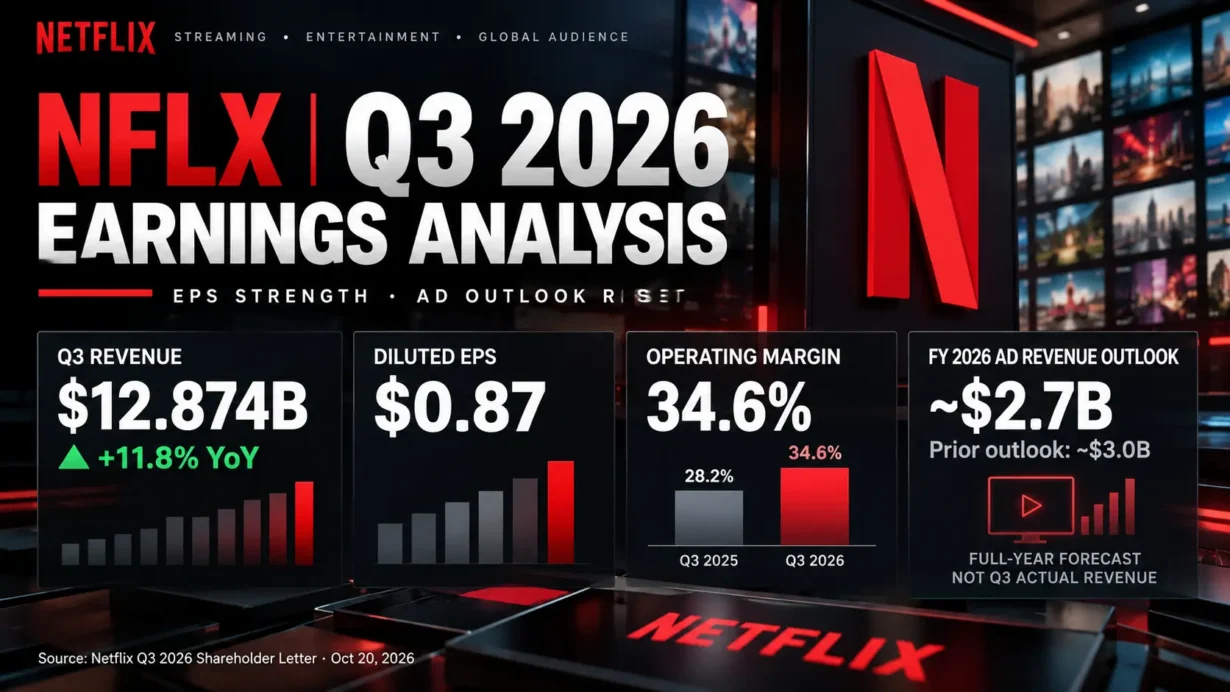
- Netflix reported Q3 2026 revenue of $12.874 billion, up 11.8% year over year, diluted EPS of $0.87, and a 34.6% operating margin. EPS and margin beat published expectations, while revenue was broadly in line.
- The decisive negative surprise was forward-looking: management lowered its 2026 advertising revenue outlook from approximately $3.0 billion to approximately $2.7 billion because some ad products and partner integrations are arriving later than planned.
- Q4 guidance of $13.442 billion in revenue and $0.67 in diluted EPS trailed contemporaneous consensus estimates of roughly $13.54 billion and $0.73, respectively.
- NFLX closed at $65.04 on October 21, down 5.31% from the pre-release regular-session close of $68.69, as investors prioritized advertising execution, U.S. content engagement, and next-quarter guidance over the backward-looking EPS beat.
- The $12.0 billion 2026 free-cash-flow outlook includes a year with a $2.8 billion one-time Warner Bros. Discovery transaction termination-fee receipt. Treating the entire outlook as recurring cash generation would overstate underlying valuation support.
The central question in the NFLX Q3 2026 earnings report is not whether Netflix can earn more on its existing subscription base. It can, and the latest results demonstrate that operating leverage remains meaningful. The harder question is how quickly its advertising technology, content slate and retention advantage can convert that scale into sustainable incremental revenue. The market’s negative response reflected disappointment in the timing and quality of future growth rather than a failure to deliver the reported quarter.
The analysis below distinguishes actual results in Netflix’s October 20, 2026 shareholder letter from third-party consensus estimates, management guidance and explicitly labeled analyst calculations. Netflix conducts a management video earnings interview rather than a traditional dial-in call; the commentary discussed below was checked against the October 20 interview transcript published by Stock Analysis and the official letter. That transcript is a third-party transcription, not a separately authenticated Netflix-issued transcript.
1. Core Earnings Breakdown
Revenue and Profitability Analysis
Q3 revenue reached $12.874 billion versus $11.510 billion a year earlier, an 11.8% reported increase or approximately 11% on Netflix’s foreign-exchange-neutral basis. Netflix attributed growth primarily to subscription revenue from membership additions and higher prices, with contributions from advertising and favorable foreign exchange effects net of hedging. It did not publish a separate Q3 revenue dollar figure or percentage split for subscriptions versus advertising; presenting one as actual company data would be misleading.
Operating income climbed to $4.459 billion from $3.248 billion, a roughly 37% improvement. The operating margin expanded to 34.6% from 28.2%, a 6.4-percentage-point increase. Net income was $3.664 billion versus $2.547 billion, while diluted EPS was $0.87 versus $0.59 on a split-adjusted basis. Q3 free cash flow, which Netflix defines as operating cash flow less property and equipment purchases, rose to $2.884 billion from $2.660 billion.
Geography is the reliable way to analyze Netflix’s disclosed quarterly revenue mix. The regional revenue shares below are analyst calculations using the exact regional and consolidated revenue figures published by the company, rather than Netflix-reported segment percentages:
- United States and Canada (UCAN): $5.628 billion, 43.72% of consolidated revenue, with 11% year-over-year growth both reported and foreign-exchange-neutral. Investment judgment: this is still the largest profit engine, making improvements in U.S. content hit rates and pricing resilience more material than an isolated emerging-market success.
- Europe, Middle East and Africa (EMEA): $4.107 billion, 31.90% of revenue, growing 11% as reported but 9% foreign-exchange-neutral. Investment judgment: the currency tailwind should not be mistaken for accelerating underlying demand; Netflix’s TF1 distribution partnership and local-language programming are important tests of engagement-led growth.
- Latin America (LATAM): $1.603 billion, 12.45% of revenue, growing 17% as reported and 12% foreign-exchange-neutral. Investment judgment: stronger reported growth than underlying constant-currency growth means the emerging advertising ecosystem, including the announced MercadoLibre partnership, matters more to future monetization than the headline rate alone.
- Asia-Pacific (APAC): $1.537 billion, 11.94% of revenue, growing 12% as reported and 15% foreign-exchange-neutral. Investment judgment: the currency headwind obscures relatively stronger organic momentum; India’s 24% year-over-year viewing-hours growth and approximately 18% foreign-exchange-neutral revenue growth illustrate what successful local content and distribution can achieve.
Regional revenue share calculations (calculated from company-reported figures): UCAN $5,628.215 million ÷ $12,874.176 million = 43.72%; EMEA $4,106.572 million ÷ $12,874.176 million = 31.90%; LATAM $1,602.603 million ÷ $12,874.176 million = 12.45%; APAC $1,536.786 million ÷ $12,874.176 million = 11.94%. Totals may differ slightly from 100% due to rounding.
The distinction between reported and recurring margin performance is important. Netflix said operating income and operating margin exceeded its own forecast chiefly because of the timing of expenses, with a smaller contribution from revenue upside. Timing benefits may reverse; they should not automatically be capitalized into a permanently higher earnings multiple. Technology and development expenditure also rose to $1.033 billion from $854 million a year ago, underscoring the cost of building future product and advertising capabilities.
Expectations vs. Actual Results
The following comparisons use Netflix’s actual financial statements, Earnings Whispers’ published consensus estimates for EPS and revenue, and S&P Global / Visible Alpha’s pre-release margin consensus. Consensus estimates are external benchmarks, not reported Netflix results, and can vary by provider or snapshot date.
- Revenue: actual $12.874 billion versus roughly $12.87 billion expected. ➖ Essentially in line; not a meaningful sales beat.
- Diluted EPS: actual $0.87 versus $0.82 expected. ✅ Beat by $0.05 per share, or about 6.1% using the displayed rounded figures.
- Operating margin: actual 34.6% versus approximately 33% Visible Alpha consensus. ✅ Beat by roughly 1.6 percentage points, with expense timing the principal explanation given by management.
- Q4 2026 revenue guidance: $13.442 billion versus approximately $13.54 billion expected. ❌ Below consensus by about $98 million.
- Q4 2026 diluted EPS guidance: $0.67 versus approximately $0.73 expected. ❌ Below consensus by $0.06 per share.
- Q4 2026 operating guidance: $3.500 billion of operating income at a 26.0% operating margin, including an approximately 120-basis-point negative effect from announced headcount reductions. No comparable independently verified Q4 margin consensus is asserted here.
- Full-year 2026 guidance: approximately $51.1 billion in revenue, a 31.5% operating margin, approximately $2.7 billion of advertising revenue, and approximately $12.0 billion of free cash flow. These are company forecasts, not historical actuals.
The EPS beat came from operating profit and margin strength, not a broad-based revenue acceleration. Lower average diluted shares also support the per-share comparison: the Q3 diluted weighted-average share count declined from 4.340 billion a year ago to 4.195 billion. This matters when separating business-level profit growth from per-share profit growth.
The greater surprise was in the forward outlook. Netflix reduced its 2026 advertising revenue forecast by approximately $300 million, from $3.0 billion to $2.7 billion, and acknowledged that several advertising product features and partner integrations were taking longer than planned. Management still described advertising demand as strong, but investors were pricing an execution risk rather than a demand collapse proven by Q3 results. The Q4 forecast also reflects a lower seasonal margin than Q3 and near-term restructuring charges. Management cited a prospective fourth-quarter real-estate transaction as the primary reason for lowering full-year free-cash-flow guidance from $12.5 billion to approximately $12.0 billion; that change should not be incorrectly attributed to the advertising shortfall.
NFLX fell from its October 20 regular-session close of $68.69 to $65.04 at the October 21 close, a decline of 5.31%, according to the dated market quotation. This price action is consistent with investors emphasizing advertising monetization, the U.S. content pipeline, fourth-quarter earnings and the durability of margin expansion. It is not adequately explained as a generic “sell the news” reaction. Nor is current acquisition-related dilution a satisfactory explanation: the proposed Warner Bros. Discovery transaction terminated earlier in 2026, producing a termination-fee receipt rather than closing into a new equity-funded combination.
Earnings Call Highlights
The statements below accurately paraphrase management’s reported October 20 video interview; they are not presented as verbatim quotations. Each interpretation is an investment inference, not a company forecast.
- Ted Sarandos, co-CEO: roughly 95% of spending and nearly all revenue remain tied to the core business of professionally produced film, television and live entertainment; third-party licensing complements Netflix originals. 💡 Reading Between the Lines: Management is resisting pressure to pursue every adjacent format at scale. The valuation thesis still depends on better returns on core programming and distribution, while games and experimental formats should carry limited modeled economic value until proven.
- Greg Peters, co-CEO: churn improved year over year globally and in the U.S., and customer responses to 2026 price changes were consistent with past experience and expectations. 💡 Reading Between the Lines: Subscription pricing power can sustain revenue even when aggregate viewing-hours growth is modest. But management did not supply a numerical churn rate or a Q3 advertising monetization rate, so investors cannot independently quantify how much pricing headroom remains.
- Greg Peters, co-CEO: the advertising business is still growing more than 80% in 2026, but product rollouts and partner integrations are behind the company’s aggressive plan; the gap between ad-tier monetization and the standard plan is narrowing. 💡 Reading Between the Lines: The near-term constraint is execution in ad technology and yield optimization, not necessarily a shortage of viewers. The key modeling question is whether improved targeting, measurement, formats and fill rates can close the average-revenue-per-membership gap without damaging the subscriber experience.
- Ted Sarandos, co-CEO: U.S. content execution can improve, and incoming Chief Content Officer Peter Rice is intended to increase the number of major hits with global reach; the core strategy itself is not being replaced. 💡 Reading Between the Lines: This is a creative-return-on-investment initiative rather than a commitment to indiscriminately increase content spending. It also highlights leadership-transition risk: future results will depend on the success of programming decisions whose payoffs are inherently difficult to forecast.
- Spence Neumann, CFO: double-digit revenue growth, annual margin expansion and rising free cash flow remain long-term objectives, but quantified 2027 guidance will not arrive until the January 2027 results call. 💡 Reading Between the Lines: Investors should not treat headcount reductions as a promise that all savings will flow directly to the bottom line. Management intends to redeploy resources toward high-impact initiatives, making the balance between reinvestment and margin expansion the critical 2027 question.
2. Deep Business Insights
Hidden Metrics That Matter
- Advertising’s 10% target reset has outsized strategic significance relative to its revenue weight. The reduction in the 2026 ad-revenue outlook is ($3.0 billion − $2.7 billion) ÷ $3.0 billion = 10.0%. Moreover, $2.7 billion ÷ $51.1 billion = approximately 5.3% of the company’s forecast 2026 revenue. Both ratios are calculated from company-reported figures, specifically its forward guidance rather than realized annual results. Advertising remains a relatively small contributor to total revenue, yet it is central to the argument for faster future monetization and improved growth at mature-market penetration levels. The business is not valued solely on the current ad-revenue percentage; investors also value the possibility of stronger yield and revenue per member over time. Netflix says its ad tier is still monetized below the standard plan on a combined subscription-plus-advertising average revenue per membership basis, although that gap has narrowed. It has not disclosed a numerical gap in the Q3 letter or interview. An unsupported estimate of the gap would turn a legitimate investment insight into false precision.
- Cash-flow quality matters more than the headline forecast suggests. Netflix guided to approximately $12.0 billion in 2026 free cash flow, but its SEC-filed June 2026 Form 10-Q confirms that it received a $2.8 billion one-time termination fee in the first quarter and included that receipt in operating cash flow. A mechanical calculation of $12.0 billion − $2.8 billion = $9.2 billion offers a useful recurring-cash-flow sensitivity, not an official normalized forecast. It ignores taxes attributable to the receipt, other unusual cash movements and the timing of working capital, so it should not be treated as an exact adjusted free-cash-flow figure. There is also a capital-allocation check: Netflix repurchased $4.8 billion of shares in Q3 against $2.884 billion of Q3 free cash flow. The repurchase-to-FCF ratio is $4.8 billion ÷ $2.884 billion = approximately 1.66 times, calculated from company-reported figures. Quarterly buybacks can exceed quarterly cash generation without implying distress, particularly where existing cash balances and future cash flows are available, but that pace cannot be assumed to recur indefinitely without considering debt, content obligations and liquidity. Netflix ended Q3 with approximately $15.3 billion of gross debt, $8.2 billion of cash and cash equivalents, and $25.2 billion of total streaming content obligations, including off-balance-sheet commitments.
Why do customers and content partners continue to choose Netflix? For viewers, the appeal is a continually refreshed selection of exclusive and licensed programming, local-language hits, live events, familiar discovery tools and a service accessible across markets and devices. For studios and broadcasters, Netflix offers distribution to an audience approaching one billion people, an established interface for content discovery, monetization reach and the potential to renew awareness of existing intellectual property. The company specifically cited incremental viewing from its TF1 partnership in France and broader distribution benefits for licensed Disney titles. The approximately one-billion figure refers to audience reach, not a disclosed count of paid subscriptions.
Industry Chain Reactions
- ✅ Potential beneficiary — The Walt Disney Company (NYSE: DIS). Netflix’s new licensing deal for Disney programming, including the five Ice Age films, creates a distribution and licensing opportunity while putting the franchise in front of a large audience ahead of a future theatrical release. Management explicitly characterized these arrangements as beneficial to both parties. The actual license economics and incremental Disney earnings contribution were not disclosed; a measurable DIS earnings uplift should not be assumed.
- ❌ Potential competitive pressure — Roku, Inc. (NASDAQ: ROKU). As Netflix builds its own advertising technology and adds programmatic access, it increases competition for connected-TV brand advertising budgets and campaign measurement relationships. That could pressure alternative CTV advertising inventory and platforms if spend shifts toward Netflix. This is a competitive scenario, not an observed loss of Roku revenue attributable to this report, and Roku could also benefit from continued distribution and overall CTV adoption.
The industry implication is not simply that streaming companies are competing for subscribers. Netflix is simultaneously a buyer of programming, a licensed-content distributor, a television advertising seller and a platform that can offer partners both reach and first-party product integration. Suppliers may be competitors in one line of business and commercial partners in another.
Valuation Framework and Key Risks
At the October 21, 2026 closing price of $65.04, Stock Analysis reported an equity market capitalization of approximately $270.82 billion, trailing EPS of about $3.45 and a trailing P/E of roughly 18.8 times. That P/E requires a material adjustment in interpretation: the rolling twelve-month earnings include the first-quarter 2026 $2.8 billion pre-tax Warner Bros. Discovery termination fee. The fee is a real receipt, but it is not recurring operating profit. A low-looking historical P/E therefore does not, on its own, establish a low valuation for Netflix’s sustainable business.
Cash-flow yield offers a different perspective. Using the reported $270.82 billion equity value and the company’s $12.0 billion 2026 free-cash-flow forecast gives $12.0 billion ÷ $270.82 billion = approximately 4.43%, or an equity value of about 22.6 times guided free cash flow. Illustratively removing the $2.8 billion termination-fee receipt gives $9.2 billion ÷ $270.82 billion = approximately 3.40%, or about 29.4 times the mechanically adjusted figure. These are analyst calculations combining market data and company-reported figures; the second scenario is not Netflix guidance, not tax-normalized, and not a definitive intrinsic valuation. The gap highlights how easily an unusually strong reported cash-flow year can conceal the multiple being paid for recurring operations.
A sensible framework therefore separates what must be demonstrated from what may already be reflected in price:
- Constructive case: stable churn after price increases, stronger U.S. hit rates, successful delivery of delayed advertising capabilities, rising ad-tier yield and improved recurring free cash flow would support a higher-quality growth profile.
- Balanced case: low-double-digit revenue growth and gradual margin improvement remain plausible operating objectives, but the current advertising timetable and content-execution challenges require evidence before assigning a premium multiple.
- Downside case: prolonged U.S. viewing stagnation, weaker advertising monetization, higher content investment without commensurate hits, or renewed spending after restructuring could compress recurring margins and valuation simultaneously.
Watch four indicators in subsequent releases: U.S. engagement and retention following price changes; measurable improvement in advertising yield and rollout execution as the ad tier expands into 15 additional countries in 2027; margin performance after Q4’s roughly 120-basis-point restructuring impact; and cash-flow conversion excluding exceptional transaction-related receipts. Netflix’s stated full-year cash content spend-to-amortization ratio of approximately 1.1 times also merits monitoring, because content investment is a real economic cash commitment even when the expense appears gradually through amortization.
The conclusion is deliberately conditional. NFLX’s lower share price reduces the valuation hurdle, but the earnings release does not prove that the advertising bottleneck has been resolved or that headline free cash flow is fully repeatable. Future returns depend on the conversion of scale, pricing power and programming success into sustainable cash generation—not on this quarter’s EPS surprise alone.
3. Key FAQs
Why did NFLX stock fall after Netflix beat Q3 2026 EPS expectations?
Netflix earned $0.87 per diluted share against a published consensus of approximately $0.82, but it lowered 2026 advertising revenue guidance to about $2.7 billion from $3.0 billion and guided Q4 revenue and EPS below consensus. Concerns about U.S. content execution and how quickly ad products will launch added to the disappointment. NFLX closed at $65.04 on October 21, 2026, down 5.31% from the previous session.
What were Netflix Q3 2026 revenue, EPS and operating margin, and what is its Q4 2026 guidance?
For Q3 2026, Netflix reported revenue of $12.874 billion, diluted EPS of $0.87 and a 34.6% operating margin, alongside $4.459 billion of operating income. For Q4 2026, management forecast revenue of $13.442 billion, diluted EPS of $0.67, operating income of $3.500 billion and a 26.0% operating margin. Q4 figures are management forecasts, not achieved results.
Is NFLX stock cheap after Q3 2026 earnings, and how does the $2.8 billion breakup fee affect valuation?
At the October 21 close of $65.04, the trailing P/E was about 18.8 times, but trailing profit includes the nonrecurring $2.8 billion pre-tax termination fee recorded in Q1 2026. The company’s approximately $12.0 billion free-cash-flow forecast likewise belongs to a year that benefited from that receipt. A simple, explicitly non-company sensitivity subtracting $2.8 billion gives approximately $9.2 billion before tax and timing adjustments. Whether NFLX is undervalued depends on investors’ assessment of sustainable content economics, advertising execution and recurring cash-flow growth rather than on the unadjusted P/E alone.
Sources and verification: Netflix’s official Q3 2026 shareholder letter and financial statements; Netflix Investor Relations and the October 20 earnings interview listing; third-party earnings interview transcript; S&P Global pre-earnings margin consensus; Earnings Whispers estimates; Netflix’s SEC Form 10-Q on the termination fee; and dated NFLX market quotation. Official company filings and statements should take precedence over third-party transcriptions and estimates.
Disclaimer: This article/chart is for educational and informational purposes only and does not constitute investment advice of any kind. Past performance is not indicative of future results. Investors should independently evaluate their own risks.