

Key Takeaways
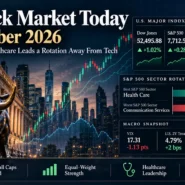
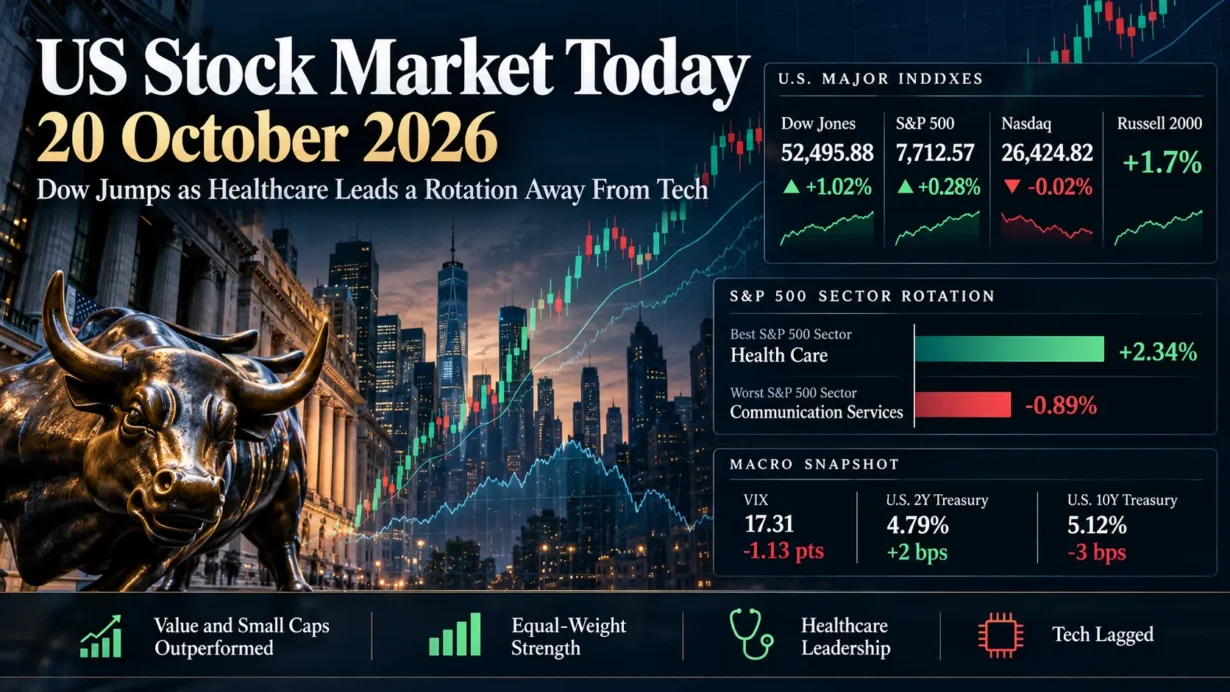
- The Dow gained 1.02% to 52,495.88, the S&P 500 advanced 0.28% to 7,712.57, and the Nasdaq Composite slipped 0.02% to 26,424.82. The Russell 2000 rose approximately 1.7%.
- Healthcare led the S&P 500’s 11 sectors, up 2.34%; communication services lagged, down 0.89%. Value and equally weighted stocks outperformed capitalization-weighted growth exposure.
- September pending home sales fell 7.3% month over month, while preliminary housing starts declined 5.2%, highlighting the economy’s sensitivity to financing costs.
- The VIX finished at 17.31, down 1.13 points. The Treasury’s two-year yield rose 2 basis points to 4.79%, while its 10-year yield fell 3 basis points to 5.12%.
1. Market Capital Flows and Sector Rotation
October 20 was a rotation session rather than a conventional megacap-led rally. Healthcare (+2.34%) was the strongest S&P 500 sector, helped by major drugmakers and managed-care names, while communication services (-0.89%) was the weakest as Meta, Alphabet and Netflix declined. Real estate (+1.7%), utilities (+1.2%) and financials (+1.0%) also advanced; information technology fell about 0.3%, becoming the largest drag on the capitalization-weighted S&P 500. The divergence points to a market paying more for current earnings resilience and less for long-duration growth expectations. Sources: Reuters’ final closing report and sector performance data.
The S&P 500 value index rose 0.9% versus a 0.2% decline in its growth counterpart, and small caps outpaced large-cap benchmarks. The Invesco S&P 500 Equal Weight ETF (RSP), a tradable proxy rather than the equal-weight index itself, gained 1.15% versus the S&P 500’s 0.28%. NYSE advancers outnumbered decliners 2.04 to 1, a stronger underlying picture than the nearly flat Nasdaq suggested. Still, 15.91 billion shares traded across U.S. exchanges, below the 20-session average of 17.15 billion; broader participation did not come with unusually heavy aggregate volume. Sources: RSP historical close and Reuters market breadth and volume.
Institutional Flow Insight: The price action is consistent with, but does not prove, portfolio risk being redistributed away from richly valued, capital-intensive AI franchises toward healthcare, established cash generators and selected interest-rate-sensitive businesses. A softer 10-year Treasury yield improved the relative appeal of real estate and utilities, while solid company-specific execution supported some cyclicals. However, the two-year yield rose and housing activity weakened; the move should not be mistaken for a verified wave of institutional inflows or an unqualified cyclical recovery. Valuation concentration, earnings visibility and risk-budget discipline offer more convincing explanations than an assumed policy pivot.
2. Decoding the Biggest Market Movers
3M (MMM)
3M closed at $171.37, up 5.78%. Its official third-quarter release reported $6.6 billion of GAAP revenue (+1.0% year over year), GAAP EPS of $2.63 and a 23.7% GAAP operating margin. On the company’s revised non-GAAP basis, adjusted EPS was $2.50, adjusted organic sales grew 3.3% and adjusted operating margin reached 26.2%, up 110 basis points year over year. Management raised its 2026 adjusted EPS guidance to $9.10–$9.15. The adjusted presentation now excludes intangible-asset amortization, so the accounting definition matters when comparing profitability.
The deeper catalyst was an expanded Amazon data-center relationship. A 3M SEC Form 8-K specifies warrants for up to 3,162,015 shares, with 85% of the warrants vesting against cumulative payments for optical-connectivity and other data-center products, reaching full vesting of that tranche at $6 billion. This is a milestone, not $6 billion of guaranteed purchases: CEO Bill Brown explicitly said there were no minimum volume commitments in a third-party transcript of the October 20 earnings call. For industrials, the investment implication is selective: demonstrable exposure to AI infrastructure and improving margins can support a rerating, but future orders, scale-up economics and dilution risk still require scrutiny. Verified regular-session share close.
General Motors (GM)
GM closed at $77.09, down 6.84%, despite solid reported results. Its official third-quarter materials showed approximately $50.0 billion in revenue, $4.1 billion in adjusted EBIT, adjusted diluted EPS of $3.70 and an 8.7% North American adjusted EBIT margin. GM narrowed full-year adjusted EBIT guidance to $14.5 billion–$15.5 billion from $14 billion–$16 billion, leaving the $15 billion midpoint unchanged; it also raised adjusted automotive free-cash-flow guidance to $11.5 billion–$12.5 billion and authorized a new $20 billion multiyear buyback. The share-price selloff therefore should not be described as a cut to the full-year EBIT midpoint.
Investors instead appeared to discount the durability of future margins. According to a third-party transcript of the October 20 earnings call, management identified rising steel, copper, logistics and memory-chip costs, including an estimated $400 million of incremental 2026 inflation-related expense, mostly in the fourth quarter. It also projected roughly 35,000 fewer full-size pickup units in the fourth quarter during a model changeover. These are management estimates, not realized outcomes. GM’s weakness, even alongside a stronger value index, illustrates why automakers may command a higher risk discount than industrial suppliers with improving near-term margins and clearer incremental demand. Verified regular-session share close.
3. Macro Indicators and Market Outlook
The Cboe VIX closed at 17.31, down from 18.44 on October 19, a decline of 1.13 points or 6.13%. Lower implied S&P 500 volatility was directionally consistent with stronger equity breadth and less immediate demand for index-option protection, even as the Nasdaq slipped. It does not establish that investors removed hedges or that geopolitical and earnings-event risk disappeared. Source: VIX historical closing data.
The U.S. Treasury’s official daily par-yield data show the two-year yield at 4.79% (+2 basis points) and the 10-year at 5.12% (-3 basis points). The 10-year/two-year spread narrowed from 38 to 33 basis points. This curve flattening is consistent with continued near-term policy and inflation sensitivity alongside some relief at the long end, potentially reflecting growth concerns or changing term-premium demand. One session’s yield moves cannot identify the relative contribution of each force or establish a specific Federal Reserve rate decision.
Housing offered a tangible growth warning: the National Association of Realtors reported a 7.3% September drop in pending home sales, while the Census Bureau reported a preliminary 5.2% drop in housing starts to a 1.221 million annualized pace. The starts estimate carries substantial sampling uncertainty. Together, the data reinforce the sensitivity of rate-dependent demand even as lower long-term yields aided listed real estate shares. Oil also retreated from an intraday five-month high amid conflicting Middle East developments, limiting a simple energy-led inflation narrative.
Upcoming Economic Data & Catalysts:
- Federal Open Market Committee policy decision (Release date: October 28, 2026): The Fed’s scheduled October 27–28 meeting will put the policy statement and Chair’s remarks in focus; inflation persistence, growth risks and the reaction of the short end of the yield curve matter more than a presumed rate move.
- U.S. Personal Income and Outlays, September 2026 (Release date: October 29, 2026): The BEA’s scheduled release includes PCE inflation and consumer spending, with implications for real yields, earnings assumptions and the relative appeal of growth versus defensive equities.
Market Insights: The session reflected genuinely broader participation, not a narrow megacap surge: positive NYSE breadth, an outperforming equal-weight ETF and small-cap strength contrast with a nearly flat Nasdaq. The durability test is whether that participation survives the next inflation and Fed catalysts. An abrupt rebound in long-term yields, renewed oil-price shocks, downward earnings revisions, weaker advance-decline breadth or a renewed VIX jump could reverse the rotation. Continued weakness in megacap earnings expectations would also constrain the capitalization-weighted index.
Trading & Investment Strategy: Favor diversified, sized positions over chasing a single strong session. Stagger entries, distinguish documented earnings improvement from uncommitted future sales, and balance defensive cash-flow franchises with selectively profitable cyclicals rather than relying exclusively on high-multiple growth. Define portfolio drawdown limits and position-level exit criteria before entering trades; account for overnight earnings gaps and potential slippage, which can make stop orders execute away from intended levels. Reassess exposures if Treasury yields, market breadth or forward margin assumptions deteriorate.
4. Key FAQs About the US Stock Market Today
Why did the US stock market move on October 20, 2026?
Healthcare leadership, relative strength in value and small caps, and a decline in the 10-year Treasury yield offset pressure on megacap technology. Weak housing indicators complicated the growth outlook, while earnings rewarded 3M’s improving profitability and exposed concerns about GM’s future cost base.
Which sectors performed best and worst in the US stock market on October 20, 2026?
Healthcare led the S&P 500 with a verified 2.34% gain. Communication services fell 0.89%, the weakest sector, as large internet and media constituents weighed on the group. The contrast reflected a preference for earnings resilience over concentrated megacap exposure, not a confirmed measurement of fund flows.
What should investors watch after the US stock market close on October 20, 2026?
Monitor whether equal-weight and small-cap outperformance persists, the 10-year Treasury yield and VIX for renewed stress, and upcoming corporate margin commentary. The scheduled October 28 FOMC decision and October 29 PCE-related BEA release are the next major official macro checkpoints.
Disclaimer: This article is intended solely for the exchange of investment ideas and does not constitute investment advice of any kind.