


Key Takeaways
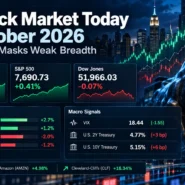
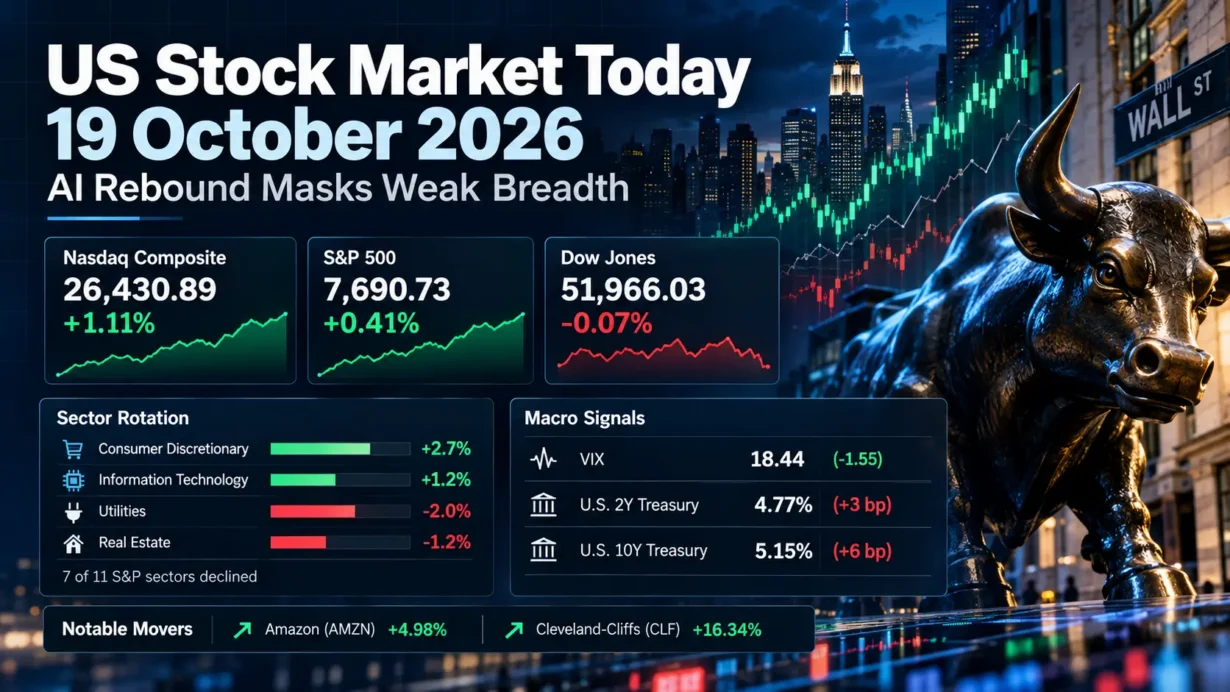
- The Nasdaq Composite rose 1.11% to 26,430.89 and the S&P 500 gained 0.41% to 7,690.73, while the Dow Jones Industrial Average slipped 0.07% to 51,966.03 in Monday’s regular session.
- Consumer discretionary (+2.7%) and information technology (+1.2%) led, but seven of 11 S&P 500 sectors declined; utilities (-2.0%) and real estate (-1.2%) lagged.
- Amazon jumped 4.98% after a favorable Morgan Stanley call. Cleveland-Cliffs surged 16.34% following its officially released third-quarter results and management outlook.
- The Cboe VIX fell to 18.44, yet Treasury yields rose. September headline CPI was 3.7% year over year, keeping inflation and discount-rate risks relevant. Sources: Reuters, Cboe, and BLS.
1. Market Capital Flows and Sector Rotation
Monday’s index advance was a concentrated recovery in established growth franchises, not a wholesale return to risk. Consumer discretionary gained 2.7%, driven heavily by Amazon and Tesla (+3.8%), while information technology added 1.2%. The Philadelphia Semiconductor Index advanced 1.6%, ending an eight-session losing streak. Utilities lost 2.0% and real estate fell 1.2%. These rate-sensitive, income-oriented segments struggled even as technology recovered. The Russell 2000 gained about 0.3%, trailing the Nasdaq’s 1.11% rise; one steelmaker’s rally did not establish leadership for small caps, cyclical stocks or value stocks collectively. Source: Reuters closing report; AP Russell 2000 close.
Market breadth contradicted the headline index gains: seven of 11 S&P 500 sectors finished lower, and NYSE declining issues outnumbered advancers by 1.69 to 1. Nasdaq decliners led 2,647 to 2,258. U.S. exchange volume totaled 15.27 billion shares, below the prior 20-session average of 17.26 billion. The implication is material: cap-weighted benchmarks recovered without comparable confirmation from the median listed stock. Source: Reuters.
Institutional Flow Insight: The cross-section is consistent with a selective reallocation toward liquid companies with more visible earnings and away from long-duration dividend substitutes; it does not prove institutional net buying. Last week’s pressure on AI-infrastructure financing may also have left crowded semiconductor positions vulnerable to a technical rebound. Elevated yields increase the hurdle for both expensive growth multiples and leveraged property assets, so today’s winners should not be mistaken for evidence that discount-rate risk has disappeared. No verified fund-flow series establishes quarter-start rebalancing as the cause.
2. Decoding the Biggest Market Movers
Amazon.com (AMZN)
Amazon finished the regular session at $262.45, up 4.98%, after Morgan Stanley named it a top pick and raised its price target to $350 from $335. That price target is an analyst opinion, not Amazon’s guidance. The fundamental case rests on actual operating data: Amazon’s latest published earnings release, for Q2 2026, reported consolidated sales of $200.6 billion, up 20% year over year. AWS generated $42.2 billion in revenue, up 37%, and $16.6 billion in operating income, representing a 39.4% segment operating margin. However, Amazon also reported a $7.6 billion trailing-12-month free-cash-flow outflow, primarily reflecting investment in AI-related property and equipment. This distinction matters: strong cloud profitability supports the megacap premium, but heavy infrastructure spending complicates near-term cash-conversion and valuation analysis. Amazon’s weight helped propel consumer discretionary and the cap-weighted benchmarks; the move alone says little about the health of smaller retailers. Sources: regular-session close, market catalyst, and Amazon investor-relations earnings release.
Cleveland-Cliffs (CLF)
Cleveland-Cliffs closed at $14.10, up 16.34%, after reporting Q3 2026 revenue of $5.612 billion versus $5.226 billion in Q2. GAAP net income was $165 million, with diluted EPS of $0.26; adjusted EPS was $0.28. Adjusted EBITDA improved to $612 million from $286 million in Q2, while the average steel selling price increased to $1,177 per net ton from $1,124. Management’s official forward-looking guidance called for approximately $715 million in Q4 adjusted EBITDA; its conditional 2027 outlook exceeded $4 billion, dependent partly on contract terms and steel-price assumptions. Neither number is a realized result. The investment signal is operating leverage to domestic steel pricing and better utilization, not an automatic read-through to every industrial or value stock. Trade-policy protection may help domestic producers, but cyclical demand, input costs and the durability of pricing remain central valuation risks. Sources: regular-session close, official Q3 release, and official earnings webcast and financial materials.
3. Macro Indicators and Market Outlook
The Cboe VIX closed at 18.44, down 1.55 points, or 7.75%, from 19.99. Falling implied S&P 500 volatility was directionally consistent with the Nasdaq’s rebound and suggested reduced near-term demand for index-option protection. However, a lower VIX does not resolve the negative breadth or financing risks beneath the index.
In the U.S. Treasury’s official daily par-yield series, the two-year yield reached 4.77%, up 3 basis points from Friday, and the 10-year yield reached 5.15%, up 6 basis points. The 10-year minus two-year spread widened to 38 basis points from 35. This modest bear steepening is consistent with some combination of inflation persistence, term-premium pressure and growth expectations, not a definitive prediction of the Federal Reserve’s next move. The latest BLS September CPI report showed headline inflation of 3.7% year over year and core inflation of 2.6%, reinforcing sensitivity to incoming data.
Energy added a distinct cross-asset risk: U.S. crude futures settled up 2.2% at $103.66 per barrel amid renewed Middle East security concerns. Sustained oil strength could make the inflation and discount-rate backdrop more difficult for rate-sensitive equities, even if selected AI stocks continue to rebound. Source: Reuters.
Upcoming Economic Data & Catalysts:
- September 2026 New Residential Construction (Release date: October 20, 2026, 8:30 a.m. ET): Housing starts and building permits will test interest-rate-sensitive activity and may affect homebuilder expectations and the Treasury market. Official U.S. Census Bureau schedule.
- Federal Open Market Committee policy decision (Release date: October 28, 2026; meeting October 27-28): Investors will examine the statement and accompanying communication for the balance between inflation control and growth risks, without presuming a particular rate action. Official Federal Reserve calendar.
Market Insights:
The session looks more like a heavyweight-led rebound than a durable, broad-based advance. For confirmation, watch whether advancing issues regain the lead, semiconductors sustain participation beyond a one-day reversal, and smaller companies begin to close the performance gap. A renewed rise in yields, downward earnings revisions, a policy surprise or another volatility spike could quickly challenge expensive AI-linked valuations.
Trading & Investment Strategy:
Use risk budgets rather than index momentum as the sizing anchor. Consider staged entries into businesses with demonstrated cash generation, keep sector and single-name concentrations within predetermined limits, and avoid chasing a sharp post-upgrade or post-earnings gap. Set position-specific exit or review levels before entry, reassess them as volatility and liquidity change, and maintain enough liquidity to respond if breadth or earnings guidance deteriorates. No single session warrants abandoning valuation discipline.
4. Key FAQs About the US Stock Market Today
Why did the US stock market move on 19 October 2026?
AI-related technology rebounded after the prior week’s selloff, with Amazon’s analyst-driven rally lifting major cap-weighted indexes. Higher Treasury yields, oil-driven inflation concerns and weak market breadth kept the Dow and most S&P 500 sectors under pressure.
Which sectors performed best and worst in the US stock market on 19 October 2026?
Consumer discretionary (+2.7%) and information technology (+1.2%) led, supported by Amazon, Tesla and semiconductors. Utilities (-2.0%) and real estate (-1.2%) were the weakest, reflecting pressure on rate-sensitive and income-oriented equities. These are sector returns, not verified institutional fund-flow totals.
What should investors watch after the US stock market close on 19 October 2026?
The October 20 housing release and October 28 FOMC decision are the next officially scheduled macro catalysts. Between them, track the two- and 10-year Treasury yields, semiconductor earnings, VIX behavior and whether market breadth begins to confirm the Nasdaq’s recovery.
Disclaimer: This article is intended solely for the exchange of investment ideas and does not constitute investment advice of any kind.