

Key Takeaways
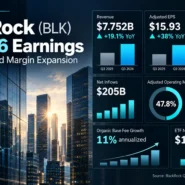
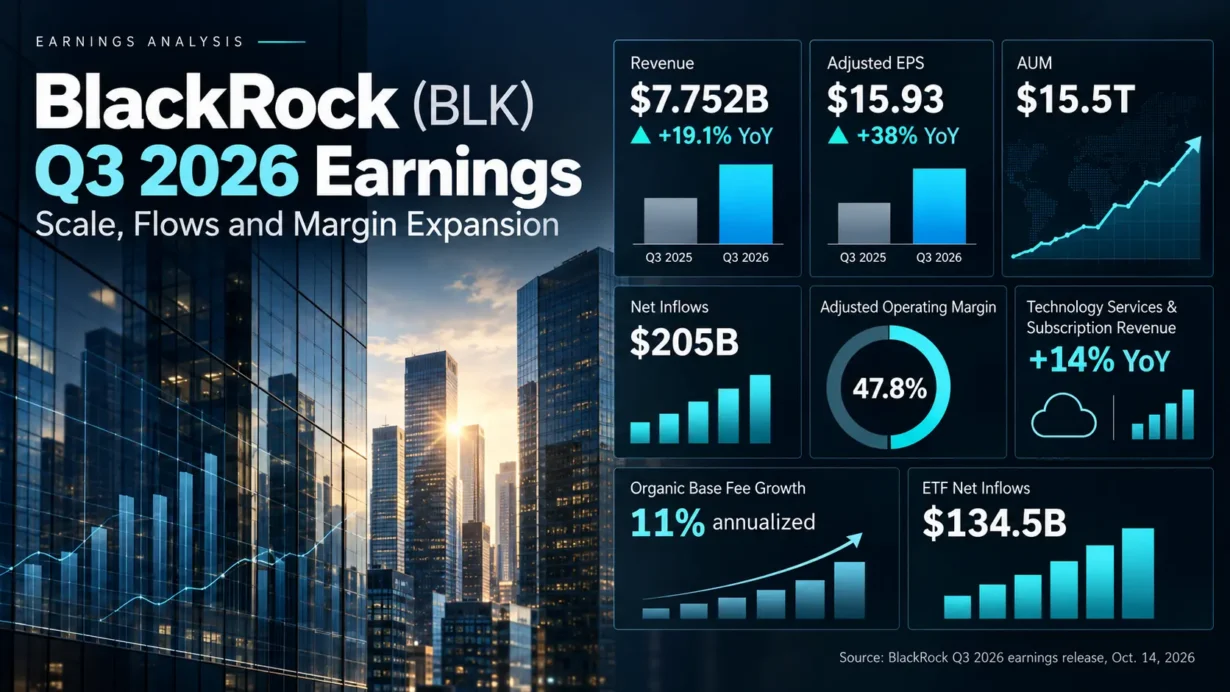
- BlackRock reported $7.752 billion of third-quarter revenue, up 19.1% year over year; adjusted diluted EPS rose 38% to $15.93, while GAAP diluted EPS was $10.57.
- Quarterly net inflows reached $205.466 billion, including $134.509 billion into ETFs. Organic base-fee growth was 11% on an annualized quarterly basis, a more revealing indicator of underlying commercial momentum than market-driven AUM appreciation.
- Adjusted operating margin expanded to 47.8%, up 320 basis points year over year, but the GAAP operating margin remained 30.0%. The two measures use different adjustments and revenue denominators.
- Private markets generated 11% of BlackRock’s base fees and securities-lending revenue from roughly 2% of reported AUM. Separately, $96 billion of private-markets AUM was not yet earning fees, making deployment timing critical.
- BLK closed at $1,120.78 on October 15, 2026, approximately 20.2 times the latest four quarters’ reported adjusted EPS. The valuation depends on durable higher-fee inflows, recurring operating leverage and disciplined private-credit execution.
BlackRock (NYSE: BLK) released its third-quarter 2026 results on October 14, 2026, for the period ended September 30. The headline beat was substantial, but the investment debate is more nuanced: how much of the earnings improvement is durable, how quickly private-market commitments become fee-paying assets, and whether Aladdin, iShares and BlackRock’s capital-markets relationships can justify the stock’s valuation through a less favorable market cycle.
Data discipline matters here. Reported figures and reconciliations below come from BlackRock’s official earnings release and its SEC-filed earnings supplement. BlackRock’s Investor Relations event page provides the official conference-call webcast, but no official written transcript was located there as of this review; the call commentary is therefore accurately paraphrased from the published October 14 call transcript and checked against company-reported figures. Consensus estimates and share prices are explicitly attributed to independent sources rather than presented as company disclosures.
1. Core Earnings Breakdown
Revenue and Profitability Analysis
Total GAAP revenue reached $7.752 billion, compared with $6.509 billion in Q3 2025, an increase of $1.243 billion, or 19.1%. Average assets under management were $15.460 trillion, up 19% year over year, while period-end AUM rose 15% to $15.488 trillion. The distinction is important: higher market levels supported asset-based billing, but the quarter also produced meaningful new-client fee growth and incremental revenue from the acquired private-markets platform.
BlackRock reports revenue by fee category rather than as fully separate iShares, private-markets and technology operating segments. The following shares refer to consolidated quarterly revenue; they should not be added to the separate product-level AUM and base-fee disclosures.
- Investment advisory, administration and securities-lending revenue: $6.036 billion, up from $5.046 billion, or approximately 19.6% year over year; 77.9% of total revenue. Investment implication: this is the central recurring-fee engine, but its sensitivity to average market levels means investors must separate organic mandate wins from asset-price appreciation.
- Investment advisory performance fees: $630 million, up from $516 million, or 22.1%; 8.1% of revenue. Approximately $110 million came from HPS. Investment implication: private-market economics are becoming more visible, but performance fees depend on realization cycles and incentive arrangements, so a single strong quarter should not be treated as a permanent run rate.
- Technology services and subscriptions: $588 million, up from $515 million, or 14.2%; 7.6% of revenue. Technology annual contract value grew 12% year over year. Investment implication: Aladdin and related data workflows add contractual revenue and deepen client relationships, potentially reducing reliance on fluctuations in investment-market levels.
- Distribution fees: $414 million, up from $355 million, or 16.6%; 5.3% of revenue. Investment implication: much of the associated economics is passed through to distribution partners; gross revenue growth in this line should not automatically be mistaken for equivalent incremental profitability.
- Advisory and other revenue: $84 million, up from $77 million, or 9.1%; 1.1% of revenue. Investment implication: issuer and portfolio-advisory relationships matter strategically, especially for cross-selling financing and risk solutions, even though this remains a small direct revenue contributor.
These revenue percentages are calculated from company-reported figures: each 2026 revenue category divided by total revenue of $7.752 billion. The company also reported $2.762 billion of ETF-related base fees and securities-lending revenue, representing 46% of the $6.036 billion total, while institutional index products represented only 5%. Those are overlapping client-channel disclosures, not additional revenue lines. ETF net inflows totaled $134.509 billion; institutional index products experienced $27.444 billion of net outflows, concentrated in low-fee equity strategies. The combination suggests that BlackRock’s growth is shifting toward more valuable client use cases rather than depending uniformly on passive index assets.
Profitability requires two lenses. As adjusted, operating income rose 27% to $3.330 billion, and the company’s adjusted operating margin reached 47.8%, compared with 44.6% a year earlier and 45.9% in Q2 2026. GAAP operating income was $2.328 billion, up 19%, with a 30.0% GAAP operating margin. GAAP net income attributable to BlackRock was $1.659 billion, or $10.57 per diluted share, versus $8.43 a year ago. Adjusted net income attributable to BlackRock was $2.621 billion, or $15.93 per diluted share, versus $11.55 in Q3 2025.
A particularly consequential accounting distinction: BlackRock calculates its 47.8% adjusted operating margin using a $6.967 billion adjusted revenue denominator, not total GAAP revenue of $7.752 billion. Its reconciliation removes $414 million of distribution fees and $371 million of advisory fees passed to intermediaries; $3.330 billion divided by $6.967 billion is approximately 47.8%. GAAP operating margin is $2.328 billion divided by $7.752 billion, or 30.0%. These calculations are based on company-reported figures, and comparing the two percentages without explaining the denominators exaggerates how directly comparable they are. Adjustments to GAAP operating income included a $564 million noncash change in contingent-consideration fair value, $276 million of intangible-asset amortization, and other acquisition-related items.
Underlying earnings were strong, but adjusted EPS also benefited from nonoperating items: management identified $164 million in net investment gains, primarily noncash mark-to-market gains related to minority investments in Securitize and Circle. The company-reported adjusted nonoperating result, after the specified noncontrolling-interest treatment, improved to $127 million from a $106 million loss a year earlier. The sustainable earnings thesis should therefore lean more heavily on recurring base-fee expansion and operating leverage than on repeatability of investment gains.
Expectations vs. Actual Results
The following comparisons use Reuters’ contemporaneous reported market consensus; analysts’ estimate sets can differ by vendor and measurement date. Operating-margin consensus could not be independently verified on a comparable adjusted basis, so the result is not mislabeled as a consensus beat.
- Revenue: actual $7.752 billion versus approximately $7.5 billion expected by Wall Street as reported by Reuters. ✅ Beat, by approximately $0.25 billion based on the rounded consensus figure.
- Adjusted diluted EPS: actual $15.93 versus $14.13 expected, according to LSEG data cited by Reuters. ✅ Beat by $1.80, or approximately 12.7% of the stated estimate; percentage calculated from company-reported actual EPS and the independently reported LSEG estimate.
- Adjusted operating margin: actual 47.8%, versus 44.6% in Q3 2025 and 45.9% in Q2 2026. ✅ Expanded by 320 basis points year over year and 190 basis points quarter over quarter. A reliable like-for-like analyst consensus margin estimate was not established, so no margin beat or miss is asserted.
- GAAP diluted EPS and GAAP operating margin: $10.57 and 30.0%, respectively. These are reported outcomes, not substitutes for the adjusted numbers used in the market’s EPS comparison.
The revenue improvement was overwhelmingly driven by the core fee engine: of the $1.243 billion year-over-year increase in total revenue, $990 million came from investment advisory, administration and securities-lending revenue. That is approximately 79.6% of the total increase ($990 million / $1,243 million; calculated from company-reported figures). This makes the beat more credible than one based entirely on variable performance fees. Still, market appreciation lifted average AUM, so the quarter cannot be characterized as entirely market-independent organic growth.
For a long-duration asset-manager valuation, the more useful signals are the 11% annualized organic base-fee growth, the direction of fee rates on new flows, the 48.6% adjusted operating margin excluding all performance fees and related compensation, and conversion of the private-markets pipeline. The last of these remains a leading indicator rather than recognized quarterly profit. Revenue and EPS beats confirm execution; fee mix, recurring margins and funding commitments help determine whether the execution persists.
Q4 2026 outlook and guidance: BlackRock did not provide a quantified companywide Q4 revenue or EPS guidance range in the materials and call reviewed. CFO Martin Small indicated a projected adjusted tax-rate run rate of approximately 25% for Q4, anticipated at least $550 million of additional Q4 share repurchases subject to conditions, and reiterated an expectation for a mid-single-digit percentage increase in full-year general and administrative expense after annualizing the impact of HPS and Preqin. Management also described Q4 as its seasonally strongest quarter, expected typical iShares fourth-quarter flow seasonality, and anticipated firmer private-markets fundraising. These qualitative expectations are management statements, not realized results or analyst forecasts.
Price action tells a more instructive story than the opening headline. BLK closed at $1,073.79 on October 14, the earnings-release day, up 0.72% from the October 13 close of $1,066.12, despite a stronger early reaction. It then closed at $1,120.78 on October 15, up 4.38% that day and approximately 5.13% across the two sessions measured from the pre-release close. The cumulative return is calculated from independently reported closing prices: ($1,120.78 / $1,066.12) − 1. The first day’s fading initial gain occurred alongside a broad equity sell-off associated with hotter inflation data and higher-rate concerns, so it cannot responsibly be attributed solely to weak guidance, acquisition dilution or an overextended valuation. The subsequent advance also undermines a simplistic ‘sell the news’ characterization. Nevertheless, the GAAP-to-adjusted earnings gap and private-markets execution risks remain relevant reasons for investors to demand evidence beyond one earnings beat.
Earnings Call Highlights
The five strategic takeaways below are attributed paraphrases of the October 14 management discussion, rather than purported verbatim quotations from an official transcript.
- CFO Martin Small said 11% organic base-fee growth marked a ninth consecutive quarter at or above BlackRock’s 5% long-term objective, with new flows increasingly concentrated in higher-fee offerings. 💡 Reading Between the Lines: The investment variable is not merely the volume of new assets; it is the fee yield of the mandates BlackRock wins. Active ETFs, systematic investing, tax-aware portfolios and private markets can support fee expansion even where core passive products face pricing pressure.
- Small reported a 47.8% adjusted operating margin and said the margin excluding performance fees and related compensation reached 48.6%, up 230 basis points year over year. 💡 Reading Between the Lines: Margin expansion did not depend solely on incentive fees, although performance-fee mix helped the headline measure. Investors should model recurring operating leverage separately from non-GAAP acquisition adjustments and unusually strong realization periods.
- CEO Laurence Fink described BlackRock’s involvement in financing Meta’s planned $14 billion Texas data center and presented standardized compute-capacity financing as a possible future investable market. 💡 Reading Between the Lines: BlackRock wants to own more of the origination, structuring, distribution and risk-analytics workflow rather than only manage a finished security. The opportunity could enlarge the fee pool, but securitization economics and reliable collateral data remain proposals to prove, not revenue already booked.
- Small said the aim in capital-markets origination is to place suitable assets into long-term client portfolios that generate recurring management fees; syndication revenue is incremental rather than the main objective. 💡 Reading Between the Lines: This clarifies the capital-allocation logic behind HPS, GIP and the Aladdin ecosystem: access to attractive assets can reinforce sticky fee-paying AUM across pension, insurance and wealth channels. The trade-off is exposure to underwriting standards, valuation transparency and the time required to deploy capital responsibly.
- Small said Q4 typically accounts for 30%–40% of annual iShares inflows and expected stronger private-markets fundraising, while acknowledging that evergreen private-credit structures still had redemption requests in the queue. 💡 Reading Between the Lines: A recovery in flows is plausible but not guaranteed. The size and quality of new mandates, net of redemptions, matter more than seasonal gross activity; investors should resist capitalizing an optimistic pipeline before fees start to accrue.
2. Deep Business Insights
Hidden Metrics That Matter
First, private markets have disproportionate fee productivity. BlackRock reported $335.994 billion of private-markets AUM and $668 million of related base fees and securities-lending revenue. Against total AUM of $15.488 trillion and total base fees plus securities-lending revenue of $6.036 billion, this represents 2.17% of AUM but 11.07% of those fees. A simple fee-concentration comparison is (668 / 6,036) ÷ (335,994 / 15,488,263) = approximately 5.1 times, calculated from company-reported figures; all numerators and denominators are in millions of dollars. This is a relative concentration indicator, not a disclosed effective management-fee rate: it compares quarterly revenue with point-in-time AUM and is affected by different product economics.
Why it matters: a relatively small addition of fee-paying private assets can be disproportionately valuable compared with the same AUM addition in institutional indexing. That helps explain BlackRock’s acquisitions of GIP and HPS, but higher fee intensity must compensate clients for illiquidity, underwriting complexity, valuation opacity and potentially longer selling cycles. Winning a mandate is not the same as deploying it profitably.
Second, the unmonetized private-markets pipeline has become measurable. The SEC-filed Q3 earnings supplement showed $139 billion of private-markets available capital and $96 billion of AUM not yet earning fees. It separately reported $68 billion in gross private-markets fundraising and $88 billion in gross deployment over the latest twelve months. These categories are defined differently and should not be added together or treated as a guaranteed revenue backlog; some available capital may not be earning fees, and some not-yet-fee-earning AUM may involve leverage or performance-fee-only arrangements.
For valuation, watch the next several quarters’ change in fee-paying AUM relative to gross fundraising and deployment, not just announced financing deal sizes. BlackRock’s appeal to institutions rests on access to both liquid and illiquid strategies, issuer relationships, portfolio-construction advice and integrated workflows through Aladdin, eFront and Preqin. An allocator can potentially consolidate portfolio oversight, financing access, risk analytics and execution with one partner. That convenience and risk infrastructure create switching costs, although large institutions retain negotiating leverage and competitors can offer specialist solutions.
A related caution is visible in fixed income. Despite $78.213 billion of net inflows to fixed-income products during Q3, the company’s fixed-income AUM declined from $3.390 trillion at June 30 to $3.353 trillion at September 30; the reported market-change component was negative $117.408 billion. This demonstrates why asset flows and ending AUM can diverge sharply when bond markets reprice. It also means higher yields can simultaneously stimulate demand for income products and depress the near-term value of existing fee-bearing assets.
Industry Chain Reactions
- ✅ Potential beneficiary — Meta Platforms (NASDAQ: META). Fink specifically identified BlackRock’s participation in financing Meta’s planned $14 billion Texas data center, combining GIP infrastructure capabilities with HPS private-financing expertise. A deeper pool of institutional funding could support Meta’s financing flexibility for AI capacity. This is a plausible capital-access benefit, not evidence that META’s earnings or share price will rise because BLK reported strong results.
- ❌ Potential competitive pressure — State Street (NYSE: STT). BlackRock’s $134.509 billion quarterly ETF inflows, including demand for bond and higher-value active or precision strategies, illustrate intensifying competition for asset-management relationships and fees across ETF platforms. State Street’s SPDR franchise competes in this market. BlackRock’s inflows do not establish that State Street lost equivalent assets; the read-through concerns competition for future flows, product differentiation and pricing power rather than a proven transfer of market share.
Valuation Framework and Key Risks
Using BLK’s independently reported October 15, 2026 closing price of $1,120.78, the valuation is approximately 20.2 times the last four reported quarters of adjusted diluted EPS: $13.16 for Q4 2025 + $12.53 for Q1 2026 + $13.91 for Q2 2026 + $15.93 for Q3 2026 = $55.53; $1,120.78 / $55.53 = 20.2 times. This is a historical trailing multiple, calculated from company-reported figures and a market closing price, not a forecast P/E or target price.
For perspective, the same historical-quarter calculation using GAAP diluted EPS — $7.16 + $14.06 + $12.19 + $10.57 = $43.98 — gives approximately 25.5 times trailing GAAP EPS at the same closing price. These measures can diverge meaningfully because acquisition accounting and other management-defined adjustments are substantial. Neither multiple should be treated as a standalone verdict on value, and the two EPS series should not be intermixed.
What is BLK stock pricing in? A 20.2-times trailing adjusted multiple plausibly reflects expectations that ETF scale, higher-value net inflows and technology subscriptions can sustain growth while private markets gradually expand the fee-paying asset base. It also implies risk if 11% annualized organic base-fee growth proves unusually strong rather than representative of a durable cycle. Management’s longer-term ambition to generate more than 30% of revenue from private markets and technology is a strategic target, not an achieved business mix or a substitute for Q4 guidance.
The principal investment risks are:
- Market beta and rate sensitivity. Lower equity or bond valuations reduce AUM-linked fee revenue, even if net client inflows remain positive; the Q3 fixed-income AUM bridge is an immediate example.
- Private-credit liquidity, realizations and valuation transparency. Evergreen-fund redemption requests, fund deployment lags or weaker underwriting could delay fee conversion and impair client confidence.
- Acquisition integration, accounting and dilution. Q3 included $564 million of noncash contingent-consideration remeasurement in GAAP operating expense, and BlackRock’s diluted EPS calculation incorporates exchangeable HPS-related units. Investors should examine reconciliations and diluted share counts, not just adjusted EPS growth.
- Revenue quality and competitive pricing. Performance fees, minority-investment valuation gains and distribution-related gross revenue are less reliable proxies for recurring cash earnings than fee-paying AUM and contractual technology revenue.
- AI financing execution. BlackRock’s work with hyperscalers may create attractive placement and management opportunities, but higher capital costs, technology obsolescence and uncertain recovery values could reduce the economic attractiveness of compute-backed financing.
The practical monitoring framework is straightforward: assess annualized organic base-fee growth against its longer-term objective; track the proportion of inflows entering fee-richer solutions; compare recurring adjusted margin with the headline margin; follow private-market fee-paying AUM and the stock of assets not yet earning fees; and reconcile GAAP results, adjusted results and diluted shares each quarter. These metrics provide a more defensible basis for updating BLK’s valuation than extrapolating one quarterly EPS surprise.
3. Key FAQs
Did BlackRock (BLK) beat Wall Street earnings and revenue expectations in Q3 2026?
Yes. BlackRock reported $7.752 billion in revenue against approximately $7.5 billion of consensus revenue reported by Reuters, and adjusted diluted EPS of $15.93 against the $14.13 LSEG estimate cited by Reuters. Its GAAP diluted EPS was $10.57, which must not be compared directly with the adjusted EPS consensus.
What drove BlackRock’s Q3 2026 ETF inflows and private-markets earnings growth?
BlackRock reported $134.509 billion of net ETF inflows, including approximately $61 billion for index bond ETFs, $41 billion for precision ETFs and $22 billion for active ETFs as described on the conference call. Private-markets net inflows were $15.311 billion, while private-markets products produced $668 million of base fees and securities-lending revenue. The longer-term earnings question is how much newly raised and deployed capital becomes recurring fee-paying AUM, not simply the size of announced private-market deals.
What Q4 2026 guidance did BlackRock provide after its Q3 earnings call?
The reviewed release and conference call did not include a firmwide numerical Q4 revenue or EPS forecast. CFO Martin Small discussed an approximately 25% adjusted tax-rate run rate for Q4, at least $550 million of planned share repurchases subject to conditions, usual fourth-quarter iShares flow seasonality and an expectation for stronger private-markets fundraising. Those statements are guidance or management expectations, not actual Q4 results.
Sources and verification: BlackRock Investor Relations — Q3 2026 official webcast and event materials; BlackRock’s October 14, 2026 earnings release and GAAP reconciliations; SEC-filed Q3 earnings supplement; October 14 conference-call transcript (third-party; not an official BlackRock transcript); Reuters/LSEG pre-release consensus; and BLK historical closing prices. Source information and market data were reviewed as of October 16, 2026, using the U.S. closing price from October 15.
Disclaimer: This article/chart is for educational and informational purposes only and does not constitute investment advice of any kind. Past performance is not indicative of future results. Investors should independently evaluate their own risks.