
Key Takeaways
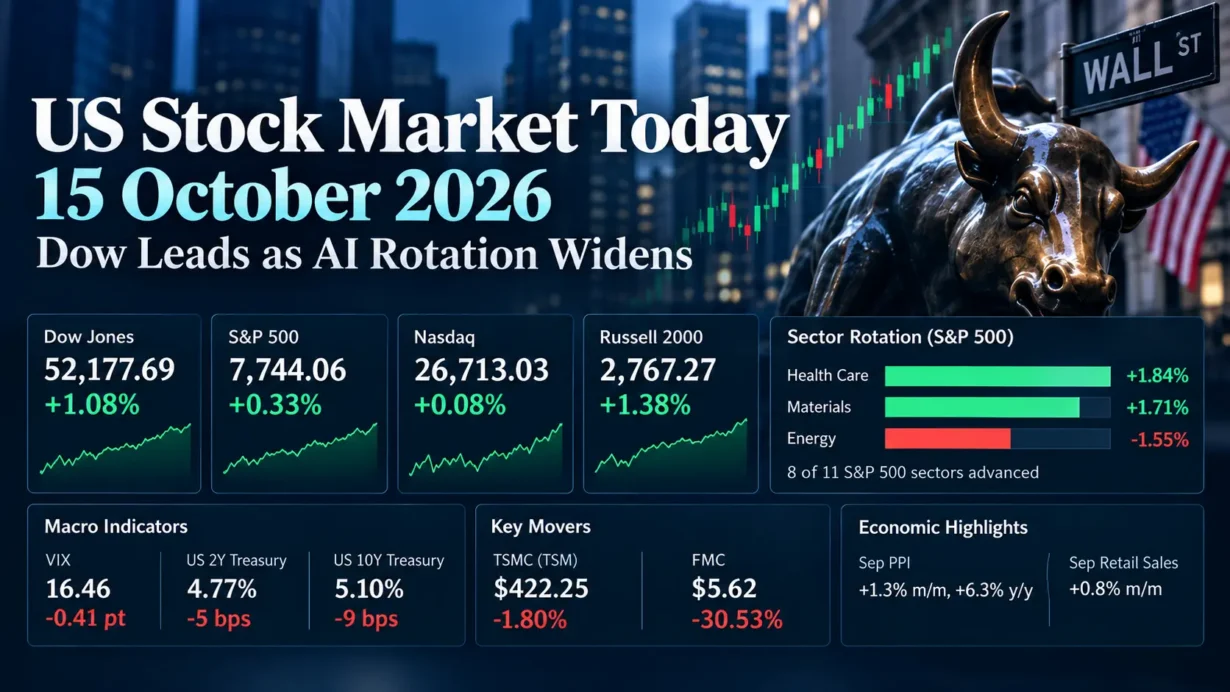
- The S&P 500 closed at 7,744.06 (+0.33%), the Dow at 52,177.69 (+1.08%), and the Nasdaq Composite at 26,713.03 (+0.08%). The small-cap Russell 2000 outperformed, rising 1.38% to 2,767.27.
- Health care led S&P 500 sectors (+1.84%), followed by materials (+1.71%); energy was weakest (−1.55%). Eight of 11 sectors advanced even as AI-linked technology lagged.
- September producer prices rose 1.3% month over month and 6.3% year over year, while nominal retail sales increased 0.8%. Treasury yields nonetheless fell during the session.
- The VIX closed at 16.46, down 0.41 point. TSMC’s U.S.-listed shares fell 1.80% despite record quarterly earnings; FMC plunged 30.53% following sharply reduced preliminary expectations.
1. Market Capital Flows and Sector Rotation
Thursday’s advance was a rotation in leadership, not a wholesale return to the AI trade. Health care (+1.84%) and materials (+1.71%) led the S&P 500, while energy (−1.55%) finished last. The value-leaning Dow significantly outpaced the growth-heavy Nasdaq; the Russell 2000’s 1.38% gain also exceeded the large-cap S&P 500’s 0.33% return. That pattern favors a relative shift toward less AI-dependent earnings streams and smaller companies, although benchmark comparisons alone do not establish the precise returns of formal growth and value factor indexes. Defensive health care strength coexisted with cyclical materials gains, while cyclical energy remained under pressure. Sources: Reuters closing report, sector performance, and AP index closes.
Participation was wider than the Nasdaq headline suggests: eight of 11 S&P 500 sectors rose, advancing S&P 500 constituents outnumbered decliners 3.1 to 1, and U.S. exchange volume reached 20.7 billion shares versus a prior-20-session average of 17.6 billion. Yet the Nasdaq logged 393 new 52-week lows against only 61 new highs. That divergence argues for separating improving index breadth from persistent stress in parts of the technology complex. Source: Reuters.
Institutional Flow Insight: The price action is consistent with portfolio managers diversifying away from capital-intensive, long-duration AI exposures toward businesses with more visible near-term cash generation. Lower Treasury yields offered some valuation relief, but funding costs remained elevated and Wednesday’s inflation shock was unresolved. Early-fourth-quarter rebalancing, valuation discipline and tighter risk budgets are plausible contributors—not verified records of institutional orders or fund flows. Investors should distinguish those hypotheses from the observable sector, breadth and volume data.
2. Decoding the Biggest Market Movers
Taiwan Semiconductor Manufacturing (TSM)
TSMC’s NYSE-listed ADR closed at $422.25, down 1.80% during regular trading, despite exceptional reported third-quarter results. Its October 15 earnings release reported revenue of US$46.72 billion, up 41.2% year over year in U.S. dollars; diluted EPS of NT$29.43 per common share (US$4.60 per ADR); gross margin of 66.4%, operating margin of 58.7%, and net margin of 51.1%. Advanced nodes of 7 nanometers and below contributed 79% of wafer revenue. Separately, management’s fourth-quarter guidance—not realized results—called for revenue of US$52.3 billion–US$54.3 billion, gross margin of 65%–67%, and operating margin of 56.5%–58.5%. Sources: TSMC Investor Relations, SEC-filed earnings release, and historical ADR close.
The discrepancy between strong realized chip demand and a falling share price is the investment signal. On the earnings call, management emphasized robust leading-edge demand but acknowledged rising component costs and macroeconomic uncertainty in price-sensitive consumer markets as reasons for prudent 2027 planning. The written transcript is third-party; the company provides an official call replay. TSM is not an S&P 500 constituent, but its outlook matters for the valuation of U.S. semiconductor customers and AI infrastructure suppliers. Nvidia fell 1.8% as the Philadelphia Semiconductor Index declined 0.9%, highlighting the market’s growing emphasis on financing costs, downstream returns on AI spending and earnings durability rather than demand growth alone. Source: Reuters.
FMC Corporation (FMC)
FMC closed at $5.62, down 30.53%, after its October 15 release sharply reset third-quarter expectations. The company projected quarterly revenue of just $65 million–$125 million and adjusted EBITDA of negative $565 million to negative $510 million, reflecting an estimated $625 million–$675 million impact from channel pricing and other commercial actions. FMC cited elevated inventories of higher-priced products, weaker distributor replenishment and generic competition. These are preliminary company estimates, not published third-quarter actuals or EPS results; management said full quarterly results were scheduled for October 29. Sources: official FMC Investor Relations release and regular-session closing price.
FMC also said it intended to discuss potential covenant modifications with lenders, even while expecting compliance as of September 30. The read-through is primarily company-specific: channel inventory quality, pricing power and balance-sheet flexibility can overwhelm broad cyclical exposure. Materials’ 1.71% sector gain on the same day underscores why a distressed agricultural-chemicals issuer should not be treated as representative of the entire sector. No third-quarter FMC earnings-call transcript was available for this pre-results announcement. Source: FMC.
3. Macro Indicators and Market Outlook
The Cboe Volatility Index (VIX) closed at 16.46, down 0.41 point (2.43%) from October 14’s 16.87. That decline broadly matched the positive equity close and suggests less demand for near-term index volatility protection than on Wednesday, but it cannot establish that investors unwound hedges or that AI-specific stress disappeared. Sources: historical VIX closes and Cboe index methodology.
In the U.S. Treasury’s official daily constant-maturity series, the two-year yield was 4.77%, down 5 basis points from 4.82% on October 14; the ten-year was 5.10%, down 9 basis points from 5.19%. The positive two-year/ten-year spread narrowed from 37 to 33 basis points, a one-day bull flattening. These are Treasury’s approximately 3:30 p.m. ET indicative par-yield readings, not an asserted 4:00 p.m. transaction price. Lower yields could reflect a flight to quality or softer growth-risk pricing as well as shifting policy expectations; they do not, by themselves, establish a forthcoming rate cut.
The macro tension is acute. The Bureau of Labor Statistics reported September final-demand PPI up 1.3% month over month and 6.3% year over year, with both goods and services prices rising. Meanwhile, the Census Bureau reported September retail and food-services sales of $745.0 billion, up 0.8% month over month in nominal, seasonally adjusted terms; this is not inflation-adjusted consumption growth. Sticky price pressures constrain the case for easier policy, while high financing costs challenge leveraged AI infrastructure investment even on a day when bond yields fall.
Upcoming Economic Data & Catalysts:
- U.S. Import and Export Price Indexes for September 2026 (Release date: October 16, 2026, 8:30 a.m. ET): The BLS release will clarify import-price inflation and potential transmission into domestic input costs and interest-rate expectations. Official BLS calendar.
- Industrial Production and Capacity Utilization for September 2026 (Release date: October 16, 2026, 9:15 a.m. ET): The Federal Reserve report will test manufacturing momentum and capacity pressure, both relevant to cyclicals and the growth-inflation mix. Official Federal Reserve schedule.
Market Insights: This was not a handful-of-megacaps rally. Broad S&P 500 participation and small-cap strength coincided with substantial AI-related weakness; the correct diagnosis is selective risk-taking alongside defensive rotation. A renewed rise in ten-year yields, deteriorating advance-decline breadth, negative earnings revisions, fresh policy surprises or a sustained VIX reacceleration could reverse the improvement. Conversely, a more durable rally would require wider earnings participation rather than repeated reliance on the same defensive leaders.
Trading & Investment Strategy: Maintain position sizes consistent with portfolio drawdown limits and liquidity needs; deploy new capital in stages rather than chasing one-day sector winners. Within both defensive and cyclical allocations, favor demonstrable pricing power, cash conversion and manageable refinancing exposure over simple sector labels. Reassess AI holdings against financing assumptions and customer economics, use pre-defined risk or stop-loss levels appropriate to each strategy, and avoid leverage that magnifies gaps around earnings or macro releases. Diversification reduces concentration risk but cannot eliminate market losses.
4. Key FAQs About the US Stock Market Today
Why did the US stock market move on October 15, 2026?
Stocks recovered as health care, materials and small caps attracted relative interest while AI-linked stocks remained under pressure. Hot September PPI and firm nominal retail sales kept inflation and Federal Reserve policy risks in focus; falling Treasury yields provided some relief without resolving concerns over the cost of capital.
Which sectors performed best and worst in the US stock market on October 15, 2026?
Health care led the S&P 500 with a 1.84% gain, followed by materials at 1.71%; energy lagged at −1.55%. The mix points to selective diversification away from AI, not a uniform shift into either defensive or cyclical stocks.
What should investors watch after the US stock market close on October 15, 2026?
Watch the October 16 import/export price report and industrial production release, the direction of two- and ten-year Treasury yields, Nasdaq market breadth, and whether semiconductor weakness spreads to other sectors. Subsequent company disclosures will also test whether strong revenue growth translates into durable free cash flow.
Disclaimer: This article is intended solely for the exchange of investment ideas and does not constitute investment advice of any kind.