

Key Takeaways
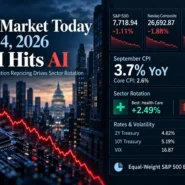
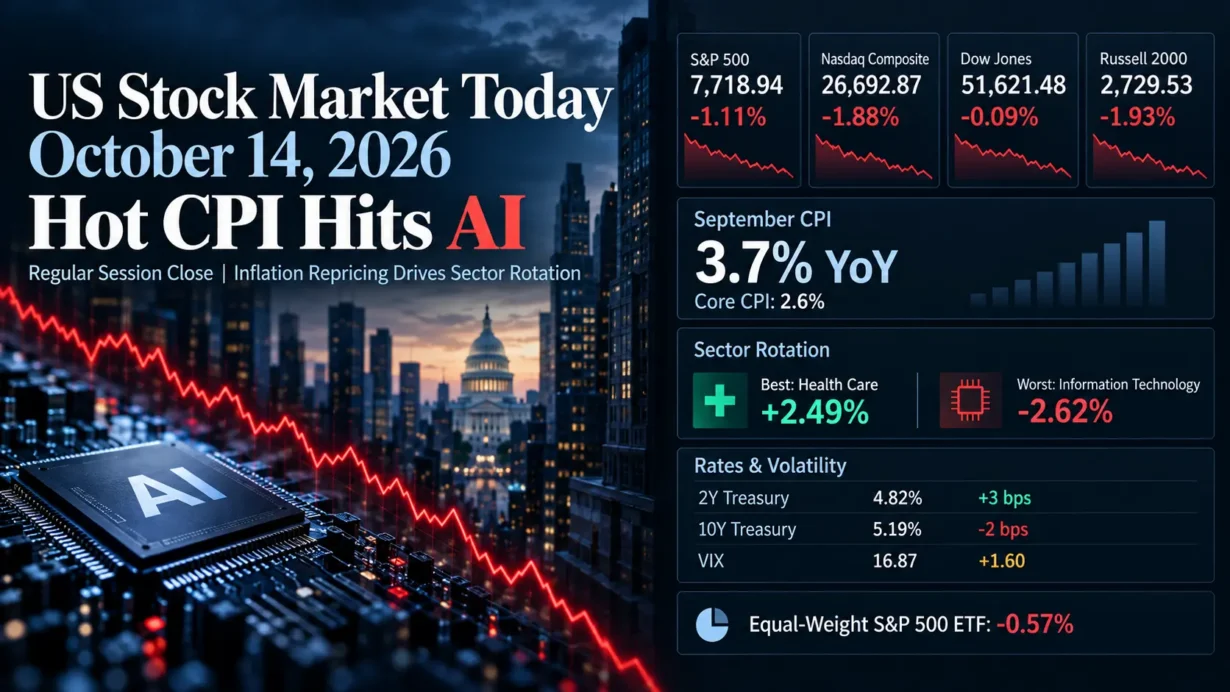
- At the October 14 regular-session close, the S&P 500 fell 1.11% to 7,718.94, the Nasdaq Composite lost 1.88% to 26,692.87, and the Dow slipped 0.09% to 51,621.48. The Russell 2000 declined 1.93% to 2,729.53, underscoring small-cap weakness. Source: Reuters.
- September CPI accelerated to 3.7% year over year; core CPI reached 2.6%. Gasoline prices rose 9.1% month over month, sharpening concerns about persistent inflation and the cost of capital.
- Health care led the S&P 500 sectors, up 2.49%, while information technology lagged, down 2.62%. The equal-weight S&P 500 ETF fell just 0.57%, pointing to disproportionate pressure on larger index constituents.
- The VIX rose 1.60 points to 16.87. Treasury’s two-year yield increased 3 basis points to 4.82%, even as its 10-year yield fell 2 basis points to 5.19%.
1. Market Capital Flows and Sector Rotation
The clearest rotation was out of expensive, capital-intensive growth and toward defensive earnings. Health care was the day’s strongest S&P 500 sector at +2.49%, whereas information technology was the weakest at -2.62%, according to close-of-day sector reporting; communication services also lost 1.78%, according to Reuters. The consumer staples sector ETF XLP gained 2.22%, reinforcing the defensive theme, although ETF returns should not be mistaken for official sector-index returns.
The distinction between market-cap weighting and breadth matters. The equal-weight S&P 500 ETF (RSP) lost 0.57% versus the benchmark’s 1.11% decline; S&P 500 decliners outnumbered advancers by roughly 1.1 to 1, with 18.0 billion U.S. shares traded against a 20-session average of 17.6 billion. The Nasdaq and small-cap Russell 2000 materially underperformed the Dow. This was neither a broad value-stock rally nor a simple cyclical rebound: financials also weakened, while less rate-sensitive defensive shares held up better.
Institutional Flow Insight: The price action is consistent with investors reducing exposure to long-duration earnings and debt-funded AI buildouts while favoring cash-flow visibility, resilient margins and less demanding valuations. Near-term rate sensitivity and tighter portfolio risk budgets offer plausible explanations; the session’s prices do not, by themselves, establish actual institutional fund flows or quarter-end rebalancing activity.
2. Decoding the Biggest Market Movers
Oracle (ORCL)
Oracle fell 8.8% at the regular-session close as the inflation surprise magnified scrutiny of AI infrastructure funding. Its latest official fiscal Q1 2027 results, released September 10, showed $19.345 billion in revenue, $1.56 in GAAP diluted EPS, a 35% GAAP operating margin and 121% year-over-year infrastructure-cloud revenue growth. Yet $28.499 billion of capital expenditures accompanied negative $5.396 billion in free cash flow. In a third-party transcript of the September 10 earnings call, management did not specify when free cash flow would turn positive. The selloff therefore highlights financing and cash-conversion risk, not evidence of a new October 14 earnings miss. CoreWeave (-15%) and Nebius (-10%) also slumped, spreading valuation pressure across the AI infrastructure complex; the Philadelphia Semiconductor Index lost 4.3%.
Bank of America (BAC)
Bank of America dropped 4.8% after reporting third-quarter 2026 revenue of $29.958 billion and GAAP diluted EPS of $0.91. A $1.2 billion regulatory settlement charge reduced earnings by $0.17 per share; excluding it, adjusted EPS was $1.08, a non-GAAP measure. Net interest income nevertheless climbed 8% year over year to $16.449 billion, while fixed-income trading revenue fell 17%. A third-party transcript of the October 14 earnings call documented management emphasizing resilient customer banking alongside weaker markets-related revenue. The investment implication is earnings-quality dispersion rather than a blanket deterioration in loan demand: compliance costs and trading mix weighed on BAC even as higher-rate assets supported interest income. The S&P 500 Banks Index fell 0.7%, illustrating spillover into financial-sector sentiment.
3. Macro Indicators and Market Outlook
The inflation impulse was material: September headline CPI increased 0.6% month over month and 3.7% year over year, up from 3.4% in August; annual core inflation climbed to 2.6% from 2.4%. The Bureau of Labor Statistics attributed more than half the monthly headline increase to gasoline. Persistent price pressure raises the discount rate investors may demand for distant AI-related cash flows, although one CPI release cannot establish the Federal Reserve’s next decision.
The Cboe VIX closed at 16.87, up 1.60 points, or 10.48%, consistent with rising equity downside concerns. Because the VIX is an options-implied volatility measure, it does not independently prove that institutions executed hedges. The U.S. Treasury’s October 14 daily par-yield readings put the two-year at 4.82% (+3 basis points from October 13) and the 10-year at 5.19% (-2 basis points). The positive 10-year-minus-two-year spread narrowed to 37 basis points, a five-basis-point flattening. That divergence suggests greater near-term policy anxiety alongside demand for longer-duration bonds, not a confirmed rate-hike path.
Oil added a second inflation channel: Brent crude settled at $106.06 per barrel. Elevated energy prices can help energy producers while pressuring consumer spending and other companies’ input costs, complicating a straightforward cyclical recovery thesis.
Upcoming Economic Data & Catalysts:
- U.S. Producer Price Index for September 2026 (Release date: October 15, 2026, 8:30 a.m. ET): Watch whether upstream price pressures reinforce or soften the CPI signal, especially for corporate margins and rate expectations.
- U.S. Advance Retail and Food Services Sales for September 2026 (Release date: October 15, 2026, 8:30 a.m. ET): Sales growth and category mix will help gauge demand resilience against inflation-driven purchasing-power pressure.
Market Insights:
The evidence favors a concentrated growth-and-AI valuation reset over indiscriminate liquidation: equal-weight equities fell less than the capitalization-weighted S&P 500, even as small caps showed clear vulnerability. Risks to stabilization include further short-rate repricing, weaker earnings revisions, deteriorating participation and another volatility spike.
Trading & Investment Strategy:
Keep position sizes proportionate to downside capacity, deploy capital in stages rather than chase sharp reversals, and distinguish funded AI beneficiaries from businesses with significant near-term capital needs. Favor durable cash generation and earnings visibility over narrative momentum; define risk limits and exit criteria before entry, while allowing for gaps around economic releases.
4. Key FAQs About the US Stock Market Today
Why did the US stock market move on 14 October 2026?
A 3.7% September CPI reading revived inflation and near-term rate concerns, hitting long-duration AI shares. Oracle’s financing-sensitive selloff and Bank of America’s regulatory-charge-affected earnings added company-specific pressure.
Which sectors performed best and worst in the US stock market on 14 October 2026?
Within the S&P 500, health care led at +2.49% and information technology lagged at -2.62%. Investors appeared to favor defensive earnings and cash-flow resilience over capital-intensive growth; this is a rotation interpretation, not verified fund-flow data.
What should investors watch after the US stock market close on 14 October 2026?
The October 15 PPI and retail-sales releases are the next scheduled tests. Monitor two-year yields, the VIX, equal-weight participation and management commentary on AI spending and funding before inferring that the correction has ended.
Disclaimer: This article is intended solely for the exchange of investment ideas and does not constitute investment advice of any kind.