

Key Takeaways
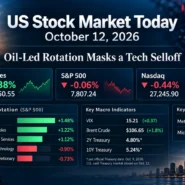
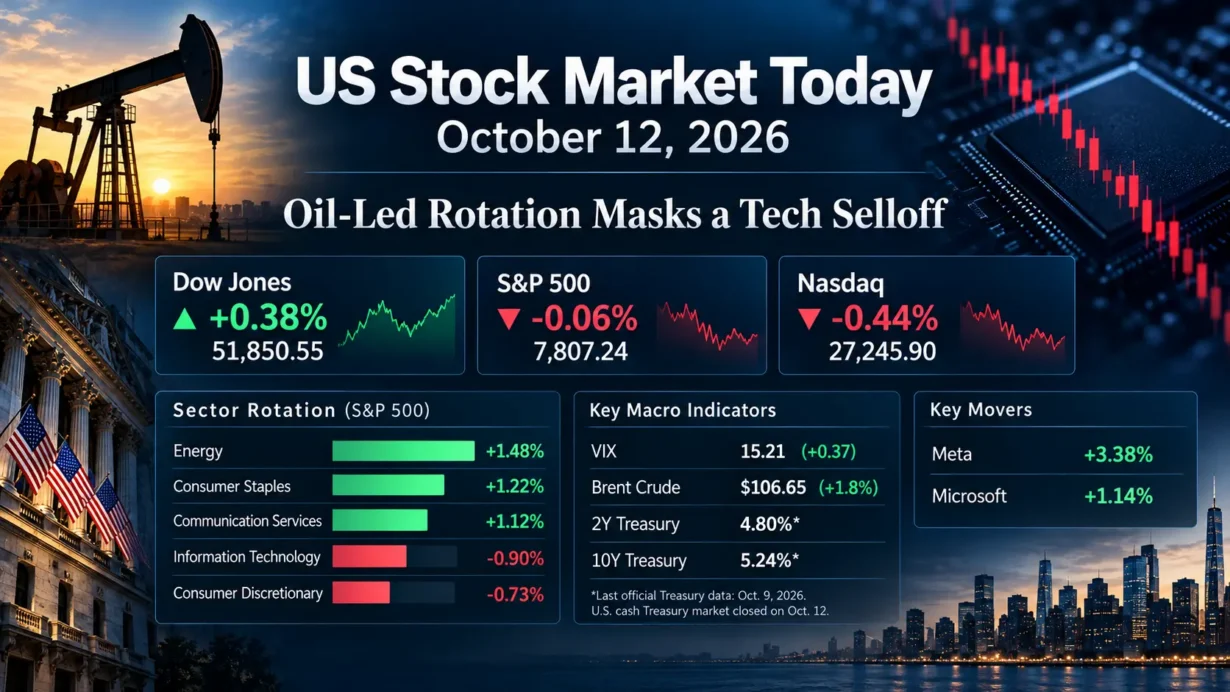
- U.S. equities diverged at the October 12 regular-session close: the Dow rose 0.38% to 51,850.55, the S&P 500 fell 0.06% to 7,807.24, the Nasdaq Composite lost 0.44% to 27,245.90, and the Russell 2000 declined 0.45% to 2,794.48. Reuters
- Energy led the S&P 500 sectors at +1.48% as Brent crude settled up 1.8% at $106.65 per barrel; information technology trailed at -0.90%, with the Philadelphia semiconductor index down 2.7%. Sector data
- Meta gained 3.38% and Microsoft advanced 1.14% following separate official AI announcements, suggesting investors distinguished platform monetization and computing efficiency from broader semiconductor exposure.
- The Cboe VIX rose 0.37 point to 15.21. U.S. cash Treasuries were closed for Columbus Day; the latest official two- and 10-year yields remained those published on October 9. Cboe
1. Market Capital Flows and Sector Rotation
The day’s defining trade was an oil-led rotation rather than a broad equity selloff. Among the 11 S&P 500 sectors, energy (+1.48%) led, followed by consumer staples (+1.22%) and communication services (+1.12%). Information technology (-0.90%) was the weakest, with consumer discretionary (-0.73%) next and industrials (-0.07%) marginally lower. Financials gained 0.57% and utilities 0.53%, while eight sectors finished positive. Higher crude prices supported producers but increased input-cost and inflation risks for energy-consuming businesses. Verified sector closes
Value outperformed growth: the Russell 1000 Value ETF proxy IWD gained 0.44%, while the Russell 1000 Growth ETF proxy IWF fell 0.61%. The equal-weight S&P 500 ETF proxy RSP edged up 0.07%, contrasting with the capitalization-weighted index’s 0.06% decline. This was not uniformly healthy breadth, however: declining shares outnumbered advancers 1.09-to-1 on the NYSE and 1.59-to-1 on Nasdaq. Large-cap, cash-generative platform stocks held up selectively; small caps lagged, with the Russell 2000 down 0.45%. U.S. exchange volume of 12.67 billion shares was below the 20-session average of 17.62 billion, warranting caution about the conviction behind the move. Breadth and volume; IWD close; IWF close; RSP close
Institutional Flow Insight: The pattern is consistent with investors favoring near-term cash flows, defensive pricing power and value over rate-sensitive growth exposures as oil-related inflation risk resurfaces. It also suggests differentiation between companies selling AI compute and those seeking to monetize AI services. These are interpretations of prices, not verified institutional fund flows; quarter-start rebalancing or changes in institutional risk budgets cannot be established from this session’s tape.
2. Decoding the Biggest Market Movers
Meta Platforms (META)
Meta closed at $742.96, up 3.38% in regular trading, after announcing Muse Wonder and Muse Wonder Full on October 12. The company made Muse Wonder available through its Model API and Muse Code, and Muse Wonder Full available to Muse Code subscribers. That provides a potential route from AI research spending toward developer and subscription products, though neither adoption nor incremental profitability was established by the announcement. Meta’s most recent reported quarter, Q2 2026, generated $60.801 billion in revenue (+28% year over year) and $6.18 in GAAP diluted EPS. Its operating margin was 31%, versus 43% a year earlier, while quarterly capital expenditures including finance-lease principal payments totaled $31.08 billion. The contrast between revenue momentum and capital intensity is critical to assessing AI returns. Official earnings release; July 29 earnings-call transcript; Closing-price record
Meta’s strength helped communication services rise 1.12%. For peers, the relevant valuation question is whether proprietary AI products can enhance advertising performance or establish recurring external revenue without a proportionate rise in operating and infrastructure costs. The stock’s gain is consistent with enthusiasm for that possibility, not proof of a completed monetization cycle.
Microsoft (MSFT)
Microsoft finished at $541.15, up 1.14% in regular trading, after detailing its Azure Maia AI-inference strategy. The company said Maia 200 already supports production workloads and outlined plans for Maia 300 deployments and multi-gigawatt system expansion beginning in 2027; those future deployments are plans, not completed capacity. The investment thesis is lower inference cost per useful AI task and tighter hardware-software integration, potentially improving cloud margins over time. In its latest reported quarter, fiscal Q4 2026, Microsoft recorded $90.0 billion in revenue (+18% year over year), $4.81 in GAAP diluted EPS and $40.6 billion in operating income. Management described an approximately 45% operating margin, $41 billion in capital expenditures and $19.6 billion in free cash flow on its earnings call. Official earnings release; July 29 earnings-call transcript; Closing-price record
Microsoft’s resilience while the Philadelphia semiconductor index declined 2.7% underlines the distinction between AI infrastructure spending and the economics of operating AI services. Successful internal silicon could eventually affect merchant accelerator suppliers’ pricing leverage, but the announcement does not demonstrate near-term order cancellations or realized cost savings.
3. Macro Indicators and Market Outlook
The Cboe VIX ended October 12 at 15.21, up 0.37 point, or 2.49%, from 14.84. The modest increase in options-implied volatility was directionally consistent with Nasdaq and S&P 500 weakness. It signals somewhat higher priced uncertainty ahead of inflation releases and earnings, but does not by itself verify institutional hedging flows or indicate a disorderly risk-off event.
There was no normal October 12 U.S. cash-Treasury close: SIFMA recommended a full fixed-income market closure for Columbus Day. The Treasury’s last published par yields, dated Friday, October 9, were 4.80% for two years (up 5 basis points from October 8) and 5.24% for 10 years (up 2 basis points). The two-to-10-year spread was therefore +44 basis points. These are Friday’s changes, not Monday’s. Elevated front-end yields point to policy sensitivity, while the longer end also reflects inflation, growth and term-premium considerations; neither move establishes a future Federal Reserve decision. Reuters also reported hawkish comments from Cleveland Fed President Beth Hammack on Monday.
Brent’s 1.8% rise to $106.65 per barrel after weekend strikes on Riyadh’s international airport sharpened the market’s supply-risk focus. Sustained oil strength could support energy-sector cash flows while pressuring consumer purchasing power, transportation margins and inflation-sensitive equity valuations. Market and event reporting
Upcoming Economic Data & Catalysts:
- U.S. Consumer Price Index for September 2026 (Release date: Wednesday, October 14, 2026, 8:30 a.m. ET): Headline and core inflation will test whether higher energy costs are coinciding with broader price pressure, with implications for short-term yields and growth-stock valuations.
- U.S. Producer Price Index for September 2026 (Release date: Thursday, October 15, 2026, 8:30 a.m. ET): Producer-level cost trends will inform assessments of corporate margin pressure and the potential pass-through to consumer inflation.
Market Insights: This was selective sector rotation, not an indiscriminate flight from equities or a broad risk-on advance. Eight sectors and the equal-weight S&P 500 proxy rose, but weak Nasdaq breadth and semiconductor losses pulled growth-heavy benchmarks lower. The constructive interpretation would weaken if cash Treasury yields rise sharply when trading resumes, oil-driven inflation broadens, earnings expectations are revised down or volatility increases alongside deteriorating breadth.
Trading & Investment Strategy: Keep position sizes consistent with event risk before CPI and PPI; deploy capital in stages rather than extrapolating a single holiday-thinned session. Favor companies whose reported earnings, cash generation and pricing power can support valuations, and evaluate energy exposure against the risk of an oil-price reversal. Define exit or loss limits before entering positions, avoid chasing AI-related gaps, and review portfolio concentration in both chip suppliers and mega-cap platforms.
4. Key FAQs About the US Stock Market Today
Why did the US stock market move on October 12, 2026?
Higher oil prices amid Middle East supply concerns helped energy shares, while inflation and rate uncertainty pressured semiconductor-heavy technology. Meta and Microsoft outperformed on company-specific AI announcements, and light Columbus Day trading volumes limited the strength of any market-wide signal.
Which sectors performed best and worst in the US stock market on October 12, 2026?
Energy was best at +1.48%, followed by consumer staples at +1.22%; information technology was worst at -0.90%, followed by consumer discretionary at -0.73%. The split favored near-term commodity earnings and defensive cash flows over more valuation-sensitive growth exposures.
What should investors watch after the US stock market close on October 12, 2026?
Watch the October 14 CPI and October 15 PPI releases, the direction of Treasury yields when the cash bond market reopens, and incoming bank earnings for evidence of credit and business-cycle resilience. Confirm any follow-through through market breadth and volatility rather than relying solely on headline index levels.
Disclaimer: This article is intended solely for the exchange of investment ideas and does not constitute investment advice of any kind.