Key Takeaways
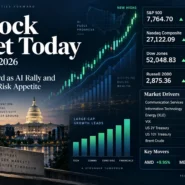
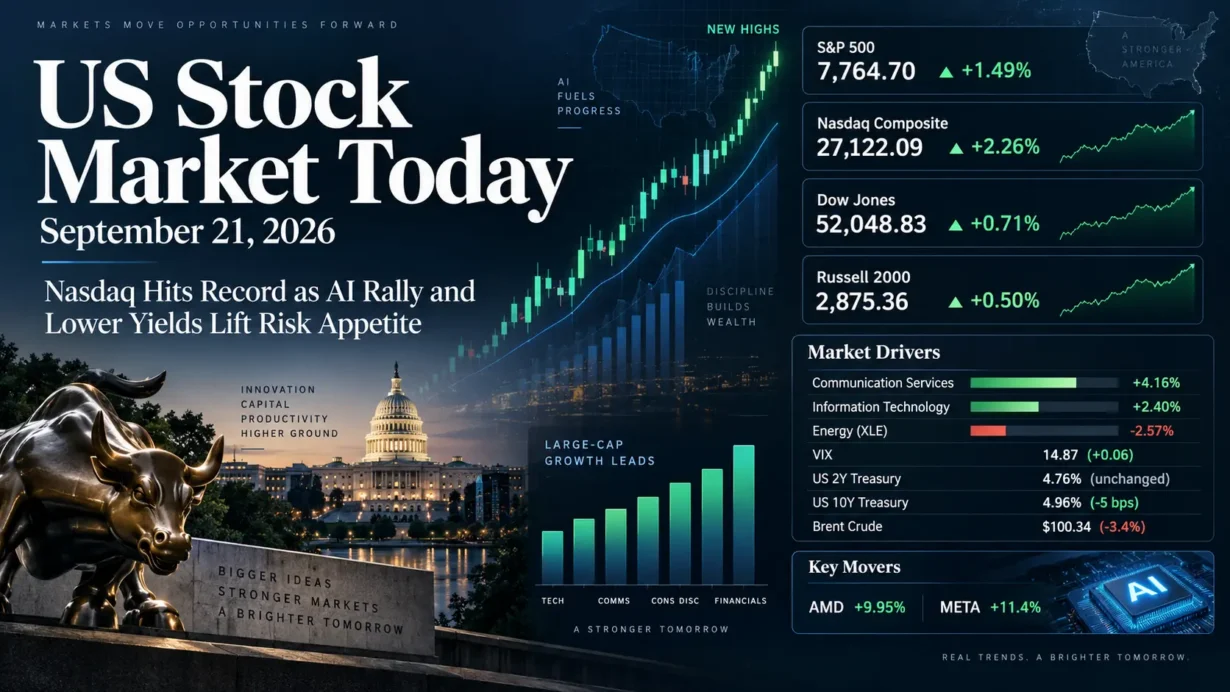
- The S&P 500 rose 1.49% to 7,764.70, the Nasdaq Composite advanced 2.26% to a record 27,122.09, and the Dow Jones Industrial Average gained 0.71% to 52,048.83. The Russell 2000 rose a more modest 0.5% to 2,875.36, underscoring the large-cap growth bias of the session.
- AI and semiconductor exposure drove the strongest upside. Communication Services led the S&P 500 sectors with a 4.16% gain, Information Technology rose 2.4%, and the PHLX Semiconductor Index climbed 4.3%. Energy was the clear laggard as crude oil sold off sharply.
- Market breadth was positive but less powerful than the headline indexes suggested: eight of 11 S&P 500 sectors advanced, S&P 500 advancers outnumbered decliners by 1.4 to 1, and U.S. exchange volume reached 16.5 billion shares versus a 20-day average of 16.2 billion.
- The U.S. Treasury curve delivered a supportive but nuanced signal. The official 2-year constant-maturity yield was unchanged at 4.76%, while the 10-year yield fell 5 basis points to 4.96%, easing the discount-rate pressure on long-duration growth stocks without implying a wholesale reversal of the Federal Reserve’s newly tighter policy stance.
- Cboe’s VIX closed at 14.87, up 0.06 point or 0.41% even as equities rallied. The lack of a volatility collapse suggests that investors retained some event protection despite the strong risk-on tape.
1. Market Capital Flows and Sector Rotation
The session was a classic example of positive market breadth combined with highly concentrated return leadership. Communication Services was the strongest S&P 500 sector, rising 4.16%, with megacap internet and media names amplifying the index move. Information Technology followed with a 2.4% gain as semiconductor shares rallied. Energy was the weakest group as Brent crude fell 3.4% to $100.34 a barrel; the Energy Select Sector SPDR, a liquid proxy for the S&P 500 energy complex, declined 2.57%. Large-cap growth clearly outperformed small caps and value-oriented exposures: the Nasdaq gained 2.26% versus roughly 0.5% for the Russell 2000, while the iShares Russell 1000 Growth ETF rose 2.43% against roughly 0.6% for its value counterpart. Cyclicals were mixed rather than uniformly strong: consumer-facing risk assets participated, but energy sold off, while defensive areas such as utilities and consumer staples lagged the technology-led advance.
Breadth was constructive but not strong enough to characterize the move as an indiscriminate risk-on surge. Eight of 11 S&P 500 sectors finished higher and advancing S&P 500 issues led decliners by 1.4 to 1. At the same time, the equal-weight S&P 500 proxy rose only about 0.4%, far less than the 1.49% gain in the capitalization-weighted index. Trading volume of 16.5 billion shares was modestly above the prior 20-session average of 16.2 billion. Taken together, the data indicate a market with positive participation but outsized index contribution from a relatively small group of very large AI-sensitive stocks.
Institutional Flow Insight: The rotation is consistent with investors adding duration-sensitive growth exposure as long-end Treasury yields and oil prices retreated, while keeping a preference for companies with visible AI-related earnings growth. The move may also reflect a rebound in risk budgets after the previous week’s Federal Reserve rate increase, rather than a conviction that monetary policy is turning dovish. With the 2-year yield unchanged and the 10-year yield lower, the rate impulse favored long-duration equities without materially easing the market’s near-term policy-rate anchor. Energy’s underperformance, meanwhile, was mechanically consistent with lower crude prices and reduced near-term inflation sensitivity. These are flow-based inferences, not evidence of confirmed institutional positioning.
2. Decoding the Biggest Market Movers
Advanced Micro Devices (AMD)
AMD closed up 9.95% at $615.52, pushing its market capitalization above $1 trillion for the first time. The move occurred within a broad semiconductor rally rather than in response to a same-day earnings release: the PHLX Semiconductor Index gained 4.3%, Intel rose 12.2%, and Arm Holdings advanced about 17%. The fundamental backdrop helps explain why AMD carried such high sensitivity to renewed AI risk appetite. In its latest official Q2 2026 release, AMD reported revenue of $11.536 billion, up 50% year over year; GAAP gross margin was 54%, GAAP operating margin was 17%, and GAAP diluted EPS was $1.38. On a non-GAAP basis, gross margin was 56%, operating margin was 27%, and diluted EPS was $1.66. Data Center revenue reached $6.718 billion, up 107% year over year. AMD’s official Q3 outlook called for revenue of approximately $13.0 billion, plus or minus $300 million, with non-GAAP gross margin near 56%. On the Q2 earnings call, management described strong customer pull for its next-generation AI systems and a planned Helios ramp extending through the second half and into 2027. That combination of accelerating data-center fundamentals and a falling long-end yield made AMD a high-beta beneficiary of the day’s AI re-rating. For the semiconductor group, the stock’s move reinforced a market willingness to pay for credible AI revenue scaling, while also increasing valuation sensitivity to future execution, supply, customer deployment timing and margin delivery.
Meta Platforms (META)
Meta rose 11.4%, making it one of the largest contributors to the Communication Services rally. Reuters attributed the move to renewed enthusiasm around the company’s Muse AI assistant and a Wells Fargo price-target increase following the product launch. The latest official financials provide the operating context but were not a new September 21 earnings event. Meta’s Q2 2026 revenue was $60.801 billion, up 28% year over year, with GAAP operating income of $18.775 billion, a 31% operating margin and diluted EPS of $6.18. The company guided Q3 revenue to $61 billion-$64 billion, raised its full-year 2026 expense range to $165 billion-$169 billion, and narrowed expected 2026 capital expenditures to $130 billion-$145 billion. On the Q2 earnings call, management continued to frame AI as central to product engagement, advertising performance and the company’s infrastructure buildout. The September 21 rally therefore combined a product-driven sentiment catalyst with an already substantial earnings and capital-spending base. At the sector level, Meta’s weight meant its move materially boosted Communication Services and the S&P 500; for peers, it also reinforced the market’s willingness to reward AI products when investors can connect them to engagement, monetization or platform scale rather than viewing AI spending only as a cost center.
3. Macro Indicators and Market Outlook
Cboe’s VIX closed at 14.87, up 0.06 point or 0.41% from the prior session. That was an unusual but not contradictory combination with a 1.49% S&P 500 rally. Spot volatility remained low in absolute terms, but it did not compress alongside the equity advance. One reasonable interpretation is that investors kept some option hedges in place around geopolitical, trade and policy events even while adding equity risk. The signal is therefore more consistent with controlled risk-taking than with outright complacency.
Official U.S. Treasury constant-maturity data showed the 2-year yield at 4.76%, unchanged from September 18, while the 10-year yield fell to 4.96% from 5.01%, a 5-basis-point decline. The resulting 2s10s spread narrowed to about 20 basis points from 25 basis points. Because the front end did not rally with the long end, the move should not be read as a definitive market call for imminent Federal Reserve easing. The Fed had raised its target range by 25 basis points to 3.75%-4.00% on September 16 and said inflation remained elevated. Monday’s curve action was more consistent with some compression in long-end inflation and term-premium pressure as crude oil fell, while the near-term policy-rate anchor stayed firm.
Oil was the most relevant cross-asset input for equity rotation. Brent crude settled at $100.34 a barrel, down 3.4%, as markets responded to the possibility of diplomatic progress around Middle East talks at the United Nations. Lower crude reduced immediate inflation pressure at the margin, helped long-duration equities through lower bond yields, and simultaneously weakened earnings sensitivity in the Energy sector. The linkage was unusually clean: lower oil supported the broad index while directly hurting the day’s worst-performing sector.
Upcoming Economic Data & Catalysts:
- U.S. Census Bureau Advance Report on Durable Goods, August 2026 (Release date: September 25, 2026): Orders data will be watched for evidence on business investment and manufacturing demand. A material surprise could affect growth expectations and the long end of the Treasury curve, which in turn would matter for equity duration and valuation.
- BEA Personal Income and Outlays, August 2026 (Release date: September 30, 2026): The release includes the PCE price indexes, making it a key test of the inflation backdrop after the Federal Reserve’s September rate increase. Markets will focus on whether inflation momentum supports or challenges the prevailing path for policy rates and corporate discount rates.
Market Insights:
The September 21 advance was broader than a single-stock rally, but it was not an equally distributed risk-on move. Positive sector breadth and a 1.4-to-1 advance-decline ratio show genuine participation, yet the 2.26% Nasdaq gain, the roughly 0.5% Russell 2000 rise and the much smaller equal-weight S&P move show that the bulk of index-level upside came from large growth stocks. The most important reversal risks are a renewed rise in oil or Treasury yields, deterioration in breadth, weaker AI-related earnings revisions, policy surprises, or a sustained VIX break higher from the mid-teens. Richer prices after a sharp one-day re-rating also raise the cost of execution mistakes for the market’s highest-momentum names.
Trading & Investment Strategy:
Risk management argues for separating the positive macro impulse from the concentration risk embedded in the tape. Investors seeking exposure to the trend can consider staged entries rather than chasing a one-day gap, keep position sizes smaller in high-beta AI names, and favor companies where revenue growth, margin structure and guidance provide measurable support for the narrative. Diversifying across growth and less rate-sensitive cash-generative exposures can reduce dependence on a single yield regime. For tactical positions, predefined exit levels and portfolio-level risk limits remain important because a reversal in oil, yields or volatility could quickly compress the valuation expansion that drove Monday’s leaders.
4. Key FAQs About the US Stock Market Today
Why did the US stock market move on September 21, 2026?
U.S. stocks rallied because three supportive forces aligned: AI and semiconductor shares re-accelerated, the 10-year Treasury yield fell below 5%, and crude oil declined sharply. That combination reduced discount-rate and inflation pressure while directing capital toward large-cap growth. The move was reinforced by strong gains in AMD, Meta, Intel and Arm, although the unchanged 2-year Treasury yield showed that markets were not broadly pricing away the Federal Reserve’s tighter near-term policy stance.
Which sectors performed best and worst in the US stock market on September 21, 2026?
Communication Services was the strongest S&P 500 sector, rising 4.16%, followed by Information Technology at 2.4%. Energy was the weakest sector as crude prices fell sharply; the XLE sector proxy declined 2.57%. The rotation favored AI-linked growth and platform companies while reducing exposure to oil-price-sensitive earnings.
What should investors watch after the US stock market close on September 21, 2026?
The next tests are whether the 10-year Treasury yield can remain below 5%, whether market breadth improves enough to validate the cap-weighted index rally, and whether volatility stays contained despite upcoming event risk. The September 25 durable-goods report and September 30 PCE inflation data are the most important confirmed macro releases in the near-term calendar. At the company level, investors should also distinguish durable earnings revisions from momentum-driven AI re-rating, particularly after double-digit one-day moves in major index constituents.
Disclaimer: This article is intended solely for the exchange of investment ideas and does not constitute investment advice of any kind.