Key Takeaways
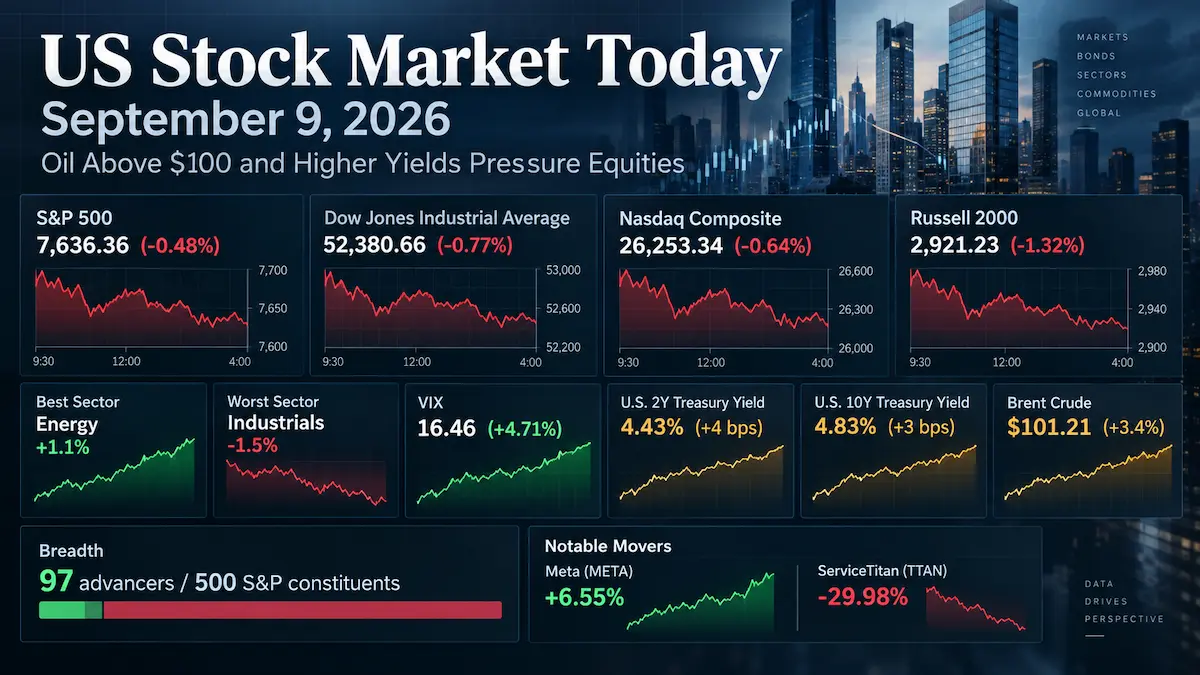
- The S&P 500 fell 0.48% to 7,636.36, the Dow Jones Industrial Average lost 0.77% to 52,380.66, and the Nasdaq Composite declined 0.64% to 26,253.34. Small caps were hit harder, with the Russell 2000 down 1.32% to 2,921.23.
- Brent crude rose 3.4% to $101.21 a barrel as escalating U.S.-Iran hostilities around the Strait of Hormuz intensified global supply concerns. Energy was the only positive S&P 500 sector, up 1.1%, while Industrials were the weakest, down 1.5%.
- Market breadth was materially worse than the headline S&P 500 move: only 97 of 500 constituents advanced, while the Invesco S&P 500 Equal Weight ETF fell 0.96%. Meta’s 6.55% rally therefore masked part of the underlying risk-off tape.
- The Cboe VIX closed at 16.46, up 0.74 point or 4.71%. Official U.S. Treasury par yields rose to 4.43% on the 2-year note and 4.83% on the 10-year note, up 4 and 3 basis points, respectively, from September 8.
- Company-specific dispersion remained extreme: Meta rallied after launching its Muse personal AI agent, while ServiceTitan fell 29.98% after investors focused on near-term revenue timing and transaction-volume headwinds disclosed with its fiscal second-quarter results.
1. Market Capital Flows and Sector Rotation
The session was a broad risk-reduction day rather than a simple mega-cap selloff. The S&P 500 Energy sector gained 1.1% as crude prices repriced the cash-flow outlook for producers, but the other ten sectors finished lower. Industrials fell 1.5%, the weakest sector, as investors reduced exposure to economically sensitive businesses facing a combination of higher financing costs, higher fuel and input costs, and less forgiving valuations. The Russell 2000’s 1.32% decline versus the S&P 500’s 0.48% loss also showed a clear large-cap advantage over small caps.
The cyclical-versus-defensive split was not conventional. Energy benefited from the commodity shock, yet other cyclicals, including Industrials and Consumer Discretionary, were weak. Traditional defensive exposure did not offer uniform protection because rising Treasury yields also pressured rate-sensitive groups. Growth-heavy benchmarks held up somewhat better than the Dow, but that relative resilience was concentrated rather than broad: Meta’s surge cushioned the capitalization-weighted indexes, while only 97 S&P 500 members advanced and the equal-weight RSP ETF fell 0.96%, twice the S&P 500’s percentage decline.
Institutional Flow Insight: The pattern is consistent with investors trimming risk budgets while preserving selective exposure to earnings streams that can benefit from the oil shock or defend margins. Higher front-end and long-end yields raise the discount rate applied to long-duration equities and increase refinancing sensitivity for smaller companies. At the same time, the move in Energy can be understood as both an earnings revision trade and a partial inflation hedge. With two major U.S. inflation releases due over the next two sessions, institutions may also have had an incentive to reduce rate-sensitive exposure without moving wholesale into cash. That is an interpretation of the cross-asset pattern, not a confirmed measure of institutional order flow.
2. Decoding the Biggest Market Movers
Meta Platforms (META)
Meta Platforms closed at $653.69, up 6.55%, after the company introduced Muse, a personal AI agent designed to execute tasks across apps and the web, including actions such as sending email and booking travel, subject to user permissions. The product runs in a dedicated Muse Secure VM and is rolling out in the United States across iOS, Android and the web. The market reaction was important because it attached a tangible consumer product to an AI investment thesis that had previously depended heavily on future monetization.
The latest official financial context supports why investors treated the launch as more than a product demo. Meta reported second-quarter 2026 revenue of $60.801 billion, up 28% year over year, with a 31% operating margin and diluted EPS of $6.18. Management guided third-quarter revenue to $61 billion-$64 billion and maintained 2026 capital-expenditure guidance of $130 billion-$145 billion. On the official July earnings call, management said personal agents were intended to become a foundation for the company’s next wave of products and revenue lines. Muse therefore narrows part of the execution gap between heavy AI infrastructure spending and a consumer-facing monetization path, although adoption, unit economics and subscription conversion remain unproven.
For Communication Services and the major indexes, Meta’s rally mattered disproportionately: it helped cushion what otherwise would have been a deeper capitalization-weighted decline. The broader read-through is more selective than a blanket bullish signal for AI. Investors rewarded a mega-cap company that paired large infrastructure spending with an identifiable distribution advantage and a new product surface; the same session showed that software companies with less visible near-term revenue durability could be punished severely.
ServiceTitan (TTAN)
ServiceTitan closed at $57.12, down 29.98%, following its fiscal second-quarter 2027 results. The official release showed revenue of $292.8 million, up 21% year over year, GAAP operating margin of -9.4%, non-GAAP operating margin of 15.2%, GAAP diluted loss per share of $0.26 and non-GAAP diluted EPS of $0.40. Non-GAAP free cash flow was $50.5 million. Those figures show that the selloff was not simply a reaction to weak current-quarter profitability.
The more consequential issue was the near-term growth cadence disclosed in the company’s official earnings-call prepared remarks. Gross transaction volume was $26.8 billion, up 17%, but management said normalized GTV growth was about 200 basis points below recent quarters, primarily because of lower job growth among existing customers. Management also said the shift toward its Max product creates a $2 million-$3 million subscription-revenue headwind over the remainder of the fiscal year because of billing and revenue-recognition timing, plus roughly another $2 million reduction in professional-services revenue from waived onboarding fees for existing customers transitioning to Max.
ServiceTitan guided fiscal third-quarter revenue to $285 million-$287 million and non-GAAP operating income to $29 million-$30 million. For fiscal 2027, it guided revenue to $1.139 billion-$1.144 billion and non-GAAP operating income to $152 million-$154 million. The market’s response suggests that, in a higher-yield environment, investors are assigning greater weight to near-term revenue visibility and transaction-volume sensitivity even when margin expansion and free-cash-flow generation are improving. For high-multiple application software, that raises the bar for companies whose growth depends on customer activity levels or whose product transitions temporarily delay recognized revenue.
3. Macro Indicators and Market Outlook
The Cboe VIX closed at 16.46, up 0.74 point or 4.71%. The rise was directionally consistent with weaker equities and indicates greater demand for index protection as investors faced simultaneous geopolitical, commodity and rate risks. However, a mid-teens VIX is still more consistent with elevated hedging demand than with disorderly market stress. The more important signal is whether volatility continues to rise while market breadth weakens, because that combination would imply that the risk reduction is becoming more persistent.
Official U.S. Treasury daily par yields put the 2-year note at 4.43% on September 9, up from 4.39% on September 8, and the 10-year at 4.83%, up from 4.80%. The 2s10s curve therefore remained positively sloped at roughly 40 basis points, marginally flatter on the day. The front-end move is consistent with investors demanding more compensation for near-term inflation and policy uncertainty, while the 10-year move reflects a mix of inflation risk, growth uncertainty, Treasury supply and term-premium considerations. The Treasury also announced a buyback of up to $6 billion of longer-dated debt, yet long yields still rose. A one-day yield move should not be treated as proof of a specific Federal Reserve rate decision.
Oil provided the clearest cross-asset explanation for the equity rotation. Brent crude rose 3.4% to $101.21 a barrel as supply risks around the Strait of Hormuz escalated. That move simultaneously improved the near-term revenue outlook for Energy producers and increased the risk of higher transportation, manufacturing and consumer costs elsewhere. The equity market consequently treated the oil spike as an earnings redistribution rather than as a uniformly positive inflation hedge.
Upcoming Economic Data & Catalysts:
- Producer Price Index for August 2026 (Release date: September 10, 2026, 8:30 a.m. ET): Investors will focus on whether pipeline inflation is broadening across goods and services. Because the report covers August, it will not capture the full September oil spike, but it will establish the inflation baseline against which the new energy shock is assessed.
- Consumer Price Index for August 2026 (Release date: September 11, 2026, 8:30 a.m. ET): Core services, shelter and goods inflation will be central to Treasury-yield and Federal Reserve policy pricing. As with PPI, the data predate the latest oil move, so the key question is whether underlying inflation was already firm before the new commodity shock.
Only officially scheduled post-close catalysts are included above; no consensus forecasts are used.
Market Insights:
The day’s decline was broad, even though the headline S&P 500 loss was less than 0.5%. Small caps underperformed, equal-weight stocks fell almost twice as much as the capitalization-weighted S&P 500, and only a small minority of index members advanced. Meta’s sharp gain prevented the headline indexes from fully reflecting that weakness. The trend would become more fragile if Treasury yields accelerate higher, oil extends its supply-shock move, equal-weight breadth fails to stabilize, earnings estimates are cut, or VIX breaks materially above its recent range. Conversely, stabilization in yields and a recovery in market breadth would make the index-level pullback more consistent with rotation than with a deeper de-risking cycle.
Trading & Investment Strategy:
Risk management should take priority over chasing the strongest one-day moves. Position sizes can be kept below normal when oil and rates are moving together, with new exposure added in stages rather than all at once. Energy can retain tactical support while supply risk remains elevated, but gap-up entries should be evaluated against commodity reversal risk. In growth, companies with visible cash flow, distribution advantages and credible AI monetization paths deserve a different risk budget from high-multiple software names with near-term revenue timing or demand sensitivity. Small caps and other rate-sensitive exposures require a larger valuation margin of safety while front-end yields are rising. For active positions, use pre-defined thesis and volatility-based stop levels, avoid averaging into deteriorating fundamentals, and do not treat a single session’s price action as a durable trend signal.
4. Key FAQs About the US Stock Market Today
Why did the US stock market move on September 9, 2026?
U.S. stocks fell because the market had to absorb two linked macro shocks: Brent crude moved above $100 as Middle East supply risks intensified, and Treasury yields rose as investors repriced inflation and policy uncertainty. The oil move favored Energy but raised cost and margin concerns for much of the rest of the market. Company-specific dispersion amplified the tape, with Meta rallying on Muse while ServiceTitan plunged after its earnings update.
Which sectors performed best and worst in the US stock market on September 9, 2026?
Energy was the best S&P 500 sector, rising 1.1%, and was the only sector to finish higher. Industrials were the weakest, falling 1.5%. The rotation reflected the direct earnings benefit of higher crude prices for producers versus the combined pressure of higher input costs, higher yields and weaker risk appetite on economically sensitive businesses.
What should investors watch after the US stock market close on September 9, 2026?
The next major macro catalysts are the August Producer Price Index on September 10 and the August Consumer Price Index on September 11, both at 8:30 a.m. ET. Investors should also watch whether the 2-year and 10-year Treasury yields continue rising, whether Brent holds above $100, and whether equal-weight S&P 500 breadth begins to recover. A headline index rebound without broader participation would leave concentration risk unresolved.
Disclaimer: This article is intended solely for the exchange of investment ideas and does not constitute investment advice of any kind.