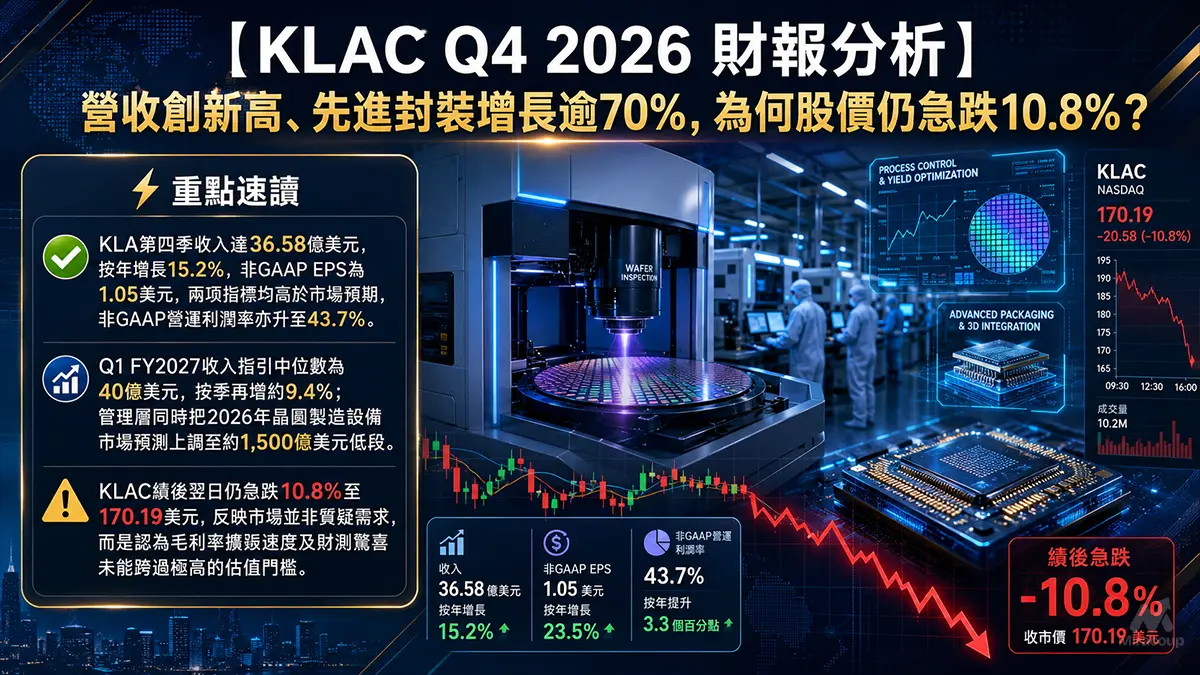
⚡ Key Takeaways
- KLA delivered record fiscal Q4 2026 revenue of $3.658 billion, representing 15.2% year-over-year growth and beating the FactSet consensus estimate of approximately $3.61 billion.
- Non-GAAP EPS reached a split-adjusted $1.05, 5% above the $1.00 consensus, while non-GAAP operating margin expanded to 43.7%.
- The fundamental outlook remains robust, but the valuation bar is demanding: at approximately $184 per share, KLAC trades at roughly 49 times fiscal 2026 non-GAAP EPS.
KLA Corporation reported its fiscal fourth-quarter 2026 results for the three months ended June 30, 2026. The headline numbers were solid: record revenue, a clean EPS beat, improving operating leverage and above-consensus fiscal Q1 2027 guidance.
However, this was not a simple “beat-and-raise” celebration. The market had already priced in an aggressive AI capital-expenditure cycle, sustained process-control share gains and meaningful margin expansion. As a result, investors are now scrutinising the conversion of KLA’s record backlog into revenue, free cash flow and earnings—not merely whether demand remains strong.
Important accounting note: KLA completed a ten-for-one stock split on June 11, 2026. All EPS and share-count figures in the company’s earnings materials were retroactively adjusted. Fiscal Q4 2026 non-GAAP EPS was therefore $1.05, not $10.50.
Part 1: Core Earnings Breakdown
1. Revenue and Profitability Analysis
KLA generated $3.658 billion in fiscal Q4 2026 revenue, compared with $3.415 billion in the preceding quarter and $3.175 billion in the same period last year.
- Year-over-year growth: 15.2%
- Sequential growth: 7.1%
- GAAP net income: $1.363 billion, up 13.3% year over year
- GAAP diluted EPS: $1.04
- Non-GAAP net income: $1.386 billion
- Non-GAAP diluted EPS: $1.05
- Non-GAAP gross margin: 62.4%
- Non-GAAP operating margin: 43.7%
The 43.7% non-GAAP operating margin was particularly important. It increased from 42.6% in the March quarter and exceeded the approximately 43.2% margin implied by management’s previous revenue, gross-margin and operating-expense assumptions.
Quick take: KLA is demonstrating genuine operating leverage, but its gross-margin trajectory remains constrained by memory-component inflation, tariffs and product mix. The quarter was operationally strong rather than spectacular relative to the valuation already attached to the shares.
Revenue by Reportable Segment
Business Segment | Q4 FY2026 Revenue | Share of Total Revenue | Year-over-Year Growth |
|---|---|---|---|
Semiconductor Process Control | $3.257 billion | 89.0% | 13.2% |
Specialty Semiconductor Process | $159.7 million | 4.4% | 12.6% |
PCB and Component Inspection | $241.1 million | 6.6% | 56.5% |
Semiconductor Process Control remains the economic engine, contributing approximately 89% of revenue. Nevertheless, the fastest-growing reportable business was PCB and Component Inspection, where revenue surged by more than 56% year over year.
This is not merely a low-base statistical effect. High-performance computing is increasing the value and complexity of substrates, printed circuit boards and finished chip packages, creating more stringent inspection and testing requirements.
Product and Services Mix
- Product revenue: $2.837 billion, up 14.8% year over year and representing 77.6% of total revenue.
- Services revenue: $820.4 million, up 16.8% year over year and representing 22.4% of total revenue.
KLA Services is strategically more valuable than its 22% revenue contribution may suggest. Management disclosed that approximately 80% of Services revenue is contract-based, giving the group a recurring revenue anchor and better visibility through semiconductor capital-equipment cycles.
Quick take: The core systems business captures AI-related capital expenditure, while Services monetises the expanding installed base for years after shipment. This combination supports both growth and earnings resilience.
2. Expectations vs. Actual Results
Metric | Actual Result | Expectation or Benchmark | Variance | Result |
|---|---|---|---|---|
Total Revenue | $3.658 billion | Approximately $3.61 billion FactSet consensus | Approximately 1.3% above consensus | ✅ Beat |
Non-GAAP Diluted EPS | $1.05 | $1.00 consensus | 5.0% above consensus | ✅ Beat |
Non-GAAP Operating Margin | 43.7% | Approximately 43.2% implied by prior company guidance | Approximately 55 basis points higher | ✅ Above Implied Guidance |
Non-GAAP Gross Margin | 62.4% | 61.75% guidance midpoint | Approximately 65 basis points higher | ✅ Beat |
The operating-margin benchmark is calculated from KLA’s previous guidance midpoint of $3.575 billion in revenue, 61.75% non-GAAP gross margin and approximately $665 million of non-GAAP operating expenses. It is not presented as a published Wall Street operating-margin consensus.
Fiscal Q1 2027 Guidance
Metric | KLA Guidance | Pre-Report Consensus | Assessment |
|---|---|---|---|
Revenue | $4.0 billion ± $200 million | Approximately $3.92 billion | ✅ Midpoint approximately 2.0% above LSEG consensus |
Non-GAAP EPS | $1.16 ± $0.10 | Approximately $1.14 | ✅ Midpoint approximately 1.8% above LSEG consensus |
Non-GAAP Gross Margin | 62.5% ± 1 percentage point | Not disclosed | Broadly stable despite higher revenue |
GAAP EPS | $1.14 ± $0.10 | Not disclosed | Positive sequential earnings trajectory |
The fiscal Q1 2027 revenue midpoint implies approximately 9.4% sequential growth. With non-GAAP operating expenses expected at roughly $690 million, the guidance also points to further operating-profit expansion.
The market’s hesitation is therefore not caused by weak guidance. The more likely issue is that investors expected a larger beat or more visible gross-margin upside after the stock’s substantial rerating during the AI equipment cycle.
3. Earnings Call Highlights
- “Momentum across our business [is] accelerating in the second half of calendar 2026.” 💡 Reading Between the Lines: Demand is no longer the key debate. The valuation now depends on KLA converting customer schedules and long-lead supply into sequential shipments. Any slippage in factory readiness or component availability would challenge the earnings ramp currently embedded in the multiple.
- “RPO, or backlog, would be about $12.5 billion.” 💡 Reading Between the Lines: Backlog is approximately 3.4 times the latest quarter’s revenue, giving KLA exceptional visibility into 2027. However, large backlog also requires working-capital investment and creates execution risk when optical components carry lead times of up to 18 to 24 months.
- “When we’re 6x our nearest rival.” 💡 Reading Between the Lines: KLA is not competing solely on equipment specifications. Its moat combines proprietary optics, algorithms, process data, applications engineering and decades of customer integration. This winner-takes-most structure supports premium margins and makes displacement significantly harder than in more commoditised equipment categories.
Part 2: Deep Business Insights
1. Hidden Key Metrics That Matter More Than the Headline Beat
Backlog Visibility Is Exceptional, but Supply Conversion Is the Real Bottleneck
Management expects remaining performance obligations, or backlog, to reach approximately $12.5 billion. This represents roughly 3.4 times fiscal Q4 revenue and is one of the strongest indicators supporting KLA’s confidence in calendar 2027.
The catch is that backlog does not automatically become revenue. KLA indicated that overall lead times remain around 12 months, with certain products requiring 18 to 24 months. Optical components appear to be one of the key gating items.
This means the company’s near-term growth ceiling may be determined by supplier capacity and shipment timing rather than end-customer demand. The bull case requires KLA to secure long-lead components early without creating excess inventory if industry spending later normalises.
Free Cash Flow Did Not Keep Pace With Earnings
Fiscal Q4 free cash flow was $817.1 million, down approximately 23% from $1.065 billion in the prior-year quarter. Quarterly free-cash-flow margin fell to approximately 22.3%, despite revenue growing by more than 15%.
For the full fiscal year, revenue increased 11.7%, while free cash flow rose by only 0.5% to $3.767 billion. The divergence was driven by working-capital requirements:
- Accounts receivable: $2.889 billion, up 27.6% year over year.
- Inventory: $3.649 billion, up 13.6% year over year.
- Quarterly accounts-receivable cash outflow: $586.5 million.
- Quarterly inventory cash outflow: $212.3 million.
This does not indicate a demand collapse. It is consistent with a company preparing for higher shipment volumes and managing long-lead supply. Nevertheless, the quality of the next earnings leg will depend on free cash flow catching up with reported profit.
Why Customers Continue to Choose KLA
KLA’s competitive advantage is built around the economics of yield rather than the sticker price of an inspection tool. At advanced nodes, a small improvement in defect detection or time-to-yield can be worth far more to a customer than the equipment purchase price.
- High-mix, low-volume engineering: Process-control systems must be adapted to different process steps, device architectures and customer roadmaps.
- Algorithmic and data advantage: KLA combines optical hardware with defect classification, simulation, analytics and noise-suppression software.
- Applications support: The company employs approximately 1,600 to 1,700 applications engineers globally, creating deep customer-level integration.
- Portfolio breadth: Customers can combine inspection, metrology, reticle, data analytics and service solutions across research, ramp and high-volume manufacturing.
- Installed-base economics: Higher equipment utilisation increases the value of service contracts, upgrades and productivity optimisation.
The advanced-packaging opportunity demonstrates the strength of this model. KLA raised its calendar 2026 advanced-packaging process-control systems revenue forecast to approximately $1.1 billion, representing growth of more than 70%.
Management indicated that much of this expansion came from customers pulling existing front-end technologies into packaging applications. Because KLA can reuse portions of its established product portfolio, the incremental revenue opportunity may require less additional research and development than a completely new product category.
2. Semiconductor Supply-Chain Reactions
✅ Lam Research: Positive Read-Through From a Larger WFE Market
KLA raised its calendar 2026 wafer equipment market outlook, including advanced packaging, from more than $140 billion to the low-$150-billion range. Management also described broad-based investment across leading-edge logic, conventional DRAM, HBM, NAND and advanced packaging extending into 2027.
This is a constructive read-through for Lam Research, whose etch and deposition systems are required as manufacturers add more complex three-dimensional structures, additional process steps and advanced-memory capacity. KLA’s customer visibility suggests the equipment upcycle is broadening beyond a single foundry or AI accelerator programme.
❌ Applied Materials: Process-Control Competition Remains Challenging
The overall WFE outlook is also positive for Applied Materials. However, KLA’s comments imply continued competitive pressure on Applied Materials specifically within process control and electron-beam inspection.
KLA stated that it continues to gain share and maintains an overall process-control position approximately six times that of its nearest competitor. Applied Materials can still benefit from growth in deposition, materials engineering and broader fab spending, but displacing KLA in its core inspection franchises remains a difficult proposition.
The correct interpretation is therefore nuanced: the rising WFE tide benefits both companies, while KLA’s process-control moat limits Applied Materials’ ability to capture the highest-margin inspection opportunities.
3. Valuation Framework and Potential Risks
KLAC traded at approximately $184.16 on July 30, 2026 at 10:10 a.m. Eastern Time. Based on fiscal 2026 non-GAAP diluted EPS of $3.76, the shares were valued at roughly:
- 49.0 times trailing non-GAAP EPS
- 50.3 times trailing GAAP EPS
- Approximately $243 billion in implied equity value, based on the fiscal-year diluted share count
The stock remained approximately 3.5% below its $190.80 pre-earnings closing price, even after rebounding from an intraday low of $170.09. The tape’s message is clear: the market accepts the AI and process-control growth thesis, but it is no longer prepared to reward a routine beat with further multiple expansion.
What the Current Valuation Is Pricing In
- Strong sequential revenue growth through the remainder of calendar 2026.
- Continued significant WFE growth during calendar 2027.
- Further process-control market-share gains.
- Advanced-packaging revenue materially outgrowing the underlying market.
- Services growth remaining within or above the long-term 13% to 15% range.
- Operating leverage offsetting tariffs, component inflation and mix pressure.
At approximately 49 times trailing adjusted earnings, KLAC is priced as a structural compounder rather than a conventional cyclical equipment stock. That quality premium is supported by KLA’s moat, margins and recurring Services revenue. It also leaves limited room for execution mistakes.
Key Risks
- Gross-margin stagnation: Fiscal Q1 revenue is expected to increase sharply, but the gross-margin midpoint is only modestly higher at 62.5%.
- Memory-component inflation: Management expects elevated DRAM-related input costs to remain a gross-margin headwind, potentially into 2027.
- Supply-chain execution: Optical and other specialised components have lead times reaching 18 to 24 months.
- Working-capital pressure: Receivables and inventory are expanding faster than free cash flow.
- China restrictions: Export controls can prevent KLA from competing for certain opportunities even when underlying customer demand remains healthy.
- Customer concentration: The timing of a limited number of large customer projects can create quarterly volatility.
- Valuation compression: A small earnings miss could have an outsized share-price impact because the current multiple already discounts substantial future growth.
Bottom line: KLA’s fiscal Q4 2026 results reinforced the company’s position as one of the highest-quality assets in semiconductor equipment. Revenue, EPS, gross margin and operating margin all cleared their respective benchmarks, while backlog and fiscal Q1 guidance support continued growth.
The central investment debate is no longer whether AI will drive more process-control demand. It is whether KLA can convert its $12.5 billion backlog into revenue and free cash flow quickly enough to justify a premium valuation approaching 49 times trailing adjusted earnings.
The business remains exceptionally strong. The share price, however, requires near-exceptional execution.
Part 3: Key FAQs
Did KLAC beat Q4 2026 earnings estimates?
Yes. KLA reported fiscal Q4 2026 revenue of $3.658 billion versus a FactSet consensus estimate of approximately $3.61 billion. Split-adjusted non-GAAP EPS was $1.05 versus the $1.00 consensus estimate. Non-GAAP gross margin of 62.4% also exceeded the company’s previous 61.75% guidance midpoint.
What is KLA’s Q1 FY2027 guidance after its Q4 2026 earnings report?
KLA guided for fiscal Q1 2027 revenue of $4.0 billion, plus or minus $200 million. Non-GAAP EPS is expected to be $1.16, plus or minus $0.10, while non-GAAP gross margin is expected to be 62.5%, plus or minus one percentage point. The revenue and EPS guidance midpoints were above the pre-report LSEG consensus estimates.
Is KLAC stock expensive after the Q4 2026 earnings report?
At approximately $184 per share, KLAC trades at roughly 49 times fiscal 2026 non-GAAP EPS of $3.76. The multiple reflects KLA’s dominant process-control position, recurring Services revenue, advanced-packaging growth and visibility into 2027. It also means the stock is vulnerable if revenue conversion, margins or free cash flow fall short of elevated expectations.
Sources
Financial results and company guidance were verified using the official KLA fiscal Q4 2026 earnings release and the official KLA earnings webcast page. Consensus guidance comparisons were cross-checked against Reuters, while management’s earnings-call remarks were checked against the fiscal Q4 2026 earnings call transcript.
Disclaimer: This article/chart is for educational and informational purposes only and does not constitute investment advice of any kind. Past performance is not indicative of future results. Investors should independently evaluate their own risks.