⚡ Key Takeaways
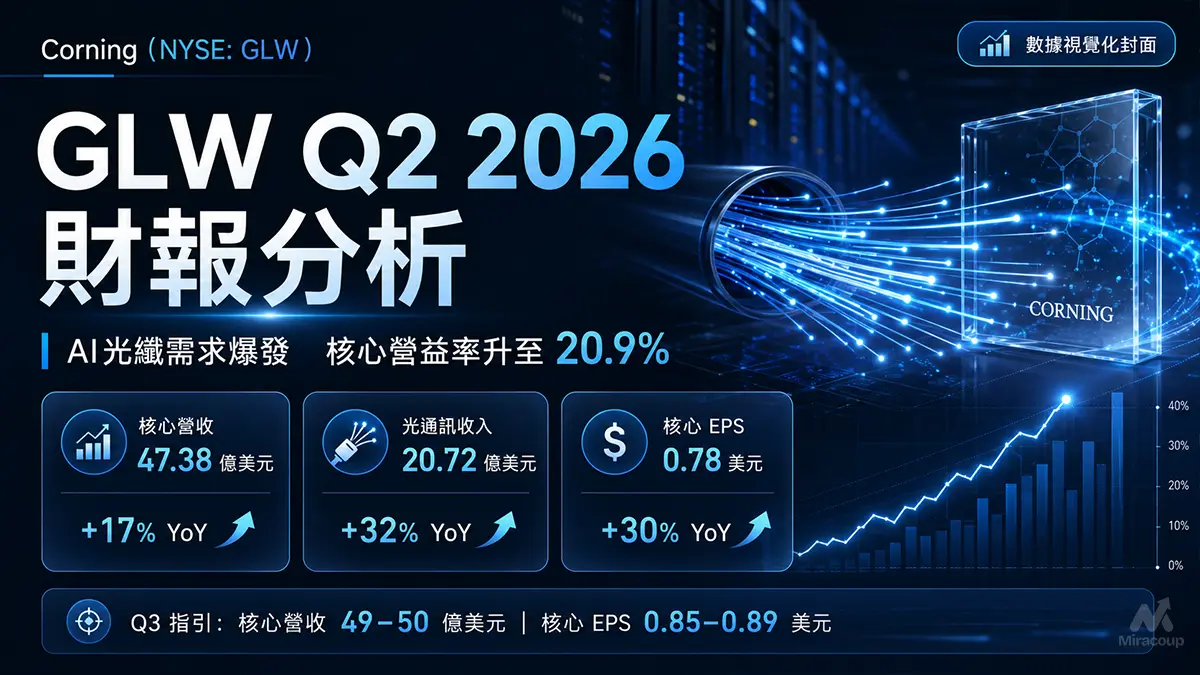
- Headline beat: Corning delivered Q2 core sales of $4.738 billion and core EPS of $0.78, beating FactSet consensus of $4.63 billion and $0.76, respectively.
- Earnings quality improved: Core operating margin expanded 190 basis points to 20.9%, while Optical Communications grew sales 32% and net income 77%.
- The valuation debate has shifted: Q3 revenue guidance merely brackets consensus, while GLW trades at approximately 47 times trailing core EPS. The market is demanding near-flawless execution from Corning’s AI capacity build-out.
Part 1: Core Earnings Breakdown
1. Revenue and Profitability Analysis
Corning reported Q2 2026 GAAP sales of $4.505 billion, up 17% year over year, and core sales of $4.738 billion, also up 17%. Core EPS increased 30% to $0.78, materially outpacing revenue growth and confirming continued operating leverage.
- GAAP EPS: $0.64, up 19% year over year.
- Core gross margin: 39.6%, up 120 basis points.
- Core operating margin: 20.9%, up 190 basis points.
- Core return on invested capital: 14.9%, up 180 basis points.
- Operating cash flow: $1.717 billion.
- Adjusted free cash flow: $1.42 billion.
Business Segment | Q2 Sales | Share of Core Sales | YoY Growth | Buy-Side Read-Through |
|---|---|---|---|---|
Optical Communications | $2.072 billion | 43.7% | +32% | The main earnings engine. Net income surged 77% to $438 million as high-density AI products drove a richer mix and superior operating leverage. |
Glass Innovations | $1.463 billion | 30.9% | +1% | Top-line growth was pedestrian, but net income rose 9%, suggesting pricing, premium-product mix and cost control protected profitability. |
Automotive | $471 million | 9.9% | +2% | A steady contributor rather than a near-term re-rating catalyst. Net income increased 4% to $82 million. |
Solar | $438 million | 9.2% | +90% | Revenue nearly doubled, but the segment recorded a $7 million loss following maintenance and equipment upgrades. Q3 profitability is the next proof point. |
Life Sciences and Emerging Growth Businesses | $294 million | 6.2% | -15% | The weakest portfolio component, with a $21 million net loss. It remains a drag on consolidated mix despite its relatively small revenue contribution. |
Bottom line: This was not merely an AI-driven revenue beat. Corning converted 17% sales growth into 30% EPS growth, demonstrating that Optical Communications is changing the company’s consolidated margin structure.
2. Expectations vs. Actual Results
The consensus figures below refer to FactSet estimates reported immediately after the earnings release. Different data providers may show minor variations depending on their analyst cut-off time.
Metric | Actual or Guidance | Consensus or Benchmark | Variance | Result |
|---|---|---|---|---|
Q2 Core Sales | $4.738 billion | $4.63 billion | Approximately +2.3% | ✅ Beat |
Q2 Core EPS | $0.78 | $0.76 | Approximately +2.6% | ✅ Beat |
Q2 Core Operating Margin | 20.9% | Company benchmark of at least 20% | At least +90 basis points | ✅ Above company benchmark |
Q3 Core Sales Guidance | $4.9 billion to $5.0 billion | $4.99 billion | Midpoint of $4.95 billion is approximately 0.8% below consensus | ⚠️ Range brackets consensus, but midpoint is slightly soft |
Q3 Core EPS Guidance | $0.85 to $0.89 | $0.85 | Midpoint of $0.87 is approximately 2.4% above consensus | ✅ Midpoint above consensus |
Q3 Operating Margin | No quarterly numerical guidance | Management expects at least 20% over the planning period | Not directly comparable | ➖ Margin discipline reiterated |
Verdict: Q2 was a genuine beat, but Q3 guidance was not strong enough to clear the elevated buy-side whisper numbers embedded in GLW’s pre-earnings valuation. The revenue midpoint, rather than the EPS range, became the focal point of the post-results derating.
3. Earnings Call Highlights
- “If we could make more, we could sell more.” 💡 Reading Between the Lines: The immediate constraint is manufacturing capacity rather than end-demand. Corning’s approximately $2 billion 2026 capital expenditure programme is therefore designed to convert existing demand into revenue, but it also raises the execution bar for factory ramps, yields and customer delivery schedules.
- “We are not yet seeing scale-up or photonics in our results.” 💡 Reading Between the Lines: Q2’s 65% Enterprise Networks growth and near-doubling of Gen AI-related sales came predominantly from scale-out infrastructure. Optical scale-up and in-box photonics remain valuation options rather than current earnings contributors, making adoption timing the largest swing factor in longer-term forecasts.
- “Operating margin at or above 20%.” — CFO strategic message 💡 Reading Between the Lines: Management is presenting 20% as a new operating-margin floor rather than a cyclical peak. Sustaining that level while simultaneously accelerating capital investment would support earnings growth ahead of sales and justify part of GLW’s premium multiple.
Part 2: Deep Business Insights
1. Hidden Key Metrics the Market Should Not Ignore
Hidden Metric No. 1: More than half of Q2 operating cash flow came from customer deposits and government incentives.
Corning’s cash-flow statement recorded a $880 million inflow from customer deposits and government incentives, equivalent to just over 51% of Q2 operating cash flow of $1.717 billion.
This is strategically positive because it confirms that customers and public-sector programmes are helping finance capacity expansion, reducing the amount of capital Corning must place at risk independently. However, it also means investors should not simply annualise the quarter’s $1.42 billion adjusted free cash flow. Part of the cash generation reflects expansion-related funding and working-capital timing rather than recurring quarterly earnings conversion.
Hidden Metric No. 2: Optical Communications’ profit growth was more than twice its revenue growth.
Optical Communications generated a Q2 net-income margin of approximately 21.1%, compared with roughly 15.8% one year earlier. That represents an expansion of approximately 540 basis points.
- Optical Communications sales increased 32%.
- Optical Communications net income increased 77%.
- Enterprise Networks sales reached $1.27 billion, up 65%.
- The portion of Enterprise sales related to AI data centres nearly doubled.
The key point is that Corning is not merely shipping more commodity fibre. It is capturing a larger share of customer economics through high-density cable, connectivity systems and integrated optical solutions.
Why customers choose Corning: Hyperscalers require more than raw fibre supply. They need high-density systems that reduce installation cost, accelerate deployment and improve network reliability. Corning combines fibre science, cable engineering, connectivity hardware, domestic manufacturing capacity and co-development capabilities under one platform. That integrated proposition creates higher switching costs than a conventional component-only supplier can offer.
Long-term agreements with major customers also underpin significant capacity additions and share investment risk. This should improve revenue visibility, capital efficiency and return on invested capital if Corning executes the manufacturing ramps successfully.
2. Supply Chain Read-Through
- ✅ Potential beneficiary: Arista Networks (NYSE: ANET) Corning’s analysis indicates that AI clusters exceeding approximately 130,000 GPUs require a third optical networking layer, potentially increasing fibre content per GPU by 50% versus a two-layer architecture. That supports continued investment in high-speed Ethernet switching, back-end networking and higher-radix systems—areas directly relevant to Arista’s AI networking exposure.
- ❌ Potential pressure: Qualcomm (NASDAQ: QCOM) Corning expects full-year global handheld-device units to decline by a mid-teens percentage as elevated memory costs pressure device economics. This is a negative volume read-through for handset-semiconductor suppliers such as Qualcomm, although premium-device mix and higher content per handset may partially cushion the impact.
The cross-sector message is bifurcated: AI infrastructure demand remains powerful, while consumer-electronics volumes are becoming a more visible offset. Investors should therefore avoid valuing Corning as a pure-play AI optical company.
3. Valuation Framework and Key Risks
GLW’s latest available share price was $135.22 as of July 30, 2026, implying a market capitalisation of approximately $116.5 billion.
Corning generated trailing core EPS of approximately $2.87 across Q3 2025 through Q2 2026. On that basis, the shares trade at approximately:
- 47.1 times trailing core EPS.
- 62.0 times trailing GAAP EPS.
- 6.6 times trailing core sales on a market-capitalisation basis.
This is still a demanding valuation. The market is effectively pricing in sustained high-teens revenue growth, operating margin at or above 20%, successful conversion of the $2 billion capital programme and meaningful future revenue from optical scale-up and photonics.
Illustrative Valuation Multiple | Core EPS Required to Support $135.22 | Increase Versus Trailing Core EPS of $2.87 |
|---|---|---|
30x | $4.51 | Approximately +57% |
35x | $3.86 | Approximately +35% |
40x | $3.38 | Approximately +18% |
The sensitivity table is not a price target. It illustrates how much sustainable earnings growth is required for GLW to maintain its current share price under different valuation regimes.
Key risks:
- Expectation risk: The stock fell 12.1% on the earnings day despite beating Q2 estimates because the market had priced in a more aggressive forward trajectory.
- Capacity-execution risk: Demand may be available, but revenue recognition depends on factory construction, equipment installation, production yields and timely qualification of new capacity.
- Free-cash-flow normalisation: Customer deposits and government incentives substantially supported Q2 operating cash flow, making the quarterly free-cash-flow figure unsuitable for simple annualisation.
- Technology-timing risk: Optical scale-up and photonics may become very large markets, but management acknowledged that the adoption curve and optical-port penetration remain difficult to predict.
- Portfolio offsets: Handheld-device weakness, a loss-making Solar segment and contraction in Life Sciences and Emerging Growth Businesses could dilute Optical Communications’ momentum.
Buy-side conclusion: Corning’s fundamental earnings engine is stronger than the headline share-price reaction suggests. The Q2 beat, margin expansion and AI order momentum were real. However, GLW is no longer valued like a traditional glass and materials company. At approximately 47 times trailing core EPS, the stock is being underwritten as a high-growth AI infrastructure platform. The next re-rating requires evidence that new capacity can translate accelerating orders into revenue without compromising the 20% operating-margin floor or free-cash-flow quality.
Part 3: Key FAQs
Did Corning beat GLW Q2 2026 earnings expectations?
Yes. Corning reported core sales of $4.738 billion versus FactSet consensus of $4.63 billion and core EPS of $0.78 versus consensus of $0.76. Core operating margin also expanded 190 basis points to 20.9%.
Why did GLW stock fall after the Q2 2026 earnings report?
The market focused on forward expectations rather than the Q2 beat. Q3 core-sales guidance of $4.9 billion to $5.0 billion had a midpoint slightly below the $4.99 billion FactSet consensus, while capacity constraints limited the near-term conversion of strong AI demand into revenue. GLW’s premium valuation amplified the negative reaction.
Is GLW stock overvalued after Corning’s Q2 2026 earnings?
At $135.22, GLW trades at approximately 47 times trailing core EPS and 62 times trailing GAAP EPS. That valuation is not cheap and requires sustained high-teens growth, operating margin of at least 20% and successful execution of the company’s AI optical-capacity expansion. The valuation becomes more defensible if scale-up and photonics emerge as material revenue streams, but those opportunities are not yet contributing to reported results.
Source note: Corning’s Investor Relations website publishes the official earnings-call webcast and supporting materials rather than a downloadable official transcript. The written transcript below is a third-party transcription.
Primary sources: Read the official Corning Q2 2026 earnings release, review the official earnings-call webcast and presentation materials, access the official Q2 financial statements and non-GAAP reconciliations, and review the written Q2 2026 earnings-call transcript.
Disclaimer: This article/chart is for educational and informational purposes only and does not constitute investment advice of any kind. Past performance is not indicative of future results. Investors should independently evaluate their own risks.