
重點總結
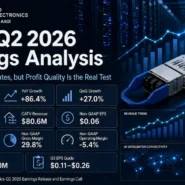
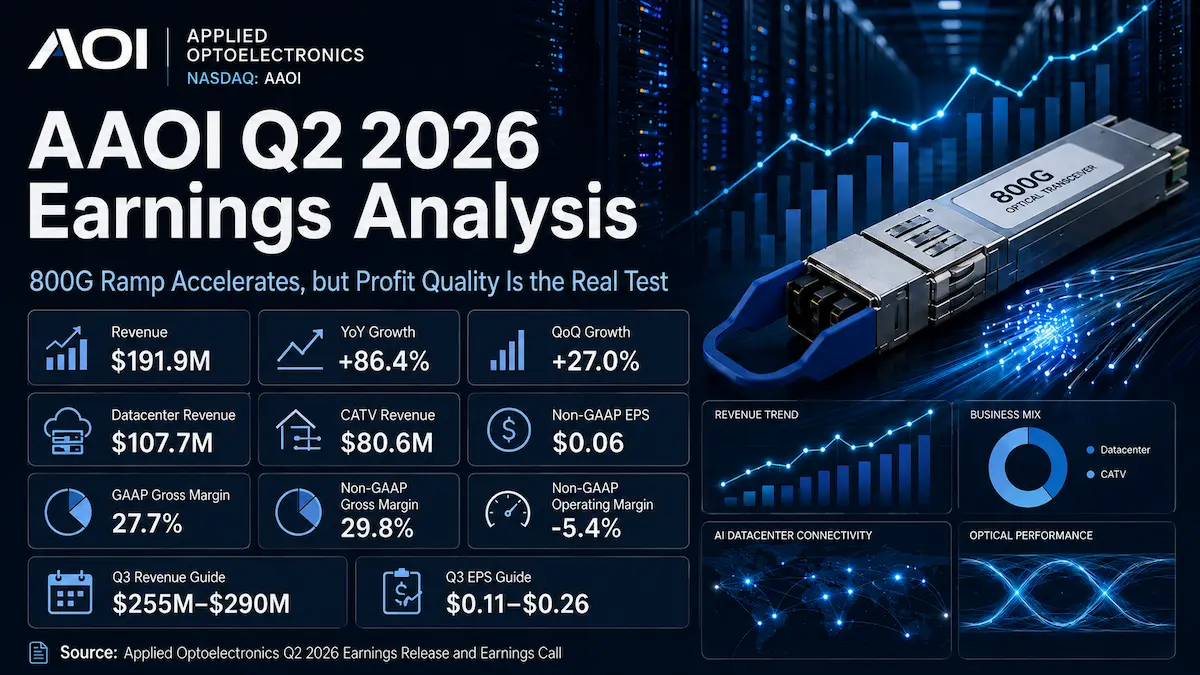
- Applied Optoelectronics reported Q2 2026 revenue of $191.9 million, up 86.4% year over year and 27% sequentially, marking a fifth consecutive quarterly revenue record.
- Datacenter revenue rose 140.4% year over year to $107.7 million, but 800G still represented only 11.9% of datacenter revenue and about 6.7% of total company revenue, showing that the highest-speed product transition is still early.
- Non-GAAP EPS of $0.06 beat both company guidance and public consensus estimates, yet non-GAAP operating loss remained $10.3 million and adjusted EBITDA was negative $0.5 million. The headline earnings beat therefore overstated the improvement in core operating profitability.
- Q3 revenue guidance of $255 million to $290 million implies approximately 42% sequential growth at the midpoint, driven mainly by 800G, while non-GAAP EPS guidance of $0.11 to $0.26 remained below at least one widely cited public consensus estimate at the top end.
- At the August 7 close of $135.63, AAOI traded at roughly 10.4 times management’s approximately $1.1 billion 2026 revenue target. That valuation requires successful capacity execution, rapid 800G/1.6T mix expansion and materially better margins—not merely continued top-line growth.
Core Earnings Breakdown
Revenue and Profitability Analysis
Applied Optoelectronics, Inc. generated Q2 2026 revenue of $191.922 million, versus $102.952 million a year earlier and approximately $151.1 million in Q1 2026. Reported growth was therefore 86.4% year over year and 27% sequentially. The distinction between reported growth and operational progress matters: revenue is scaling at an exceptional rate, but profitability has not yet caught up with the physical expansion of manufacturing capacity, qualification spending and product-mix transition.
- Datacenter revenue was $107.662 million, or 56.1% of total revenue, up 140.4% year over year and 32.3% sequentially. The investment implication is stronger than the headline growth rate because the mix is moving toward 800G and 1.6T, where management expects better long-term economics; however, most Q2 datacenter revenue still came from older 100G through 400G products, so the next-generation thesis is not yet fully reflected in reported sales.
- CATV revenue was $80.578 million, or 42.0% of total revenue, up 43.8% year over year and 20.6% sequentially. CATV is no longer merely a legacy offset to the AI optics story: 1.8GHz amplifiers and early software adoption provide a second growth engine, although the segment also contributes materially to customer concentration because the largest CATV customer represented 42% of total company revenue in Q2.
- Telecom and other revenue totaled approximately $3.7 million, or 1.9% of total revenue. This remains immaterial to the current earnings thesis and does not meaningfully diversify the economic exposure away from hyperscale datacenter and CATV customers.
Within datacenter, the product mix is more revealing than the segment growth rate. Management said 100G represented 38.3% of datacenter revenue, 200G and 400G represented 45.0%, 800G represented 11.9%, and 10G/40G represented 4.4%. Q2 800G revenue was $12.8 million, more than ten times the prior-year level and more than double Q1, while 400G revenue reached $48.4 million and increased more than fourfold year over year. The mix therefore shows two simultaneous realities: the existing 100G/400G franchise is still doing most of the economic work, while 800G is becoming the incremental growth driver.
GAAP gross margin was 27.7%, down from 30.3% a year earlier and 29.1% in Q1. Non-GAAP gross margin was 29.8%, versus 30.4% a year earlier and 29.2% in Q1. The sequential improvement in adjusted gross margin is constructive, but the year-over-year compression shows that revenue growth alone has not yet produced the margin structure investors ultimately need from an AI-optics supplier.
GAAP operating loss was $24.727 million, equivalent to a GAAP operating margin of approximately negative 12.9%. Non-GAAP operating loss was $10.3 million, or an adjusted operating margin of approximately negative 5.4%. Adjusted EBITDA was negative $0.543 million. Those figures are more informative about current operating quality than the positive adjusted EPS headline because they show that the core business had not yet reached operating break-even in Q2.
GAAP net loss widened to $22.8 million, or $0.28 per basic share, from a $9.1 million loss a year earlier. By contrast, non-GAAP net income was $5.5 million, or $0.06 per diluted share, compared with a non-GAAP loss of $8.8 million, or $0.16 per share, in Q2 2025. The GAAP/non-GAAP gap was unusually important this quarter: AOI’s reconciliation included stock-based compensation, discontinued-product costs, non-recurring items and a substantial tax-related adjustment, while management explicitly said the non-GAAP net-income outperformance was largely due to foreign tax benefits and modest government subsidy income.
Expectations vs. Actual Results
Public consensus sources were not perfectly uniform ahead of the print. Zacks published a Q2 consensus of $191.13 million in revenue and $0.03 in adjusted EPS in early July, while post-release market coverage cited another consensus set at approximately $190.48 million in revenue and $0.01 in adjusted EPS. Rather than force a single false precision point, the most defensible conclusion is that AAOI delivered a modest revenue beat and a larger adjusted-EPS beat across the publicly available estimate sets.
- Revenue: $191.922 million actual versus $191.13 million Zacks consensus — ✅ beat by approximately $0.8 million, or 0.4%. Against the $190.48 million consensus cited in post-release coverage, the beat was approximately 0.8%.
- Adjusted EPS: $0.06 actual versus $0.03 Zacks consensus — ✅ beat by $0.03. Against the $0.01 consensus cited in post-release coverage, the beat was $0.05.
- Operating margin: GAAP negative 12.9%; non-GAAP negative 5.4%. A sufficiently reliable public pre-earnings operating-margin consensus was not available in the verified sources reviewed, so labeling operating margin as a Street beat or miss would be fabricated. Management did acknowledge that non-GAAP operating expenses were higher than expected.
- Non-GAAP gross margin: 29.8% — ✅ within the company’s 29% to 30% Q2 guidance range.
The true source of the EPS beat was not simply stronger product profitability. CFO Stefan Murry said the non-GAAP result was largely helped by foreign tax benefits and modest government subsidy income. That matters for earnings quality: revenue execution was solid, but the operating-level economics were less impressive than the positive $0.06 adjusted EPS suggests.
For Q3 2026, AOI guided to revenue of $255 million to $290 million, non-GAAP gross margin of 29% to 30.5%, non-GAAP net income of $10.1 million to $24.0 million and non-GAAP EPS of $0.11 to $0.26 on approximately 92.8 million diluted shares. The revenue midpoint of $272.5 million represents about 41.9% sequential growth from Q2 and was above the approximately $264.56 million public consensus cited immediately after the release. However, the $0.26 top end of EPS guidance was below the $0.28 consensus cited by the same source. In other words, the guide was substantially stronger on revenue than on per-share earnings.
That divergence explains what the market appeared to prioritize. Investors focused on the revenue slope, the expected nearly fivefold sequential increase in 800G revenue, 1.6T qualification progress, and manufacturing capacity that management expects to rise from roughly 200,000 units per month toward more than 650,000 units per month by year-end. Near-term EPS mattered less because the company is deliberately carrying high R&D, manufacturing build-out and financing costs to capture the capacity window.
AAOI shares closed at $135.63 on August 7, 2026, up 9.19% from the pre-earnings close of $124.22. The stock traded as high as $149.35 during the session, roughly 20% above the prior close, before giving back part of the move. That is not a classic “sell the news” outcome. The positive close indicates that investors rewarded the forward revenue and capacity trajectory; the fade from the intraday high is consistent with the market also recognizing the still-negative operating margin, heavy capital requirements, dilution and a valuation already discounting a large amount of future execution.
Earnings Call Highlights
- Management said near-term revenue is constrained primarily by production capacity and key component availability rather than customer demand.
💡 Reading Between the Lines: The constraint has shifted from demand generation to manufacturing execution. That can support unusually fast revenue growth, but it also transfers the principal risk into yield, equipment installation, component procurement and working-capital management. - AOI expects 800G revenue to grow nearly fivefold sequentially in Q3, while 1.6T shipments are expected to begin later in the quarter after customer qualification.
💡 Reading Between the Lines: Q3 is the first quarter in which the AI-optics narrative should become visible at meaningful scale in reported revenue. If the 800G ramp slips, the market will likely treat it as an execution problem rather than a normal quarterly mix fluctuation. - Manufacturing capacity is approaching 200,000 800G/1.6T units per month and management still targets more than 650,000 units per month by year-end.
💡 Reading Between the Lines: The valuation increasingly depends on a physical capacity build rather than only design wins. The same-line architecture for 800G and 1.6T should improve capital flexibility, but the pace of equipment commissioning and component availability will determine how much of that theoretical capacity converts into revenue. - Management described U.S. manufacturing and in-house laser production as important competitive differentiators, while expanding Texas facilities and CPO-related laser capacity.
💡 Reading Between the Lines: AOI is trying to create a vertically integrated, U.S.-anchored supply proposition that is harder to replicate than a standalone transceiver design. The strategic payoff could be better customer stickiness and margin capture, but the trade-off is very high capital intensity and execution risk. - The CFO said Q2 non-GAAP net-income upside was largely driven by foreign tax benefits and modest government subsidy income, even as non-GAAP operating loss remained $10.3 million.
💡 Reading Between the Lines: Investors should not model the $0.06 EPS beat as evidence that operating leverage has already arrived. The more durable inflection will be when gross-margin expansion and operating leverage produce positive operating income and EBITDA without relying on below-the-line benefits.
Deep Business Insights
Hidden Metrics That Matter
Metric 1 — the profitability quality gap. AOI reported $5.475 million of non-GAAP net income, yet non-GAAP operating loss was $10.3 million and adjusted EBITDA was negative $0.543 million. This is not an accounting footnote; it changes how an investor should interpret the earnings inflection. The company did return to adjusted net profitability, but core operating profitability had not yet crossed zero. Until adjusted operating income and EBITDA turn sustainably positive, an EPS-based valuation can overstate the maturity of the earnings model.
Metric 2 — the full-year revenue target is heavily back-end loaded. The calculation is based on company-reported figures: first-half 2026 revenue of $343.066 million + Q3 guidance midpoint of $272.5 million leaves approximately $484.434 million required in Q4 to reach management’s roughly $1.1 billion full-year revenue target. The simple formula is $1,100.0 million – $343.066 million – $272.5 million = $484.434 million. That implied Q4 level would be approximately 77.8% above the Q3 midpoint. This is calculated from company-reported figures, not a company-issued Q4 revenue guide.
The product mix explains why management believes such a step-up is possible, but also why execution risk is elevated. Q2 800G revenue was only $12.8 million, equivalent to approximately 6.7% of total company revenue using $12.8 million / $191.922 million. This percentage is calculated from company-reported figures. Management expects 800G revenue to rise nearly fivefold sequentially in Q3 and expects 1.6T to begin contributing later in the quarter, so the company’s 2026 model depends on a rapid replacement of lower-speed mix with much larger high-speed volumes.
Why are customers willing to work with AOI despite that execution burden? Management’s strategic case rests on four elements: internal laser manufacturing, proprietary production equipment, an automated line architecture that can support both 800G and 1.6T with limited incremental retooling, and a rapidly expanding U.S. manufacturing footprint. These factors can reduce exposure to some industry bottlenecks, shorten qualification-to-volume timelines and appeal to hyperscalers seeking geographically diversified optical supply. They should still be treated as management-described competitive advantages rather than independently proven guarantees of market share.
Customer concentration remains the counterweight to those advantages. The three largest Q2 customers represented 42%, 26% and 24% of total revenue. The calculation 42% + 26% + 24% = 92% means the top three customers accounted for approximately 92% of Q2 revenue, calculated from company-reported figures, while the top ten accounted for 99%. Such concentration can accelerate growth when hyperscale programs ramp, but it also makes quarterly revenue, pricing and qualification outcomes unusually sensitive to a small number of purchasing decisions.
Industry Chain Reactions
- ✅ Benefit — Lumentum Holdings Inc. (NASDAQ: LITE): AAOI’s call reinforces the industry read-through that 800G, 1.6T and CPO-related optical demand remains constrained by high-speed component and laser supply. That backdrop can support utilization and pricing across high-end optical component vendors. This is an industry-demand read-through, not evidence that Lumentum is a disclosed AAOI supplier or that it will capture a specific AOI order.
- ❌ Face Pressure — Coherent Corp. (NYSE: COHR): if AOI executes its planned U.S. expansion, in-house laser scaling and 800G/1.6T capacity ramp, it adds another vertically integrated supplier competing for hyperscale optics programs and future CPO opportunities. The competitive pressure is strategic and execution-dependent; it should not be interpreted as evidence that Coherent has already lost share because of this quarter.
Valuation Framework and Key Risks
AAOI closed at $135.63 on August 7, giving it an equity market capitalization of approximately $11.47 billion based on roughly 84.57 million shares outstanding. Against management’s approximately $1.1 billion 2026 revenue expectation, the stock trades at about 10.4 times 2026 sales. Using company-reported quarter-end cash of approximately $508.8 million, debt excluding convertible debt of $92.8 million and convertible senior notes of approximately $129.1 million produces an approximate enterprise value of $11.18 billion and an enterprise-value-to-2026-sales multiple near 10.2 times. These are calculated using the August 7 market price and company-reported balance-sheet figures.
That is an aggressive sales multiple for a company that still produced a negative 5.4% non-GAAP operating margin and slightly negative adjusted EBITDA in Q2. Traditional P/E or EV/EBITDA analysis is therefore not yet the right primary framework. The market is effectively valuing AAOI on the probability that 800G and 1.6T volumes scale rapidly, gross margin moves materially toward management’s long-term approximately 40% objective, and the current capital program converts into sustained operating leverage.
The bull case does not require today’s sales multiple to remain above 10 times indefinitely. It requires the revenue denominator and gross-profit dollars to grow fast enough that the multiple compresses through execution. Q3 guidance supports that possibility: the midpoint implies about 42% sequential revenue growth. Management also discussed more than $500 million of Q4 revenue capacity during the call, but that statement should be treated as a management expectation rather than formal quarterly guidance.
The risk case is that the market is capitalizing future capacity before the economics of that capacity are fully proven. Several variables deserve explicit attention:
- Margin conversion risk: Q3 non-GAAP gross-margin guidance remains only 29% to 30.5%, far below the long-term roughly 40% objective. The company needs mix and manufacturing efficiency—not revenue growth alone—to close that gap.
- Supply-chain risk: management identified DSP and TIA availability as key constraints for 800G and 1.6T, while a memory-related switch shortage is expected to reduce Q3 100G revenue by approximately $20 million to $25 million.
- Capital intensity: management said Q2 capital investments totaled approximately $565.5 million, including $280 million of equipment prepayments, and expects second-half capital intensity to be higher than in the first half.
- Dilution and financing risk: the company raised $538.8 million net under a new at-the-market program and expects to fund expansion with cash, operating cash flow, some equity sales and additional debt. Q3 guidance assumes approximately 92.8 million diluted shares versus 88.152 million used for Q2 non-GAAP diluted EPS, a 5.3% higher diluted-share-count assumption calculated from company-reported figures. That comparison is not equivalent to saying 5.3% of new shares will necessarily be issued, but it demonstrates how per-share economics can lag enterprise growth.
- Customer concentration: the top three customers represented approximately 92% of Q2 revenue. A delayed qualification, order rescheduling or pricing negotiation with a single major account can materially alter quarterly results.
- Execution timing: to mathematically reach approximately $1.1 billion of 2026 revenue using the Q3 midpoint, Q4 revenue needs to approach $484 million. The full-year target is therefore highly dependent on a sharp second-half capacity ramp.
The valuation conclusion is not that AAOI is automatically overvalued because it trades above 10 times current-year sales, nor that rapid growth makes the multiple irrelevant. The correct framework is probabilistic: today’s price embeds a high probability that the company’s production expansion, high-speed product qualifications and margin roadmap work together. Each quarter that 800G/1.6T mix rises while operating losses narrow will de-risk that assumption; revenue growth without margin conversion would do the opposite.
Key FAQs
Did AAOI beat Q2 2026 earnings expectations?
Yes, on the publicly available consensus sets reviewed. AAOI reported $191.922 million of revenue and $0.06 of non-GAAP diluted EPS. Zacks had published consensus estimates of $191.13 million and $0.03, implying a modest revenue beat and a $0.03 EPS beat. Other post-release market coverage cited approximately $190.48 million of revenue and $0.01 of EPS as consensus. The more important caveat is that the EPS upside was helped materially by foreign tax benefits and modest government subsidy income, while non-GAAP operating income remained negative.
Why did AAOI stock rise after Q2 2026 earnings despite a GAAP loss?
The market prioritized the forward growth slope over the GAAP loss. Q3 revenue guidance implies roughly 42% sequential growth at the midpoint, 800G revenue is expected to rise nearly fivefold sequentially, 1.6T shipments are expected to start later in Q3, and management is rapidly expanding manufacturing capacity. AAOI closed 9.19% higher on August 7. The stock nevertheless finished well below its $149.35 intraday high, suggesting that investors were still balancing the growth outlook against negative operating margins, financing needs and dilution.
What does AAOI Q3 2026 guidance imply for 800G and 1.6T growth?
Management guided Q3 revenue to $255 million to $290 million and expects the increase to be driven mainly by 800G even though 100G revenue is expected to fall by approximately $20 million to $25 million because of a customer’s switch shortage. AOI expects 800G revenue to grow nearly fivefold sequentially from Q2’s $12.8 million base, while the first 1.6T product is expected to complete qualification and begin shipments later in Q3. This makes Q3 the first major test of whether capacity expansion can turn next-generation product demand into reported revenue at scale.
Sources: Applied Optoelectronics Q2 2026 earnings release, official Q2 2026 earnings-call webcast page, Q2 2026 Form 10-Q, full earnings-call transcript mirror, Zacks pre-earnings consensus reference, and August 7, 2026 market-price data. AOI’s Investor Relations site publishes the official webcast and supporting materials for the call; it does not provide a text transcript on the Q2 results page, so management commentary was cross-checked against the official event listing and the transcript mirror.
Disclaimer: This article/chart is for educational and informational purposes only and does not constitute investment advice of any kind. Past performance is not indicative of future results. Investors should independently evaluate their own risks.