⚡ Key Takeaways
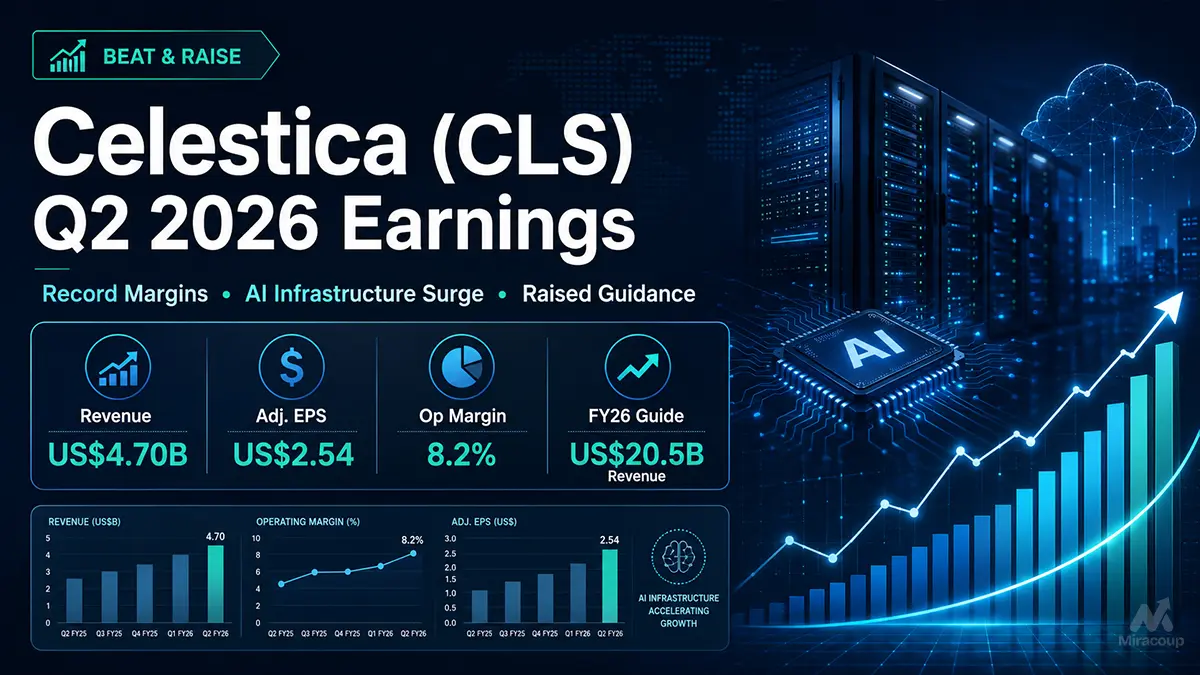
- Celestica delivered a clean beat-and-raise quarter: revenue reached US$4.70 billion, adjusted EPS was US$2.54 and adjusted operating margin rose to a record 8.2%.
- AI infrastructure is now the core earnings engine: CCS generated 81% of company revenue and grew 84%, while Enterprise revenue surged 167% on hyperscaler AI compute demand.
- The valuation debate has shifted to 2027 execution: management raised 2026 revenue guidance to US$20.5 billion and expects revenue growth to accelerate beyond 65% in 2027.
Part 1: Core Earnings Breakdown
1. Revenue and Profit Analysis
Celestica reported Q2 2026 revenue of US$4.70 billion, representing year-over-year growth of 62% from US$2.89 billion. Adjusted EPS increased 83% to US$2.54, while adjusted operating margin expanded by 80 basis points to a company record of 8.2%.
GAAP diluted EPS was US$3.17, compared with US$1.82 a year earlier. However, investors should place greater weight on adjusted EPS because the GAAP result included a US$0.90-per-share pre-tax positive impact from Celestica’s total return swap.
Business Area | Q2 2026 Revenue | Share of Total Revenue | Year-over-Year Growth | Segment Margin |
|---|---|---|---|---|
Connectivity & Cloud Solutions | US$3.81 billion | 81% | +84% | 8.7% |
Advanced Technology Solutions | US$0.89 billion | 19% | +8% | 6.3% |
Hardware Platform Solutions | Approximately US$1.90 billion | 41% | +58% | Included within CCS |
- Communications revenue grew 62%, led by hyperscaler demand for 800G networking switches and continued resilience in 400G programs.
- Enterprise revenue grew 167%, substantially above management’s previous outlook of approximately 130%, driven by an accelerated hyperscaler AI and machine-learning compute ramp.
- ATS margin expanded by 100 basis points to 6.3%, supported by operating leverage and a richer mix of engineering-led products.
Buy-side take: Celestica is no longer trading purely as a traditional electronics manufacturing services provider. CCS and HPS are turning the group into a higher-value AI infrastructure design, manufacturing and systems-integration platform. The rub is that earnings are becoming increasingly dependent on a small number of hyperscale customers.
2. Expectations vs. Actual Results
Metric | Q2 2026 Actual | Expectation | Variance | Result |
|---|---|---|---|---|
Revenue | US$4.70 billion | US$4.39 billion FactSet consensus | Approximately +US$310 million, or +7.1% | ✅ Beat |
Adjusted EPS | US$2.54 | US$2.30 FactSet consensus | +US$0.24, or +10.4% | ✅ Beat |
Adjusted Operating Margin | 8.2% | 8.0% company-guidance midpoint assumption | +20 basis points | ✅ Above Guidance |
The quality of the beat was solid. Revenue exceeded both the high end of Celestica’s own US$4.15 billion to US$4.45 billion guidance range and Wall Street consensus. Adjusted EPS also surpassed the high end of management’s US$2.14 to US$2.34 range.
Q3 2026 Guidance
Metric | Q3 2026 Guidance | Midpoint | Implied Year-over-Year Growth |
|---|---|---|---|
Revenue | US$5.25 billion to US$5.55 billion | US$5.40 billion | Approximately 69% |
Adjusted EPS | US$2.88 to US$3.08 | US$2.98 | Approximately 89% |
Adjusted Operating Margin | 8.4% at the guidance midpoints | 8.4% | Approximately +80 basis points |
Management expects Q3 Communications revenue to grow approximately 60%, Enterprise revenue to grow approximately 190% and ATS revenue to increase by a mid-teens percentage.
Raised Full-Year 2026 Outlook
Metric | New 2026 Outlook | Previous Outlook | Change |
|---|---|---|---|
Revenue | US$20.50 billion | US$19.00 billion | +US$1.50 billion |
Adjusted EPS | US$11.30 | US$10.15 | +US$1.15 |
Adjusted Operating Margin | 8.4% | 8.1% | +30 basis points |
Free Cash Flow | US$600 million | US$500 million | +US$100 million |
This is a genuine beat-and-raise rather than a cosmetic guidance revision. Management increased revenue, EPS, operating-margin and free-cash-flow expectations simultaneously, indicating that higher volumes are flowing through the income statement with meaningful operating leverage.
3. Earnings Call Highlights
- “Demand does exceed the revenue figures.” 💡 Reading Between the Lines: Celestica’s outlook is currently constrained more by component availability than by end demand. Additional silicon, memory or printed wiring board supply could create upside, but material shortages could also delay revenue recognition.
- “10 active 1.6T programs.” 💡 Reading Between the Lines: The 1.6T opportunity is not dependent on a single flagship award. A portfolio of active programs reduces individual-program risk and supports a broader multi-customer networking ramp through 2027.
- “We do both, and that’s part of our secret sauce.” 💡 Reading Between the Lines: Management is positioning Celestica’s integrated design-and-manufacturing model as the source of its pricing power and market-share gains. This supports a valuation above the conventional low-margin EMS peer group, provided execution remains consistent.
Part 2: Deep Business Insights
1. Hidden KPIs and Celestica’s Competitive Moat
Hidden KPI One: Customer Concentration Has Reached a Critical Level
Three customers individually represented 32%, 17% and 14% of Q2 revenue. Combined, Celestica’s three largest customers generated approximately 63% of total quarterly revenue.
This concentration cuts both ways. Deep alignment with large hyperscalers provides multi-year visibility, scale and stronger utilization. However, a programme delay, insourcing decision or allocation change at just one major customer could have an outsized impact on revenue, margins and working capital.
Hidden KPI Two: The Balance Sheet Is Pre-Funding the AI Ramp
Inventory reached US$3.40 billion, increasing by approximately US$700 million sequentially and US$1.50 billion year over year. This is not automatically a red flag: cash-cycle days improved to 47 days, down 19 days year over year, while Q2 free cash flow remained positive at US$147 million.
Nevertheless, the inventory build demonstrates how much capital must be committed before AI infrastructure revenue can be recognised. If customer deployments remain on schedule, this inventory becomes an earnings accelerator. If programmes slip, it becomes a working-capital overhang.
Why Customers Choose Celestica
- Design plus manufacturing: Celestica expects its design-engineering organisation to approach 2,000 engineers by the end of 2026, allowing it to support products from initial architecture through volume production.
- Reliable execution at scale: Management said customers have returned share previously allocated to other suppliers because Celestica was able to ramp complex products more reliably.
- Pre-positioned component supply: Celestica can take over additional production without returning to the back of the queue for scarce materials because relevant supply has already been pipelined.
- Higher-value HPS content: Celestica incorporates its own design, engineering and platform know-how into HPS products, supporting stronger pricing than lower-value manufacturing-only work.
The competitive moat is therefore not based solely on factory capacity. It is the combination of engineering depth, component access, customer collaboration and the ability to move a product from design to high-volume production without creating a deployment bottleneck.
2. Supply-Chain Read-Through: Winners and Potential Losers
✅ Broadcom (NASDAQ: AVGO) — Positive Read-Through
Celestica confirmed that it will collaborate with OpenAI and Broadcom on multi-generational custom accelerator roadmaps. Celestica’s planned custom-rack deliveries and 2027 production ramp provide a positive demand signal for Broadcom’s custom accelerator, connectivity and networking ecosystem.
The wider read-through is that hyperscalers and digital-native AI companies are moving beyond standard merchant servers toward customised accelerators and tightly integrated rack-scale systems. That trend favours suppliers with custom silicon and high-speed networking exposure.
❌ Super Micro Computer (NASDAQ: SMCI) — Competitive Pressure Risk
Celestica’s expansion into integrated AI racks for OpenAI, AMD platforms and other large customers creates a potential competitive pressure point for specialist server and rack integrators such as Super Micro Computer.
This does not imply a disclosed customer loss for Supermicro. The commercial read-through is that hyperscalers have more credible alternatives for custom rack-scale design and manufacturing, potentially increasing pricing competition and reducing the scarcity premium previously attached to independent AI server integrators.
3. Valuation Analysis and Potential Risks
At approximately US$347.99 during trading on July 30, 2026, CLS trades at roughly 30.8 times management’s raised 2026 adjusted EPS outlook of US$11.30. Its trailing price-to-earnings multiple was approximately 36.2 times.
This is no longer a plain-vanilla EMS valuation. The market is pricing Celestica as a structural AI infrastructure compounder, supported by accelerating networking speeds, custom accelerators, rack-scale compute and rising HPS content.
The multiple can be defended if management delivers its stated expectation that 2027 revenue growth will exceed 65% and adjusted EPS will grow faster than revenue. However, the share price has become highly execution-sensitive. A routine programme delay could trigger a sharp de-rating even without damaging the long-term thesis.
Key Valuation Risks
- Component continuity: Demand exceeds available material supply, and certain product lead times have moved beyond 52 weeks.
- Customer concentration: Approximately 63% of quarterly revenue came from the three largest customers.
- Capital intensity: Celestica plans approximately US$1 billion of 2026 capital expenditure and is using US$1.5 billion as a preliminary 2027 planning figure.
- Free-cash-flow conversion: Rapid inventory and capacity investment means accounting earnings may grow faster than cash flow during the expansion phase.
- Programme execution: OpenAI racks, AMD Helios, 1.6T networking and CPO programmes must pass qualification and enter production on schedule.
- Consignment accounting: Management expects the OpenAI programme to operate with consigned-program dynamics, meaning certain material costs will not pass through reported revenue. Investors should focus on gross profit and operating income, not revenue alone.
- Valuation compression: A 30-times-plus forward multiple leaves limited room for weaker margins, slower deployments or reduced hyperscaler capital spending.
Investment conclusion: Q2 2026 was a high-quality earnings beat supported by genuine end-demand strength, improving operating leverage and new strategic programme wins. The fundamental direction remains firmly positive, but the easy re-rating has arguably taken place. From here, upside depends on execution across 1.6T networking, custom AI racks and component procurement rather than another simple expansion of the valuation multiple.
Part 3: Key FAQs
Did Celestica beat Q2 2026 earnings estimates?
Yes. Celestica reported Q2 2026 revenue of US$4.70 billion, approximately 7.1% above the US$4.39 billion FactSet consensus. Adjusted EPS of US$2.54 exceeded the US$2.30 consensus estimate by approximately 10.4%.
What is Celestica’s Q3 2026 earnings guidance?
Celestica expects Q3 2026 revenue of US$5.25 billion to US$5.55 billion, adjusted EPS of US$2.88 to US$3.08 and an adjusted operating margin of 8.4% at the guidance midpoints.
Is CLS stock overvalued after the Q2 2026 earnings report?
At approximately US$348, CLS trades at around 30.8 times management’s 2026 adjusted EPS guidance. The valuation is demanding for a conventional manufacturing company but potentially supportable if Celestica delivers accelerated 2027 growth, further margin expansion and timely production ramps. The central risk is that the current multiple already discounts a substantial portion of that success.
Primary data sources: Celestica’s official Q2 2026 financial results and Celestica Investor Relations earnings-call materials.
Disclaimer: This article/chart is for educational and informational purposes only and does not constitute investment advice of any kind. Past performance is not indicative of future results. Investors should independently evaluate their own risks.