
Key Takeaways
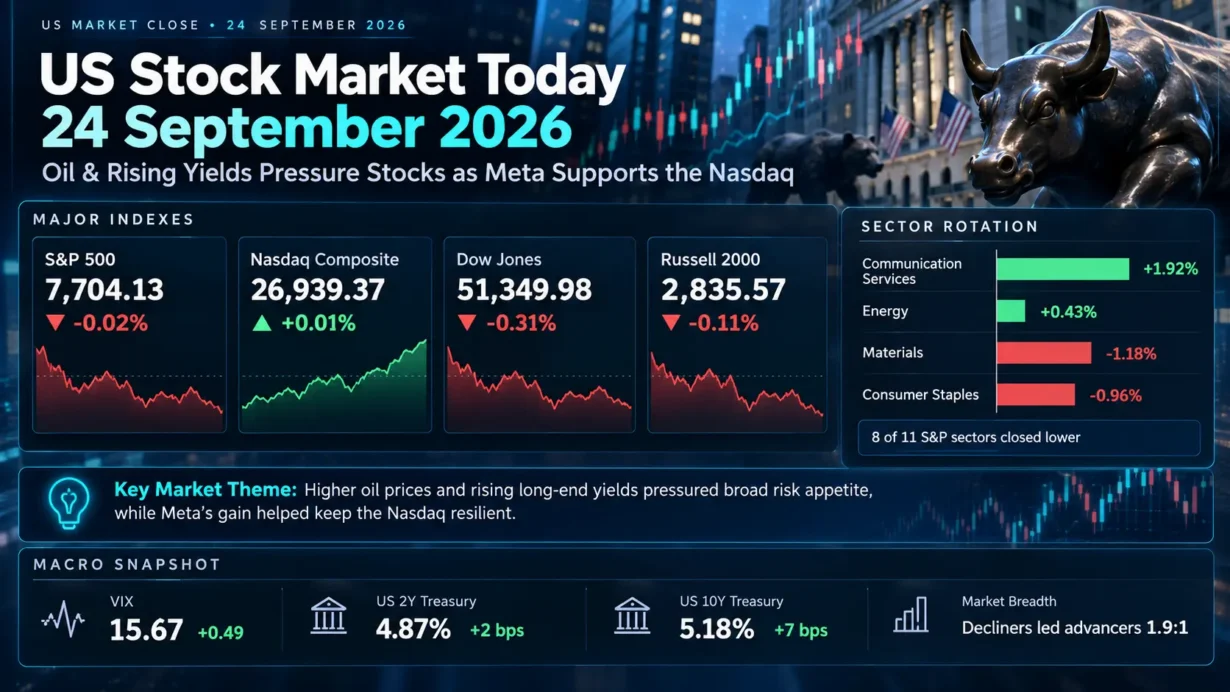
- The S&P 500 slipped 0.02% to 7,704.13, the Nasdaq Composite edged up 0.01% to 26,939.37, and the Dow fell 0.31% to 51,349.98. The near-flat benchmarks concealed widespread selling.
- Communication services led with a reported 1.92% gain, while materials lost 1.18% and consumer staples declined 0.96%; eight of 11 S&P 500 sectors finished lower.
- Meta gained 4.5% following its Connect AI-device announcement, while Oracle fell 3.5% after a media report raised questions about a data-center project. These were company-specific moves with implications for the AI capital-spending trade.
- Brent crude climbed more than 3% to nearly $107 a barrel amid renewed Middle East supply concerns. The VIX closed at 15.67, up 0.49 point, while the official 10-year Treasury yield rose seven basis points to 5.18%.
1. Market Capital Flows and Sector Rotation
Thursday’s flat S&P 500 close was not evidence of a broad risk-on session. Communication services rose 1.92%, supported by Meta, while energy’s S&P 500 sector index gained approximately 0.43% as crude advanced. Materials was the weakest sector, down 1.18%, followed by consumer staples at minus 0.96%, according to Reuters’ closing sector figures. The communications figure comes from a separate published sector series, so small vendor or return-methodology differences are possible. The unusual combination of stronger oil-linked shares, weak materials and falling staples illustrates a market distinguishing beneficiaries of higher energy prices from companies exposed to rising input costs or borrowing rates. Communications sector history; S&P energy sector; Reuters sector close.
The Russell 2000 lost 0.11% to 2,835.57, underperforming the capitalization-weighted S&P 500. Select mega-cap growth names held up better than the typical S&P constituent, but the split was not universal: Meta and AMD advanced while Microsoft and Broadcom declined. Interest-rate-sensitive small caps and economically exposed materials lagged; defensive consumer staples also failed to provide protection. Decliners outnumbered advancers in the S&P 500 by 1.9 to one, with 14 new highs against 41 new lows. Total U.S. share volume of 16.8 billion was close to its preceding 20-session average of 16.7 billion, suggesting that weak participation—not unusually heavy aggregate turnover—was the clearer signal. Russell 2000 history; Reuters market breadth and volume.
Institutional Flow Insight: The price action is consistent with selective exposure to companies with visible AI monetization and energy-linked earnings, alongside reduced tolerance for long-duration valuations, financing-intensive expansion and weaker earnings visibility. This is an interpretation of prices, not evidence of confirmed institutional purchases or sales. Quarter-end portfolio rebalancing and changing risk budgets could magnify dispersion, but no specific rebalancing flows were independently verified.
2. Decoding the Biggest Market Movers
Meta Platforms (META)
Meta rose 4.5% in regular trading after unveiling the Muse Charm, a pocket-sized device associated with its Muse AI assistant at Connect. Meta’s official Connect recap describes the product; no incremental device revenue or margin contribution has yet been established. The investment question is whether Meta can translate an expanding consumer AI ecosystem into higher advertising productivity, subscriptions or new distribution without allowing infrastructure costs to overwhelm returns. Its latest completed quarter, Q2 2026, delivered $60.801 billion in revenue, up 28% year over year, and GAAP diluted EPS of $6.18, down 13%. Its operating margin was 31%, versus 43% a year earlier. Meta’s own full-year 2026 capital-expenditure guidance was $130 billion–$145 billion, which is a company forecast, not realized spending. Management discussed AI-driven improvements in its advertising business and potential new AI revenue streams on its official July 29 earnings-call transcript; all reported financial figures and guidance are from its official earnings release. Given Meta’s index weight, its gain helped insulate communication services and the Nasdaq from weakness elsewhere.
Oracle (ORCL)
Oracle fell 3.5% after Reuters reported a force-majeure notice affecting a New Mexico data-center project; shares of project developer Blue Owl also declined. That project-specific report should not be treated as a separately confirmed Oracle regulatory filing or as proof of a company-wide delivery failure. The market sensitivity is understandable: Oracle’s latest reported Q1 FY2027 revenue rose 30% to $19.3 billion, including $7.4 billion of cloud-infrastructure revenue, up 121%. GAAP EPS was $1.56, non-GAAP EPS was $1.92, and GAAP operating income reached $6.7 billion, an operating margin of roughly 35%. Its $664 billion in remaining performance obligations represents contracted future business, not guaranteed near-term revenue or cash receipts; the company also reported negative $5 billion in quarterly free cash flow as it expanded infrastructure. Oracle’s official FY2027 outlook called for at least $90 billion in revenue and non-GAAP EPS of $8.10; both are forward-looking company guidance, not results. The contrast between a substantial backlog and potential site-level execution risk may affect investor scrutiny of cloud peers’ delivery schedules, funding needs and AI-infrastructure valuations. Reuters on the reported project notice; Oracle’s official Q1 release and webcast information.
3. Macro Indicators and Market Outlook
The Cboe VIX closed at 15.67, up 0.49 point, or 3.23%, from 15.18. Higher expected volatility alongside an almost unchanged S&P 500 was consistent with increased demand for downside protection and event hedging. The level itself, however, did not indicate extreme volatility; option prices alone cannot establish who bought protection or why.
The U.S. Treasury’s official daily par-yield series placed the two-year yield at 4.87%, up two basis points from 4.85%, and the 10-year at 5.18%, up seven basis points from 5.11%. The 2s/10s spread therefore widened from 26 to 31 basis points. The larger long-end move is compatible with increased inflation and term-premium concerns as oil rose, while the front end remained exposed to Federal Reserve policy repricing after the prior week’s 25-basis-point hike. A one-day nominal-yield change cannot isolate inflation expectations, real yields and term premium—or establish the timing of any subsequent policy decision.
Brent’s rise of more than 3% to almost $107 per barrel followed renewed Saudi supply concerns after a Houthi missile attack. Equities recovered from their intraday lows after Reuters reported that U.S. and Iranian negotiators were exploring a phased approach involving the Strait of Hormuz and U.S. economic restrictions. Those talks were exploratory, not an announced agreement. Higher energy prices can support producers while simultaneously pressuring transport, manufacturing margins and inflation-sensitive equity valuations. Reuters, September 24 market close.
Upcoming Economic Data & Catalysts:
- U.S. Census Bureau advance durable goods orders, August 2026 (Release date: September 25, 2026, 8:30 a.m. ET): Core capital-goods orders and revisions will help investors assess underlying business investment and the sensitivity of industrial earnings to financing costs. Official Census release calendar.
- U.S. Bureau of Economic Analysis personal income and outlays, August 2026 (Release date: September 30, 2026, 8:30 a.m. ET): PCE inflation, real consumption and disposable income will inform the debate over inflation persistence, Treasury yields and consumer-facing earnings. Official BEA release calendar.
Market Insights:
September 24 was better characterized as a narrow, selective market than a broad rally. Meta’s contribution masked negative breadth, with eight sectors lower and far more S&P constituents declining than advancing. Watch whether the 10-year yield continues to rise, energy prices remain elevated, market breadth deteriorates further or cloud-infrastructure companies revise delivery schedules and spending plans. Conversely, stabilization in oil and yields accompanied by improving breadth would challenge the defensive interpretation of the session.
Trading & Investment Strategy:
Risk management argues for sizing positions around volatility and earnings sensitivity rather than extrapolating a single AI-related rally. Staggering entries can reduce timing risk; diversification across distinct earnings drivers can limit exposure to one crowded theme. Use predefined exit or reassessment levels, keep leverage consistent with the possibility of geopolitical gaps, and avoid chasing large one-day moves before checking cash-flow conversion, valuation and the next scheduled macro release. These are portfolio-management considerations, not return guarantees or instructions to transact.
4. Key FAQs About the US Stock Market Today
Why did the US stock market move on September 24, 2026?
Rising crude oil and Treasury yields, together with Middle East uncertainty, pressured broad equity participation. Meta’s 4.5% gain following an official AI-device announcement and select semiconductor strength helped offset weaker sectors, leaving the S&P 500 nearly flat and the Nasdaq marginally higher. Reports of exploratory U.S.–Iran discussions helped stocks rebound from their session lows.
Which sectors performed best and worst in the US stock market on September 24, 2026?
Communication services led, with a reported 1.92% rise as Meta advanced. Materials was weakest, down 1.18% in Reuters’ closing sector data, followed by consumer staples at minus 0.96%. Higher energy costs and bond yields offered a plausible explanation for the divergence, but the session’s prices do not prove the identity or motive of underlying investors.
What should investors watch after the US stock market close on September 24, 2026?
Monitor September 25’s scheduled August durable goods report and September 30’s August PCE inflation release, alongside the 10-year Treasury yield, oil prices, VIX and the ratio of advancing to declining shares. For AI-linked stocks, assess whether reported product and contract momentum converts into operating margins and free cash flow without additional project delays.
Disclaimer: This article is intended solely for the exchange of investment ideas and does not constitute investment advice of any kind.