


Key Takeaways
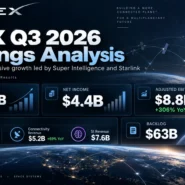
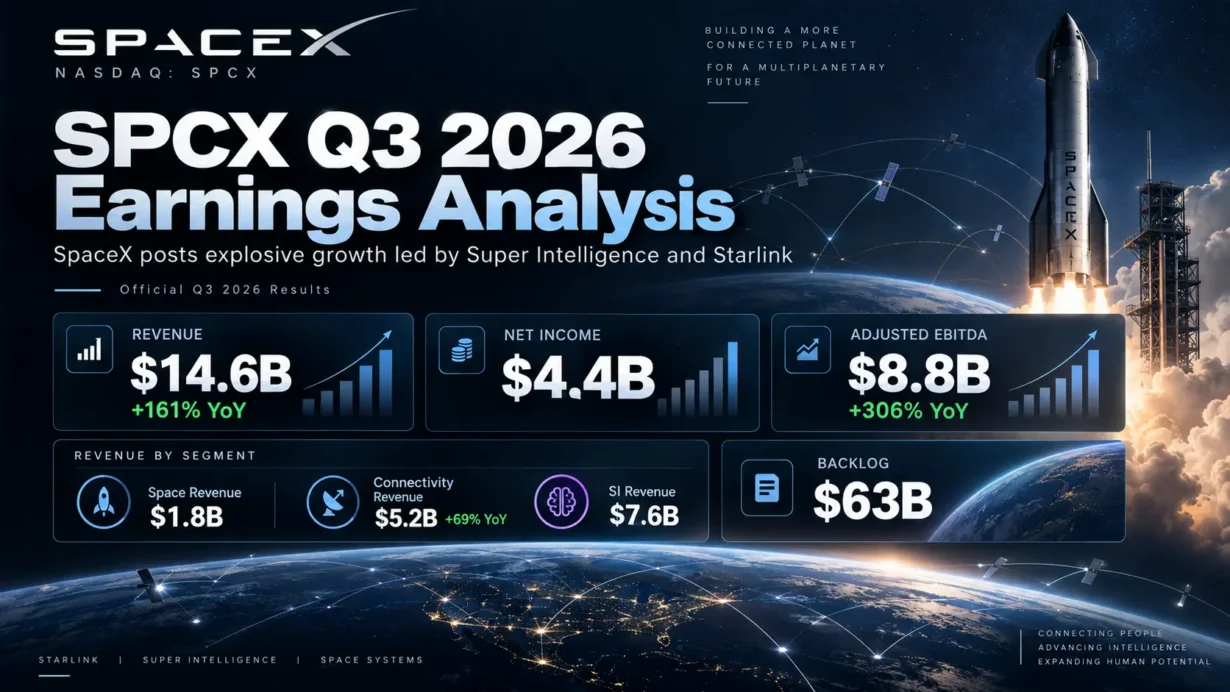
- SpaceX reported $14.575 billion in Q3 2026 revenue, up 161.4% year over year, with $2.791 billion in GAAP operating income, a 19.15% operating margin and $0.35 in diluted EPS. Basic EPS was $0.37, a different measure.
- Super Intelligence (SI) delivered $7.560 billion, or 51.9% of consolidated revenue, making cloud-compute monetization the dominant growth driver. Starlink-led Connectivity added $5.248 billion.
- Revenue beat the $12.89 billion pre-release expectation reported by TipRanks by $1.685 billion; diluted EPS of $0.35 exceeded that source’s $0.14 per-share expectation, subject to EPS-basis comparability.
- Management’s forward-looking Q4 2026 capital expenditure range of $35 billion–$40 billion and expectation of a return toward Q2 gross margins complicate the apparently strong profit story.
- SPCX closed at $159.31 on October 21, up 7.79% after the earnings release. The next investment debate is whether cash returns on infrastructure can catch up with the stock’s valuation.
SpaceX’s first profitable quarter as a public company delivered far more than an earnings beat. The third-quarter results, released on October 20, 2026, offer evidence that recently activated AI cloud capacity can become material revenue almost immediately, while the Starlink franchise continues to produce substantial operating profit. But those gains need to be weighed against a dramatic increase in infrastructure spending, the accounting cost of the Cursor acquisition and the prospect of lower gross margins in the next quarter.
This analysis is based on the company’s official Q3 2026 earnings release filed with the SEC and the official edited earnings webcast transcript. Unless otherwise stated, dollar figures are in U.S. dollars; financial figures are reported results, whereas management guidance is explicitly identified as forward-looking.
Core Earnings Breakdown
Revenue and Profitability Analysis
Consolidated revenue rose to $14.575 billion from $5.576 billion in Q3 2025, an increase of 161.4% (reported by the company as 161%). Against Q2 2026 revenue of $7.814 billion, sequential growth was 86.5%. GAAP operating income reached $2.791 billion, reversing the prior-year operating loss of $273 million and the Q2 operating loss of $143 million. The corresponding operating margin was 19.15%, calculated as $2.791 billion divided by $14.575 billion.
Gross profit was $9.097 billion, or a 62.42% gross margin, calculated from $14.575 billion of revenue less $5.478 billion of cost of revenue. For context, Q2 gross margin was 55.27%, calculated from $7.814 billion of revenue and $3.495 billion of cost of revenue in the official Q2 release. This is an exceptionally sharp sequential improvement, but management warned that some Q3 benefits will not recur.
Net income was $4.404 billion versus a loss of $1.054 billion a year earlier. The SEC-filed statement reports $0.35 in diluted EPS and $0.37 in basic EPS. These figures must not be used interchangeably. Moreover, reported net income benefited from $1.025 billion in net other income and a $390 million income-tax benefit; the earnings release does not establish that either item will repeat. For the first nine months of 2026, GAAP net income remained negative at a $413 million loss. Q3 adjusted EBITDA was $8.809 billion, up from $2.169 billion, with a 60.44% adjusted EBITDA margin. Because adjusted EBITDA excludes substantial depreciation and stock-based compensation, it is not a substitute for GAAP earnings or free cash flow.
The underlying business mix explains why investors should stop treating SPCX solely as a launch-and-satellite company:
- Space: $1.767 billion of revenue, representing 12.1% of consolidated sales, grew 6.1% from $1.666 billion a year earlier. The segment reported a $7 million operating loss compared with $259 million in operating profit a year ago. There were 35 total launches, down from 44, while 12 were customer launches versus 15 in Q3 2025. Investment implication: Space remains an essential strategic distribution platform for Starlink and future services, but Starship research and development currently depresses accounting profitability. Launch cadence and payload economics matter more than revenue growth alone.
- Connectivity: $5.248 billion of revenue, or 36.0% of consolidated sales, increased 69.5% from $3.097 billion. Operating profit climbed 99% to $2.367 billion, implying a 45.1% segment operating margin. Consumer revenue was $3.121 billion, and enterprise and government revenue reached $2.127 billion, up approximately 57% and 91% year over year, respectively. Investment implication: Starlink is the company’s established earnings engine and helps support the broader capital-allocation strategy. The faster expansion of enterprise and government revenue adds customer diversity and contractual demand, but satellite replacement cycles and spectrum investment remain material costs.
- Super Intelligence (SI): $7.560 billion of revenue, or 51.9% of total sales, grew 829.9% from $813 million a year earlier and 195.2% from Q2. SI solutions and infrastructure generated $7.022 billion, while advertising contributed $538 million. Segment GAAP operating income was $431 million, a 5.7% margin, compared with a $1.722 billion loss a year earlier; segment adjusted EBITDA was $4.953 billion. Investment implication: The inflection is real at the revenue level, but the difference between $4.953 billion of adjusted EBITDA and $431 million of GAAP operating profit is fundamental to valuation. Capital equipment depreciation and equity compensation are economic costs, even when excluded from non-GAAP metrics.
SI is the segment formerly reported as Artificial Intelligence (AI), according to the company’s updated reporting definitions. The new name does not represent a fourth business segment.
Expectations vs. Actual Results
Comparisons below use the pre-earnings Wall Street expectations published by TipRanks before the October 20 release. Consensus estimates differ across providers; these are a defined published snapshot, not an assertion that every analyst used the same inputs.
- ✅ Revenue — actual: $14.575 billion; published expectation: $12.89 billion; beat: $1.685 billion, or approximately 13.1% above expectation.
- ✅ EPS — actual: $0.35 GAAP diluted and $0.37 GAAP basic; published per-share expectation: $0.14. The $0.35 diluted figure exceeds the cited expectation by $0.21, although the source does not clearly specify whether its consensus uses the same GAAP diluted basis. Therefore the directional beat is supportable, but the precise like-for-like surprise is not independently established.
- ⚠️ GAAP operating margin — actual: 19.15%; independently verified, like-for-like Q3 analyst consensus: unavailable. No operating-margin beat or miss is claimed. For observed historical context only, GAAP operating margin was approximately −1.83% in Q2 2026 and −4.90% in Q3 2025.
- ✅ Adjusted EBITDA — actual: $8.809 billion. No independently validated comparable pre-release consensus was identified, so no beat/miss label is assigned.
The clearest source of the revenue acceleration was SI: its sequential increase was $4.999 billion, representing approximately 73.9% of the $6.761 billion total sequential revenue increase, calculated from company-reported segment figures. CFO Bret Johnsen also disclosed that SI solutions and infrastructure revenue grew 192% sequentially even after excluding Cursor’s $608 million contribution. That establishes substantial growth beyond the acquisition. It does not, however, prove how much of the $1.685 billion consensus beat came from SI, because a comparable segment-level consensus was not verified.
Management’s published forward-looking guidance and targets are distinct from actual results:
- Q4 2026 capital expenditure guidance: $35 billion–$40 billion, up sharply from Q3’s actual $19.593 billion.
- Q4 2026 profitability commentary: consolidated gross margin is expected to be closer to the Q2 level as Q3’s favorable customer mix and one-time effects fade; no precise Q4 gross-margin percentage was provided.
- Q4 2026 revenue, EPS and operating-margin guidance: no verified numerical company ranges were provided in the earnings webcast.
- Q1 2027 revenue guidance: $33 billion–$37 billion, a management projection rather than realized sales.
- December 2026 goal: $100 billion in annualized revenue run-rate, expressly defined by management using December revenue, not total recognized revenue for the full 2026 fiscal year.
- Year-end 2026 SI nameplate compute target: 2.5–3.0 gigawatts, up from 1.7 gigawatts achieved as of September 30.
What did the market value most? The October 21 reaction suggests investors rewarded the combination of SI cloud monetization, positive GAAP operating income and Q1 2027 revenue visibility more than they penalized near-term spending. Nevertheless, the earnings report also effectively raised the future hurdle: power availability, equipment deployment and customer utilization must convert booked demand into returns on enormous invested capital. Gross-margin reversion may matter more to subsequent quarters than this quarter’s EPS surprise.
SPCX closed at $147.79 on October 20, before the after-hours report, and $159.31 on October 21, an increase of approximately 7.79% based on reported historical closing prices. Reuters independently reported a 7.8% rise. This was not a case of a falling share price contradicting positive headline results; it was a strong positive reaction that could still coexist with significant long-term valuation risk.
Earnings Call Highlights
The following five management points are faithful paraphrases of the October 20 official edited transcript, not invented direct quotations. Commentary following each point is independent analysis.
- Elon Musk and Gwynne Shotwell: Starship Flight 14 deployed 26 operational Starlink V3 satellites; management aims to advance full reusability and increase the launch cadence, while acknowledging that near-term recovery attempts could fail. 💡 Reading Between the Lines: Starship is not merely a standalone rocket product; cheaper and more frequent heavy-lift launches could lower SpaceX’s own constellation deployment costs and expand broadband capacity. A valuation model should phase in those benefits only after repeatable launch and recovery economics are demonstrated.
- Gwynne Shotwell: Starlink reached 13.6 million broadband consumer subscribers and more than 22 million monthly Starlink Mobile users; planned Mobile V2 satellites and new low-band spectrum are intended to broaden U.S. direct-to-cell capabilities. 💡 Reading Between the Lines: Broadband and mobile can share parts of the same distribution infrastructure, but mobile monthly users are not the same metric as paying consumer broadband subscribers. Satellite capacity, regulatory clearance and the ability to operate profitably indoors remain gating factors before mobile carrier ambitions can be valued as established earnings.
- CFO Bret Johnsen: SI solutions and infrastructure revenue increased about 192% sequentially excluding Cursor, driven by new cloud-services agreements; management described less-than-one-year payback on newly deployed compute at current prices. 💡 Reading Between the Lines: Excluding acquired revenue is vital evidence that the cloud ramp is not exclusively an M&A accounting effect. The payback period is a management claim about current unit economics, not independently verified corporate free cash flow or evidence that every future expansion will earn the same return.
- CFO Bret Johnsen: Fourth-quarter 2026 capex is expected at $35 billion–$40 billion, Q4 gross margins should look closer to Q2, and management provided $33 billion–$37 billion of Q1 2027 revenue guidance. 💡 Reading Between the Lines: Management is explicitly prioritizing capacity ahead of reported near-term cash generation. Higher contractual visibility supports the rationale, but investors should avoid applying Q3’s temporarily favorable gross margin to that later revenue guidance without a cost-of-delivery assessment.
- CFO Bret Johnsen: Of the Cursor acquisition’s implied $60 billion equity value, approximately $23.4 billion of equity awards relates to future employee service and is expected to flow through stock-based compensation over roughly three years. 💡 Reading Between the Lines: The transaction buys enterprise distribution and talent retention, not simply immediate software revenue. Future GAAP expenses and possible dilution from equity awards complicate any valuation based solely on adjusted EBITDA, which excludes this acquisition-linked charge.
Deep Business Insights
Hidden Metrics That Matter
Two metrics cut through the differences between growth, accounting earnings and the actual economics of building the next phase of SpaceX.
- 1. Infrastructure intensity relative to earnings. SI accounted for 83.9% of Q3 capex: $16.444 billion ÷ $19.593 billion × 100 = 83.9% (calculated from company-reported figures). Total Q3 capex was 2.22 times adjusted EBITDA: $19.593 billion ÷ $8.809 billion = 2.22 (calculated from company-reported figures). For the first nine months of 2026, cash generated from operating activities was $13.097 billion while purchases of property, plant and equipment totaled $48.069 billion, yielding $13.097 billion − $48.069 billion = −$34.972 billion (calculated from company-reported figures). This last measure is a simple operating-cash-flow-minus-capex proxy, not an officially disclosed or fully adjusted free-cash-flow metric. Why it matters: Strong adjusted EBITDA should not automatically be treated as cash available to shareholders. Cloud contracts can create attractive eventual returns, but financing requirements are immediate; a delay in GPU delivery, grid connections, commissioning or customer activation could widen the timing mismatch.
- 2. Starlink’s customer growth versus pricing and mix. Consumer subscribers increased from 7.2 million a year earlier to 13.6 million, or (13.6 ÷ 7.2 − 1) × 100 = 88.9% growth, while monthly consumer ARPU declined from $83 to $69, or ($69 ÷ $83 − 1) × 100 = −16.9% (both calculated from company-reported figures). ARPU did recover from $66 in Q2. Enterprise and government services accounted for $2.127 billion ÷ $5.248 billion × 100 = 40.5% of Connectivity revenue in Q3 (calculated from company-reported figures). Why it matters: Penetrating lower-priced markets can boost subscriber counts while reducing aggregate ARPU, so subscriber momentum by itself cannot establish future cash returns per satellite. Enterprise, aviation, maritime and government demand can improve the revenue mix and provide customers with geographically resilient connectivity that is difficult to deliver through a conventional single-country terrestrial network.
SpaceX’s competitive differentiation is its integration of launch vehicles, satellites, network operations, user terminals and, increasingly, AI compute and software. Customers may select Starlink where terrestrial deployment is expensive or unavailable, or where mobility, geographic coverage and rapid installation are valuable. SI customers may value access to scarce deployed compute, power and cooling alongside software products such as Grok and Cursor. Those benefits are meaningful but not impregnable moats: enterprise customers retain negotiating power, alternative infrastructure providers exist, and much of SI’s future capacity is still under construction.
The order book provides context but should not be confused with cash collection. Johnsen cited $63 billion of backlog as of September 30, including $17.5 billion in deferred revenue, and said approximately $42 billion of the backlog was expected to be recognized within the following year. These are management-reported backlog and expectation figures; they are not a guarantee of recognition timing or profitability.
Industry Chain Reactions
- ✅ Potential beneficiary — NVIDIA (NASDAQ: NVDA). Musk discussed a goal of deploying roughly 200,000 NVIDIA GB300 units per month during the remainder of 2026, with a transition toward Vera Rubin systems next year. If executed, this compute-buildout strategy could support substantial demand for NVIDIA accelerators and the surrounding hardware ecosystem. This is a stated deployment ambition, not independently confirmed future NVIDIA revenue, and SpaceX’s longer-term in-house chip ambitions create a countervailing supplier risk.
- ❌ Potentially pressured — AT&T (NYSE: T). SpaceX’s intended Starlink Mobile expansion, including the October 8 agreement to acquire up to 14 MHz of paired 800 MHz spectrum subject to regulatory and closing conditions, raises the prospect of additional U.S. mobile competition. On October 21, AT&T shares fell 6.5% despite beating its own quarterly estimates; Reuters attributed part of wider telecom concern to SpaceX’s ambitions. That single-day move cannot be attributed exclusively to SpaceX, and its mobile business has yet to demonstrate that it can match the economics and capacity of nationwide terrestrial networks.
Valuation Framework and Key Risks
At the October 21, 2026 closing price of $159.31, SPCX trades on a demanding capital-intensity-adjusted growth narrative. The September 30 balance sheet reported 8.240 billion Class A common shares and 5.339 billion Class B common shares outstanding, or 13.579 billion combined. Treating the common classes at the quoted Class A price gives an indicative equity value of 13.579 billion × $159.31 = approximately $2.163 trillion (calculated from company-reported figures and the historical market close). This is a simplified market-capitalization estimate, not a fully diluted equity value.
Cash and marketable securities totaled $89.855 billion ($51.294 billion + $38.561 billion), while reported current and long-term debt and finance leases totaled $38.844 billion ($2.698 billion + $36.146 billion). On that simplified definition, enterprise value was approximately $2.112 trillion: $2.163 trillion equity value + $38.844 billion debt and finance leases − $89.855 billion cash and securities (calculated from company-reported figures and the historical share price). Other claims and adjustments are not comprehensively incorporated.
As a deliberately static valuation cross-check, this implies approximately 37.1 times annualized Q3 revenue on an equity-value basis ($2.163 trillion ÷ [$14.575 billion × 4]), 36.2 times annualized Q3 revenue on an enterprise-value basis, and 59.9 times annualized Q3 adjusted EBITDA on an enterprise-value basis ($2.112 trillion ÷ [$8.809 billion × 4]). These are illustrative run-rate ratios calculated from reported results, not trailing-twelve-month multiples, company guidance, earnings forecasts or price targets. The unusually rapid quarterly ramp and temporary margin benefits make straight-line annualization especially unreliable.
There is also a denominator trap: 13.579 billion quarter-end outstanding common shares exceed Q3’s 12.475 billion weighted-average diluted shares by approximately 8.8%, calculated from the SEC release. Using one quarter’s diluted EPS to infer the earnings power of all shares now outstanding would therefore be overly simplistic, even before considering future equity awards.
Three questions define the risk-adjusted investment case:
- Capital productivity and funding: Can new SI facilities achieve durable cash returns after depreciation, financing expense and GPU replacement costs? Q4 capex guidance alone exceeds $35 billion; as of September 30, cash and securities offered significant liquidity, but indefinite self-funding has not been established.
- Margin durability and customer concentration: Q3’s 62.42% consolidated gross margin included mix and other benefits management does not expect to fully repeat. Cloud contracts and the $63 billion backlog improve visibility but do not disclose customer concentration, renewal pricing or all future power costs.
- Strategic execution and shareholder economics: Cursor’s $42.5 billion GAAP purchase consideration and $23.4 billion in awards attributable to post-acquisition service expose investors to integration, compensation and dilution risk. Musk also said SpaceX and Tesla had formed independent special committees to discuss a potential combination, but no terms were agreed and no transaction was guaranteed. The share price should not capitalize a hypothetical merger as a completed fact.
The bullish case requires rapid conversion of contracted AI demand into profitable, cash-generating capacity while Connectivity maintains its economics and Starship reduces the cost of deploying more satellites. The cautious case is that infrastructure outlays, compensation charges and margin normalization absorb a larger share of the growth than investors currently allow for. The most useful follow-up disclosures will be capacity actually commissioned and monetized, cash flow after capex, changes in customer pricing and the bridge from adjusted EBITDA to GAAP profit.
Key FAQs
Did SpaceX (SPCX) beat Wall Street revenue and EPS estimates in Q3 2026?
Yes, based on the identified pre-release TipRanks estimate: SpaceX reported $14.575 billion in revenue versus a $12.89 billion expectation, a $1.685 billion or 13.1% beat. Its reported GAAP diluted EPS was $0.35 versus the provider’s $0.14 per-share expectation; however, that provider did not clearly state the EPS accounting basis, so the exact like-for-like EPS surprise is subject to that qualification. The company also disclosed $0.37 basic EPS, which should not be substituted for diluted EPS.
What is SpaceX’s Q4 2026 earnings guidance and Q1 2027 revenue outlook after the SPCX Q3 report?
Management guided to $35 billion–$40 billion of Q4 2026 capital expenditures and indicated that Q4 consolidated gross margin should be closer to Q2’s level. It did not provide verified numerical Q4 revenue, EPS or operating-margin guidance in the webcast. For Q1 2027, management provided a forward-looking revenue range of $33 billion–$37 billion. The separate $100 billion year-end 2026 annualized revenue run-rate goal refers to December revenue extrapolated over a year, not recognized full-year revenue.
Why did SPCX stock rise after Q3 2026 earnings despite unusually high AI capital spending?
SPCX rose about 7.79% from its October 20 closing price to $159.31 on October 21, consistent with Reuters’ reported 7.8% gain. Investors appeared to favor the upside in revenue, the swing to positive GAAP profit, rapidly growing SI cloud-services monetization and management’s Q1 2027 revenue visibility. That reaction does not resolve whether projected compute deployment, acquisition costs and Q4’s $35 billion–$40 billion of planned capex will ultimately produce attractive returns on invested capital.
Sources: SpaceX Investor Relations — Q3 2026 earnings event; SpaceX’s official Q3 2026 SEC-filed earnings release; official earnings call transcript; pre-earnings consensus snapshot; October 20–21 market closes; and Reuters’ October 21 market report.
Disclaimer: This article/chart is for educational and informational purposes only and does not constitute investment advice of any kind. Past performance is not indicative of future results. Investors should independently evaluate their own risks.