


Key Takeaways
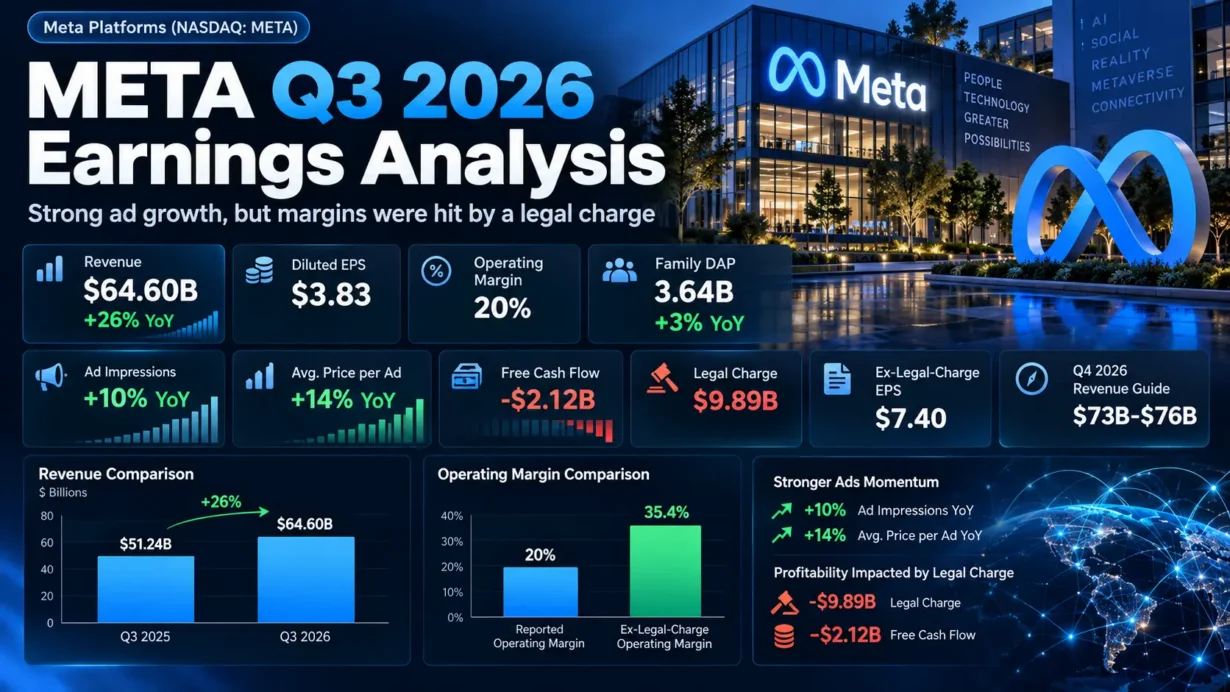
- Meta Platforms (NASDAQ: META) reported third-quarter 2026 revenue of $64.601 billion, up 26% year over year and $1.261 billion above the $63.34 billion FactSet consensus reported by MarketWatch.
- GAAP diluted EPS was $3.83 and the GAAP operating margin was 20%. A $9.89 billion legal charge distorted both figures; Meta disclosed that EPS would have been $7.40 without that charge.
- Advertising generated $63.061 billion, or approximately 97.6% of consolidated revenue. Ad impressions climbed 10% while average ad prices increased 14%, supporting the underlying growth case.
- Q4 2026 revenue guidance is $73 billion to $76 billion. The 2026 capital-expenditure range is $135 billion to $145 billion, and Q3 free cash flow was negative $2.12 billion.
- Muse adoption, proposed nonvoting Class C shares and continuing litigation make long-term AI returns, funding costs and shareholder protections as important to valuation as near-term ad revenue.
Published October 22, 2026. All financial results below refer to the three months ended September 30, 2026, and are drawn from Meta’s October 21, 2026 investor-relations earnings release, unless explicitly identified as third-party consensus, contemporaneous earnings-call reporting, market data or an independently calculated figure.
Verification note: The official Q3 2026 earnings-call transcript was not yet accessible on Meta’s quarterly earnings archive when this analysis was prepared. Accordingly, the management highlights below are expressly labeled as paraphrases of either Meta’s published CEO/CFO comments or remarks covered by the Associated Press during the call; none is presented as a verbatim excerpt from an unavailable official transcript.
Core Earnings Breakdown
Revenue and Profitability Analysis
Meta’s headline revenue growth was not the problem. Consolidated sales reached $64.601 billion versus $51.242 billion a year earlier, a reported and constant-currency increase of 26%. The company recorded $12.988 billion in GAAP operating income, down 37% from $20.535 billion, and its GAAP operating margin fell to 20% from 40%. Net income rose to $9.860 billion from $2.709 billion, while diluted GAAP EPS increased to $3.83 from $1.05. These changes require adjustment-aware interpretation: Q3 2026 absorbed a $9.89 billion litigation charge, while Q3 2025 was depressed by a separate $15.93 billion noncash tax charge.
Total Q3 operating costs and expenses were $51.613 billion, up 68% from $30.707 billion. Removing only the $9.89 billion current-quarter litigation charge yields $41.723 billion of costs, still roughly 35.9% higher year over year, calculated from company-reported figures. The underlying expense trajectory is therefore a genuine valuation issue, not just an accounting headline.
- Family of Apps (Facebook, Instagram, Messenger, WhatsApp and related services): Revenue was $64.158 billion, versus $50.772 billion a year earlier, for approximately 26.4% growth and 99.3% of consolidated sales. Its reported operating income was $17.117 billion, down from $24.967 billion. Investment implication: Meta’s established applications still fund almost the entire enterprise, but the gap between vigorous sales growth and weaker reported segment profit argues against treating the AI expansion as costless.
- Advertising within Family of Apps: Revenue reached $63.061 billion, up approximately 25.9% from $50.082 billion and representing approximately 97.6% of total company revenue. Management reported a 10% increase in ad impressions and a 14% rise in average price per ad. Investment implication: simultaneous volume and price growth points to resilient monetization, likely helped by recommendation and ad-ranking improvements, although those two operating metrics alone do not prove advertisers’ return on investment.
- Other Family of Apps revenue: Revenue rose to $1.097 billion from $690 million, approximately 59.0% growth, but only 1.7% of consolidated sales. Investment implication: nonadvertising monetization is progressing from a small base and is not yet large enough to meaningfully diversify Meta’s advertising-dependent earnings profile.
- Reality Labs: Revenue was $443 million, down from $470 million, or approximately 5.7%, with an operating loss of $4.129 billion versus a $4.432 billion loss a year earlier. Investment implication: the smaller loss is a positive directional signal, but Reality Labs remains a considerable earnings drag and should not be confused with Meta’s entire AI investment program.
The segment growth rates and sales weights above are calculated from company-reported figures. For example, advertising concentration equals $63.061 billion divided by $64.601 billion, or 97.62%. The company separately reported 3.64 billion average daily active people across its Family of Apps in September, up 3% from a year earlier. Engagement scale remains commercially valuable even as user growth becomes harder to sustain at such a large base.
The year-over-year EPS comparison is especially misleading without the prior year’s tax adjustment. Meta disclosed Q3 2025 diluted EPS of $7.25 excluding its $15.93 billion tax charge, compared with Q3 2026 EPS of $7.40 excluding the current $9.89 billion litigation charge. The resulting increase is only about 2.1% (($7.40 / $7.25) – 1), calculated from company-reported figures. These exclusions are illustrative, not a fully standardized adjusted-EPS series; other unusual items may remain in either period. The source for the prior-year adjustment is Meta’s Q3 2025 earnings release.
Expectations vs. Actual Results
Revenue — ✅ Beat: Actual revenue of $64.601 billion exceeded the $63.34 billion FactSet analyst consensus by $1.261 billion, or approximately 2.0%. It also surpassed the $64 billion upper bound of Meta’s own prior-quarter Q3 revenue guidance by $601 million. The FactSet comparison is documented in MarketWatch’s October 21 results coverage, and the former guidance appears in Meta’s Q2 2026 release.
Diluted EPS — ⚠️ Headline below published expectations, with a material comparability caveat: GAAP EPS was $3.83 versus the $6.54 FactSet expectation cited by MarketWatch, a difference of negative $2.71 per share. Meta said EPS would have been $7.40 excluding its identified $9.89 billion litigation charge, which is $0.86 above that quoted estimate. But the analyst estimate’s treatment of unusual items has not been independently reconciled with Meta’s charge-only exclusion; it would be inaccurate to call the latter a verified, like-for-like adjusted-EPS beat.
Operating margin — ⚠️ Reported contraction, not a verified consensus miss: GAAP operating margin was 20% versus 40% in Q3 2025. Excluding just the legal charge, the implied 2026 margin would have been approximately 35.4%. A directly comparable, independently verifiable preannouncement Street consensus for GAAP operating margin was not available, so no numerical consensus beat or miss is asserted.
Forward guidance — ✅ Midpoint above reported Q4 sales consensus: Management guided Q4 2026 revenue to $73 billion–$76 billion, a $74.5 billion midpoint. The Associated Press cited approximately $73.65 billion in analyst expectations, putting the midpoint $850 million, or roughly 1.2%, above that reference. Meta expects foreign-exchange movements to create an approximately one-percentage-point headwind to Q4 year-over-year revenue growth. Its full-year 2026 expense outlook is $175 billion–$179 billion, explicitly including the approximately $9.9 billion Q3 legal charge; its 2026 capital-expenditure outlook is $135 billion–$145 billion, versus a prior $130 billion–$145 billion range. Management expects full-year Reality Labs losses of $18 billion–$19 billion and a Q4 effective tax rate of 15%–17%, subject to changes in the tax environment.
What actually drove the revenue beat? The most substantiated explanation is resilient ad monetization: more delivered impressions, a higher average price per ad and ongoing improvements to recommendation and advertising systems. There is no evidence in the published numbers that Reality Labs or a newly scaled AI subscription business caused the surprise. On EPS and margin, the legal accrual is central, but excluding it does not erase elevated spending on the underlying operation.
What did the market prioritize? The initial reaction suggests investors assigned more weight to the advertising engine, Q4 sales outlook and Meta’s long-term AI opportunity than to the isolated GAAP EPS print. META closed the October 21 regular session at $697.52, up 0.47%, before the earnings release. A timestamped after-hours quotation of $712.65 at 8:00 p.m. Eastern on October 21 represented a 2.17% increase from that close, according to CoinGlass market data. That is an after-hours snapshot, not the October 22 regular-session closing return; no full post-earnings trading-day outcome is implied.
The stock’s positive immediate reaction therefore did not mean investors dismissed rising infrastructure costs, litigation or possible future equity issuance. Rather, the reported sales beat and midpoint-above-consensus guidance provided near-term support while the cash-flow and capital-structure debate remained open. This is a more useful interpretation than mechanically labeling every post-earnings move a reaction to EPS alone.
Earnings Call Highlights
These five points are faithful strategic paraphrases, not purported direct quotations from an unverified full transcript. Source distinctions are specified within each item.
- CEO Mark Zuckerberg highlighted the launches of Muse and Muse Wonder as milestones toward a personal-superintelligence product ecosystem (Meta’s official earnings-release statement; paraphrased). 💡 Reading Between the Lines: Meta is attempting to extend its distribution advantage beyond advertising into an AI assistant that could mediate consumer intent, commerce and services. The product opportunity is strategically substantial, but current group revenue still overwhelmingly comes from ads, so incremental Muse monetization has yet to be established in the reported segment data.
- Zuckerberg said more than 10 million people had established Muse accounts in the United States and Canada, around one-quarter of which were used on a given day, and outlined a goal of improving Muse compute-cost efficiency by more than tenfold over the following year (Associated Press coverage of the call; paraphrased). 💡 Reading Between the Lines: Registered accounts are not daily active users or paying subscribers: Meta has an early adoption funnel, not yet demonstrated unit economics. The greater-than-tenfold efficiency figure is a management target, not an achieved reduction, and lower inference cost would be essential before usage growth could translate into attractive contribution margins.
- The CFO’s published outlook narrowed 2026 capital expenditures to $135 billion–$145 billion from $130 billion–$145 billion and anticipated continued aggressive investment in 2027, without providing a numerical 2027 capital budget (Meta’s official CFO outlook; paraphrased). 💡 Reading Between the Lines: Meta is prioritizing compute capacity and infrastructure readiness before the full revenue payoff is visible, raising the cash-reinvestment assumptions required in a discounted-cash-flow model. Raising the lower end of the capex range reduces the chance of a materially lighter 2026 investment burden.
- The CFO’s published commentary linked existing AI investment to better engagement, recommendations and advertising monetization, while acknowledging that frontier AI opportunities will take longer to deliver returns (Meta’s official CFO outlook; paraphrased). 💡 Reading Between the Lines: Two investment cycles should be valued separately: mature ad-ranking improvements can support near-term sales, while foundational models and new AI products involve longer payback periods and uncertain monetization. Assuming the current advertising return on investment applies automatically to every new AI dollar would overstate economic visibility.
- Management proposed a listed, nonvoting Class C share class, including a conditional one-for-one Class C stock dividend to current Class A and B holders, to broaden future financing and compensation flexibility while preserving existing voting power (Meta’s official release; paraphrased). 💡 Reading Between the Lines: The proposed initial distribution is economically analogous to a share split, not immediate value creation or an automatic dilution event. The more important governance question concerns possible later Class C issuance for capital raising, employee awards or acquisitions without proportionate dilution of founder voting control.
For the call-specific Muse adoption and efficiency remarks, see the Associated Press report on the October 21 earnings call. Investors seeking direct quotation-level verification should consult the official transcript if and when Meta posts it on its investor-relations archive.
Deep Business Insights
Hidden Metrics That Matter
Two measures reveal more about Meta’s investment economics than the reported 265% year-over-year GAAP EPS increase.
- 1. Legal-charge-excluded operating margin: ($12.988 billion reported operating income + $9.890 billion Q3 legal charge) / $64.601 billion revenue = approximately 35.4%, calculated from company-reported figures. The comparable year-earlier reported operating margin was $20.535 billion / $51.242 billion = approximately 40.1%, calculated from company-reported figures. Even after excluding the current legal accrual, the margin declined by about 4.7 percentage points year over year. Charge-excluded operating income of $22.878 billion was only 11.4% higher than prior-year reported operating income, despite 26% sales growth. The proper question is whether incremental AI-related operating costs can eventually grow more slowly than advertising revenue, not whether investors should simply add back a legal bill.
- 2. Cash conversion after infrastructure spending: $32.786 billion of operating cash flow − $33.942 billion of property-and-equipment purchases − $0.964 billion of finance-lease principal = negative $2.120 billion of free cash flow, the non-GAAP figure disclosed by Meta and independently reconciled here from company-reported figures. Q3 2025 free cash flow was positive $10.625 billion, a $12.745 billion deterioration. Capex including finance-lease principal totaled approximately $34.91 billion in Q3. Crucially, reversing an accrual for analytical EPS purposes does not automatically put the same amount of cash back into the business; legal-payment timing must be evaluated separately from the cash consumed by physical infrastructure.
Why do advertisers continue choosing Meta? Its differentiator is the combination of audience scale, buying liquidity, established Facebook and Instagram ad inventory, recommendation-based discovery, cross-app consumer relationships and automation that helps advertisers access audiences without building equivalent distribution networks themselves. The 3.64 billion daily-active-people metric and simultaneous growth in impression volume and pricing provide evidence of significant reach and monetization power. But advertisers can reallocate spend, measurement is imperfect and rising ad prices alone do not prove that incremental conversions remain profitable for customers.
This difference matters for forecasting. In the established ad system, Meta already monetizes engagement directly; in frontier AI, spending precedes proof of repeat usage, revenue per user and contribution margin. Management’s Muse figures are promising funnel indicators, but they are not yet sufficient to assign the agent a stand-alone revenue multiple.
Industry Chain Reactions
- ✅ Potential beneficiary — NVIDIA (NASDAQ: NVDA). Meta’s large infrastructure budget supports demand for accelerated computing, advanced networking and data-center systems. This is more than a speculative industry association: NVIDIA announced a multiyear infrastructure partnership with Meta in February 2026 covering CPUs, Blackwell and Rubin GPUs and networking. The investment implication is favorable exposure to the buildout, not a claim that every dollar of Meta’s $135 billion–$145 billion group capex guidance flows to NVIDIA or that any particular future order is guaranteed.
- ❌ Potential competitive pressure — Snap (NYSE: SNAP). As Meta expands ad impressions while maintaining higher average prices, competing social platforms must defend performance, engagement and advertiser budget share. Snap’s SEC-filed annual report identifies the intensely competitive digital advertising environment. This is a competitive inference from Meta’s strength, not evidence that Snap missed any specific quarter’s estimates or that its revenue has already declined because of Meta’s Q3 results.
Valuation Framework and Key Risks
Price anchor: META’s last completed U.S. regular-session close before the report was $697.52 on October 21, 2026. The four most recently reported quarterly diluted GAAP EPS figures were $8.88 in Q4 2025, $10.44 in Q1 2026, $6.18 in Q2 2026 and $3.83 in Q3 2026. Their sum is $29.33; $697.52 / $29.33 = approximately 23.8 times trailing GAAP EPS, calculated from company-reported figures and the observed stock price. Relevant source releases are Q4 2025, Q1 2026, Q2 2026 and the linked Q3 2026 release.
That trailing multiple needs careful handling. Q1 2026 GAAP EPS benefited by $3.13 per share from a company-identified income-tax item, while the Q3 2026 litigation charge reduced EPS by $3.57. A narrow mechanical sensitivity that removes only those two impacts gives $29.33 − $3.13 + $3.57 = $29.77 in illustrative trailing EPS, and approximately 23.4 times earnings at $697.52, calculated from company-reported figures. This is not a company-reported normalized EPS, a clean recurring earnings estimate or a forward P/E; other special items remain, including expenses identified in Q2.
The market is consequently pricing a business with proven ad-market strength and substantial AI optionality, but also a material infrastructure reinvestment burden. The decisive valuation variable is not simply the growth rate of AI-related capital spending: it is whether cumulative investment ultimately generates incremental operating cash flow faster than depreciation, maintenance, inference costs and financing needs rise. No numerical target price is justified from the disclosed data alone.
Three distinct risks demand monitoring. First, funding and governance: Meta ended Q3 with approximately $82.45 billion of cash, cash equivalents and marketable securities and $80.92 billion in long-term debt. The proposed Class C dividend is not itself economic dilution, but later issuance of nonvoting stock could expand the share count and preserve concentrated voting control. Investors should model potential equity funding separately from the anticipated split-like price adjustment.
Second, legal exposure: The $9.89 billion Q3 charge relates to Meta’s agreement with 52 state attorneys general providing for payments of up to approximately $18.59 billion. Separately, a New Mexico judge ordered a $25 billion penalty in a privacy case on October 21; Reuters reported Meta planned to appeal. The New Mexico ruling must not be automatically treated as a component of the disclosed Q3 settlement charge or as a final paid cash outflow. Appeal outcomes, additional accruals and payment schedules remain uncertain.
Third, execution: Meta expects Reality Labs’ 2026 operating loss to fall within $18 billion–$19 billion and anticipates approximately $15 billion in losses in 2027, while redirecting resources toward AI. Management expects continued strong overall revenue growth in 2027 but supplied no full-year 2027 revenue forecast and no quantified 2027 capex plan. Investors should therefore resist inventing a 2027 financial guidance range to fill the gap.
A constructive investment interpretation would require Meta to maintain ad-price and impression momentum, convert AI-driven usage into measurable revenue, moderate underlying cost growth and eventually restore positive free cash flow after infrastructure spending. The adverse case is one in which high inference costs, enduring legal liabilities, weak adoption economics or future share issuance consume the upside from an otherwise durable advertising business. Those are conditional frameworks, not predictions of future results.
Key FAQs
Did META beat Q3 2026 earnings estimates after the $9.89 billion legal charge?
Meta beat the quoted FactSet revenue consensus, reporting $64.601 billion versus $63.34 billion expected, but its $3.83 GAAP diluted EPS was below the $6.54 FactSet estimate cited by MarketWatch. Meta disclosed that EPS would have been $7.40 without the identified $9.89 billion legal charge. Because the analyst estimate and the company’s single-item exclusion may use different accounting conventions, the $7.40 comparison should not be marketed as a formally verified adjusted-EPS beat.
Why did META stock rise after its Q3 2026 report despite a 20% operating margin?
The immediate after-hours advance was consistent with investor relief over 26% sales growth, advertising monetization and Q4 revenue guidance of $73 billion–$76 billion, despite substantial legal costs and AI spending. A timestamped quotation showed $712.65 in after-hours trading versus the $697.52 October 21 regular close, an increase of about 2.17%. The margin drop still matters: stripping out the legal charge leaves an estimated 35.4% operating margin, below the prior year’s roughly 40.1%. The after-hours print is not a completed next-day market return.
What are Meta’s Q4 2026 revenue guidance and full-year 2026 AI capital spending plans?
Meta officially guided Q4 2026 consolidated revenue to $73 billion–$76 billion and full-year 2026 capital expenditures, including finance-lease principal, to $135 billion–$145 billion. It also guided 2026 total expenses to $175 billion–$179 billion, including the Q3 litigation charge. These are management outlooks, not realized financial results. Meta did not disclose a specific 2027 capex budget or full-year revenue target in its Q3 release.
Sources and verification: The primary financial source is Meta Platforms’ official Q3 2026 earnings press release and CFO outlook; management call coverage was checked against Associated Press, and transcript availability against Meta Investor Relations’ earnings archive.
Disclaimer: This article/chart is for educational and informational purposes only and does not constitute investment advice of any kind. Past performance is not indicative of future results. Investors should independently evaluate their own risks.