


Key Takeaways
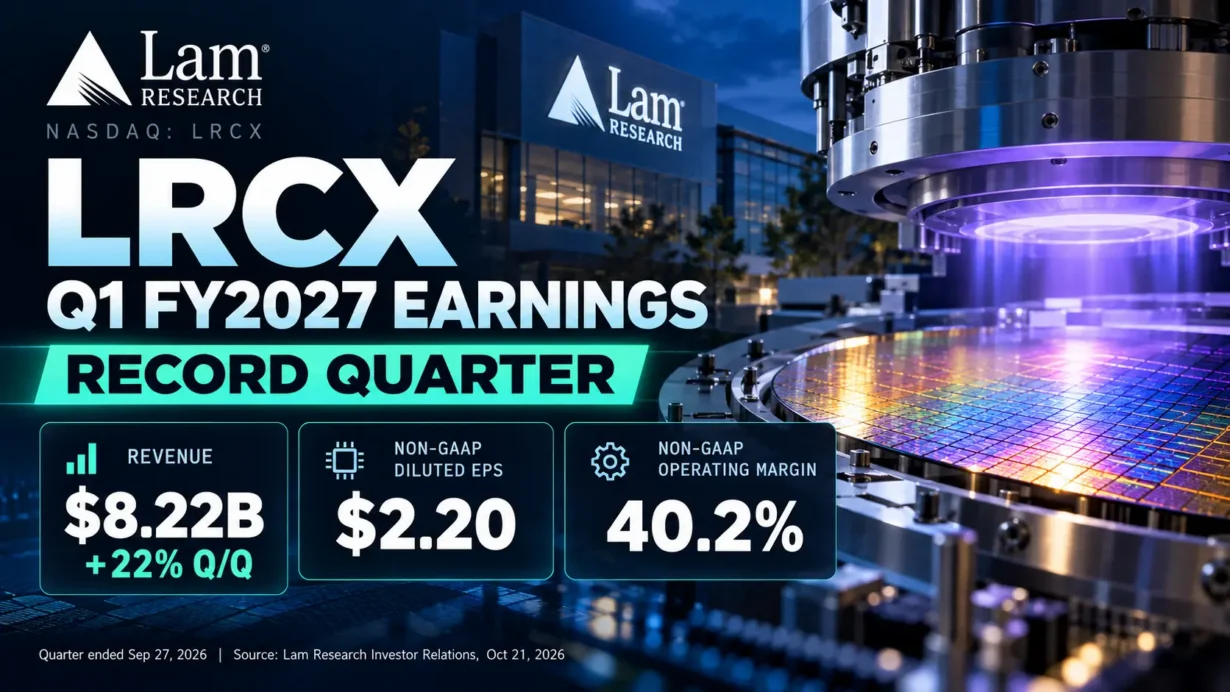
- Lam Research delivered $8.219 billion in fiscal Q1 2027 revenue, up 22.3% sequentially and 54.4% year over year, with non-GAAP EPS of $2.20 and a record 40.2% non-GAAP operating margin.
- Revenue and adjusted EPS beat the cited Wall Street consensus of $8.13 billion and $2.18, respectively, but the earnings surprises were modest relative to the scale of the industry investment cycle.
- Systems revenue surged 34.9% quarter over quarter to $5.733 billion, while customer support-related revenue and other rose only 0.6% sequentially. Equipment systems generated approximately 99.1% of total sequential revenue growth, calculated from company-reported figures.
- Fiscal Q2 2027 guidance calls for $8.60 billion in revenue and $2.33 in non-GAAP EPS at the midpoints. Management said component supply constraints prevented an even higher revenue outlook.
- LRCX fell approximately 6%–7% in reported October 21 after-hours trading despite the beat, putting attention on guidance upside, China exposure, capacity bottlenecks and the valuation already assigned to AI-related growth.
Lam Research (NASDAQ: LRCX) reported fiscal first-quarter 2027 results on October 21, 2026, for the quarter ended September 27, 2026. This LRCX Q1 2027 earnings analysis separates reported results from sell-side estimates, management forecasts and independent calculations. Financial results are taken from Lam’s official investor-relations release; strategic comments were checked against the company’s earnings slides and a publicly available third-party transcript of the conference call. Share-price observations refer to October 21, 2026, U.S. trading, not a subsequent regular-session close.
Core Earnings Breakdown
Revenue and Profitability Analysis
Lam generated $8,219,418,000 in revenue, versus $6,722,238,000 in the preceding quarter and $5,324,173,000 a year earlier. That represents 22.3% quarter-over-quarter growth and 54.4% year-over-year growth, calculated from company-reported figures. The September quarter was the company’s fifth consecutive quarterly revenue record, according to CFO Doug Bettinger.
On a U.S. GAAP basis, gross margin was 52.3%, operating margin was 40.0%, net income was $2.753 billion and diluted EPS was $2.19. Non-GAAP gross margin was 52.4%, operating margin was 40.2%, net income was $2.768 billion and diluted EPS was $2.20. Relative to the June quarter, non-GAAP gross margin expanded 40 basis points and operating margin improved 180 basis points. These are distinct accounting measures; the higher adjusted figures should not be confused with GAAP results.
The underlying profit story was stronger equipment volume, favorable customer and product mix, and operating leverage. Non-GAAP operating income rose to approximately $3.301 billion from $2.581 billion, even though non-GAAP operating expenses increased to $1.004 billion from $916 million as Lam funded incentive compensation, engineering and capacity expansion. CFO Bettinger attributed the gross-margin improvement to customer and product mix, while warning that the adjusted effective tax rate rose to 16.5% from 11.0% in June and could stay near that higher level. This matters because the EPS beat was not simply the product of a lower tax rate.
Lam reports two principal revenue categories in its quarterly release:
- Systems revenue: $5.733 billion, or 69.7% of total revenue. Growth was 34.9% sequentially and 61.6% year over year, calculated from company-reported figures. Investor interpretation: this is evidence of powerful equipment demand and process-intensity gains, but it also concentrates near-term growth in the more capital-spending-sensitive portion of the business.
- Customer support-related revenue and other: $2.487 billion, or 30.3% of total revenue. Growth was 0.6% sequentially and 40.0% year over year, calculated from company-reported figures. Investor interpretation: the installed-base franchise remains an important source of repeat business, but its near-flat sequential performance means it was not the principal driver of this quarter’s revenue acceleration.
Within systems revenue, the company also disclosed end-market exposure rather than separate GAAP business-segment sales: foundry accounted for 46%; DRAM, 20%; nonvolatile memory, primarily NAND, 26%; and logic/other, 8%. Together, memory represented 46% of systems revenue. These percentages must not be mistaken for shares of consolidated revenue.
- Foundry reached record revenue and increased its systems mix to 46% from 44% in June. Leading-edge production and advanced packaging are attractive structural drivers, although mature-node spending in China also helped this quarter and may be less durable.
- DRAM reached record revenue, although its systems share fell from 23% to 20% because other categories grew faster. The investment opportunity is Lam’s expanding role in the HBM and advanced-patterning process flow, rather than a simple extrapolation of the DRAM mix percentage.
- Nonvolatile memory grew to 26% of systems sales from 23%; management said NAND revenue increased approximately 40% sequentially as customers invested in 256-layer-and-above conversions and began work on 384-layer-class devices. The opportunity is a longer equipment-upgrade cycle, but the pace depends on customers’ ability to take production tools offline without sacrificing output.
- Logic/other represented 8% of systems revenue, down from 10%. This smaller category remains relevant to advanced-node spending, but a falling mix share by itself does not establish an absolute revenue decline.
Expectations vs. Actual Results
For an apples-to-apples earnings comparison, the revenue and EPS expectations below come from Investing.com’s contemporaneous analyst-consensus snapshot; the margin benchmark is Lam’s own July 2026 guidance midpoint, not a purported Wall Street operating-margin consensus. Different data vendors may publish slightly different consensus snapshots.
- Revenue — actual $8.219 billion vs. analyst consensus $8.13 billion: ✅ Beat by about $89 million, or 1.1%.
- Non-GAAP diluted EPS — actual $2.20 vs. analyst consensus $2.18: ✅ Beat by $0.02.
- Non-GAAP operating margin — actual 40.2% vs. prior company guidance midpoint 39.5%: ✅ Above guidance midpoint by 70 basis points. An independently corroborated analyst-consensus figure for this specific margin was not available, so the company target is explicitly identified as the comparison.
- Non-GAAP gross margin — actual 52.4% vs. the company’s prior 52.0% midpoint: ✅ Above the midpoint by 40 basis points.
Lam’s previous guidance for September was $8.10 billion in revenue, 39.5% adjusted operating margin and $2.15 adjusted EPS, all at the midpoint. The result cleared those internal benchmarks. However, the revenue beat over the independent analyst estimate was only about 1.1%, and the adjusted EPS beat was just two cents. The economically meaningful upside came from systems demand and incremental operating leverage; there was no evidence in the reported figures of a large, unusual acquisition gain supporting adjusted EPS.
Management’s fiscal Q2 2027 outlook for the quarter ending December 27, 2026 is as follows:
- Revenue: $8.60 billion ± $400 million (range $8.20 billion–$9.00 billion).
- Non-GAAP gross margin: 52.5% ± 1 percentage point.
- Non-GAAP operating margin: 40.5% ± 1 percentage point.
- Non-GAAP diluted EPS: $2.33 ± $0.15, using approximately 1.253 billion diluted shares.
These are management forecasts, not realized results. The $8.60 billion revenue midpoint implies just 4.6% growth from the reported September quarter, calculated from company-reported figures. Against Investing.com’s cited December-quarter consensus of $8.54 billion in revenue and $2.32 in adjusted EPS, the revenue guidance midpoint was only $60 million higher and EPS only $0.01 higher. That limited uplift mattered more to the market than the small historical beat.
Reported share-price action underscores the distinction. LRCX closed the October 21 regular U.S. session at $260.81, down 1.0% on the day, before the earnings release. Contemporary post-release coverage then reported an after-hours decline of roughly 6%–7%; such extended-hours indications are volatile and are not the following day’s confirmed closing price. The stock’s negative response was therefore not a contradiction of the reported earnings. Investors appeared to focus on the narrow cushion above forward consensus, the supply-chain-limited outlook and the growth already embedded in valuation.
Management explicitly said the December revenue guide would have been somewhat higher without near-term component constraints but declined to quantify the lost opportunity. That makes a simple “sell the news” explanation inadequate: the market may have priced in a larger step-up in near-term shipments than Lam could commit to. Neither the earnings release nor the discussed call supplied evidence of a newly announced acquisition or acquisition-related share dilution causing the reaction. A confirmed cause-and-effect attribution for every after-hours trade is not possible.
Earnings Call Highlights
The following management points are faithful paraphrases rather than purported verbatim quotations. They are grounded in the October 21 conference-call transcript and Lam’s official accompanying presentation. Each interpretation is independent analysis.
CEO Tim Archer: Lam’s preliminary calendar 2027 wafer fabrication equipment (WFE) outlook exceeds $200 billion, led by DRAM growth, followed by leading-edge foundry/logic and NAND; demand visibility extends through 2028.
💡 Reading Between the Lines: This is the central valuation debate: Lam is positioning itself as a beneficiary of both higher semiconductor capital expenditures and a larger share of process steps per wafer. The $200 billion-plus figure is an early industry estimate, not Lam’s own order backlog or a guaranteed market outcome, and cleanroom availability can delay realization.
CFO Doug Bettinger: The $8.60 billion December-quarter revenue outlook would have been higher without component supply constraints; shipments delayed from December are expected to move into March.
💡 Reading Between the Lines: Supply, rather than weak end demand, was management’s stated immediate constraint. Yet a shipment delayed into a subsequent quarter still changes cash timing, execution risk and the market’s willingness to pay for near-term earnings; no quantified shipment deferral was disclosed.
CEO Tim Archer: AI could create a new low-latency SLC-class NAND tier; under Lam’s illustrative model, each one-percentage-point shift in NAND bit mix toward SLC-class devices requires about 2% more installed wafer capacity for unchanged bit demand.
💡 Reading Between the Lines: The investment thesis is evolving from simply adding NAND layers to building capacity for differentiated storage performance. This 2% relationship is a management scenario, not a measured 2026 customer mix shift, and adoption timing remains uncertain.
CEO Tim Archer: Aether dry-resist technology is ramping in high-volume HBM manufacturing, while panel-level plating equipment has already shipped to more than 20 customers; Lam expects approximately $2.5 billion of cumulative Aether revenue by decade-end.
💡 Reading Between the Lines: Product qualification and early placements can precede a multiyear revenue opportunity in advanced patterning and packaging, supporting Lam’s argument that its served available market is expanding. The $2.5 billion is a forward-looking company expectation, not recognized revenue or a contractual order book, and rivals will contest these applications.
CEO Tim Archer: Customer Support Business Group (CSBG) revenue is expected to grow more than 30% in calendar 2026 and more than 15% in calendar 2027, with equipment intelligence and Dextro cobots helping win performance-based service contracts.
💡 Reading Between the Lines: Lam wants to move the installed-base relationship beyond replacement parts into measurable equipment availability and process performance. That potentially raises switching costs and recurring revenue quality, but the company did not disclose a separate CSBG profit margin or a contracted amount for these new services.
Deep Business Insights
Hidden Metrics That Matter
1. Equipment systems generated approximately 99.1% of Lam’s sequential revenue increase. Calculation: ($5.732907 billion systems revenue − $4.249848 billion prior-quarter systems revenue) ÷ ($8.219418 billion total revenue − $6.722238 billion prior-quarter total revenue) = $1.483059 billion ÷ $1.497180 billion = 99.1% (calculated from company-reported figures). Customer support-related revenue and other contributed only $14.1 million of that increase.
This is more useful than the headline 22% sales growth. Lam’s economic engine in the September quarter was wafer-fab capital equipment, not a synchronized acceleration across both principal revenue categories. Strong systems orders are favorable for near-term operating leverage, but a cyclical slowdown in fab additions could weigh on consolidated growth even while the installed-base business remains healthy. Investors should monitor whether CSBG resumes sequential expansion rather than assume its 40% year-over-year rise implies constant quarter-to-quarter momentum.
2. Free cash flow equaled approximately 39.4% of quarterly revenue, with a relatively modest share returned during the quarter. Calculation: ($3.497652 billion operating cash flow − $0.257697 billion capital expenditures and intangible assets) ÷ $8.219418 billion revenue = 39.4% (calculated from company-reported figures). The resulting free cash flow was $3.239955 billion, matching Lam’s official presentation. Cash paid for treasury stock purchases and dividends totaled approximately $1.350 billion, or 41.7% of that free cash flow using cash-flow-statement figures (calculated from company-reported figures), versus management’s longer-term target of returning 85%.
Cash conversion is supportive, but not automatically repeatable: operating cash flow included a $535 million positive movement from operating assets and liabilities, and management is increasing investment in manufacturing capacity. The gap between the quarter’s distribution rate and its longer-term capital-return objective gives Lam flexibility to fund suppliers, labs and capacity, but shareholders should assess repurchase execution as well as the headline authorization. CFO Bettinger said $3 billion remained under the authorized repurchase program.
One additional accounting detail deserves care: deferred revenue increased to $2.66 billion, while the company separately estimated $468.3 million of future revenue on shipments to Japan pending customer acceptance. That Japanese amount is not included in deferred revenue under the company’s stated accounting treatment. Neither number should be treated as a substitute for a disclosed, cancellability-adjusted order backlog.
Why do customers work with Lam rather than simply choose the lowest equipment bid? Chipmakers qualify specific tools for tightly controlled process flows, and replacing a qualified system can create yield, uptime and integration risk. Lam’s fiscal 2026 Form 10-K explains that customers generally retain qualified suppliers for a given application and node when performance meets specification. Its installed base in NAND, process-specific deposition and etch technology, and service tools such as Equipment Intelligence and Dextro reinforce that advantage. Akara conductor etch, Aether dry resist, backside-power equipment and advanced packaging systems provide plausible avenues for new tool-of-record wins. The moat is based on manufacturing performance and the cost of requalification, not exclusivity; rival tools can still win future nodes or new applications.
Industry Chain Reactions
- ✅ Benefit — ASML Holding (NASDAQ: ASML). Lam’s preliminary assessment of a sharply larger 2027 WFE market, particularly in DRAM and leading-edge foundry/logic, supports the wider demand environment for sophisticated lithography equipment. ASML is not a direct substitute for Lam’s etch and deposition systems, so the read-through is primarily a shared capital-spending cycle rather than evidence that Lam’s earnings mathematically increase ASML’s revenue. Timing, capacity and customer tool mix still matter.
- ❌ Face Pressure — Applied Materials (NASDAQ: AMAT), in selected competitive applications. Lam’s announced process wins in advanced patterning, backside power and deposition/etch create possible share pressure for a company Lam identifies in its 2026 Form 10-K as a principal competitor in etch and dielectric/metals deposition. This is a conditional competitive implication, not proof of an AMAT market-share loss. A larger WFE market can simultaneously benefit AMAT’s absolute sales, limiting any negative stock read-through.
Valuation Framework and Key Risks
The valuation starting point must be dated. At the verified October 21, 2026 regular-session closing price of $260.81, one simple reference multiple is 29.6 times the September quarter’s annualized non-GAAP EPS run rate: $260.81 ÷ ($2.20 × 4) = 29.6 (calculated from company-reported EPS and the cited market price). This is not Lam’s reported trailing P/E, an analyst forward P/E, a fiscal 2027 EPS forecast or a price target. Annualizing one unusually strong quarter can overstate sustainable earnings for a cyclical equipment supplier; the after-hours repricing also changed the intraday reference price.
That simple multiple still illustrates why a two-cent EPS beat did not necessarily justify a higher stock price. Sustained premium valuation requires more than an expanding WFE total: Lam must convert customers’ multi-year project plans into shipped, accepted tools; advance its stated aspiration for gross margins in the mid-50% range without assuming those targets are achieved; and defend tool-level share as competitors introduce alternatives. The company discussed a longer-term opportunity to reach gross margins in the mid-50% range, but its actual reported September non-GAAP gross margin was 52.4%.
The risk hierarchy is concrete:
- China mix and export restrictions: China accounted for 35% of reported revenue, up from 26% in June. CFO Bettinger said that percentage should decline meaningfully in December, particularly as domestic-customer demand moderates. Geographic mix does not reveal the regulatory status of any individual customer, but it makes China-related policies and quarter-to-quarter customer timing important.
- Industry physical capacity: management expects cleanroom space and selected component constraints to remain limiting factors in 2027. A customer can approve capital spending before a fab is ready to receive, install and qualify a system.
- Technology adoption and competition: SLC-class NAND, next-generation dry resist, backside power and panel-level packaging are prospective growth vectors, not risk-free contracted sales. Process selection, customer qualification and rivals’ products can change the revenue timetable.
- Profitability and cash-flow normalization: recent record margins depend partly on favorable mix and scale. The non-GAAP tax rate has already risen to 16.5%, and the working-capital contribution to cash flow may not recur every quarter.
- Valuation sensitivity: a business priced on sustained AI capital intensity can fall after an objectively strong report if management’s next-quarter guide does not sufficiently exceed the expectations already embedded in the stock.
For the next report, the decisive evidence will be whether supply-limited December shipments are converted into March sales, whether China weakness is offset by DRAM/foundry growth elsewhere, whether CSBG reaccelerates sequentially, and whether gross-margin and cash-generation discipline holds as new capacity comes online. Management’s preliminary 2027 industry outlook should be tested against actual fab readiness and customer purchase schedules rather than treated as booked revenue.
Key FAQs
Why did LRCX stock fall after its Q1 2027 earnings beat?
Lam beat the cited analyst consensus by about $89 million in revenue and $0.02 in adjusted EPS, but its $8.60 billion December-quarter revenue guidance midpoint was only $60 million above the cited next-quarter consensus. Management said component constraints limited the guide, while the stock had already been valued for strong AI equipment demand. Contemporary reports showed a roughly 6%–7% October 21 after-hours decline; that movement should not be confused with the next regular-session closing return.
What was Lam Research’s Q2 fiscal 2027 revenue, margin and EPS guidance?
For the quarter ending December 27, 2026, Lam guided to $8.60 billion of revenue plus or minus $400 million, 52.5% non-GAAP gross margin plus or minus one percentage point, 40.5% non-GAAP operating margin plus or minus one percentage point, and non-GAAP diluted EPS of $2.33 plus or minus $0.15. These figures are official forecasts as of October 21, 2026, not actual Q2 results.
How does LRCX Q1 2027 earnings affect the AI, HBM and NAND equipment investment thesis?
Q1 showed record equipment sales, strong NAND investment and continuing DRAM/foundry demand, while management outlined potential additional deposition and etch steps for HBM, advanced patterning, backside power and AI-optimized NAND storage. The opportunity is broader equipment spending per advanced wafer, not merely more chips sold. The thesis remains sensitive to how quickly customers adopt these architectures, qualify Lam’s tools and make usable fab space available.
Sources: Lam Research’s official September 2026 quarter earnings release, official earnings presentation, previous-quarter guidance, Benzinga’s public earnings-call transcript (third-party transcription, cross-checked against the company slides), Investing.com’s dated consensus comparison, contemporaneous after-hours reaction, dated stock-price snapshot and Lam’s SEC-filed fiscal 2026 Form 10-K.
Disclaimer: This article/chart is for educational and informational purposes only and does not constitute investment advice of any kind. Past performance is not indicative of future results. Investors should independently evaluate their own risks.