


Key Takeaways
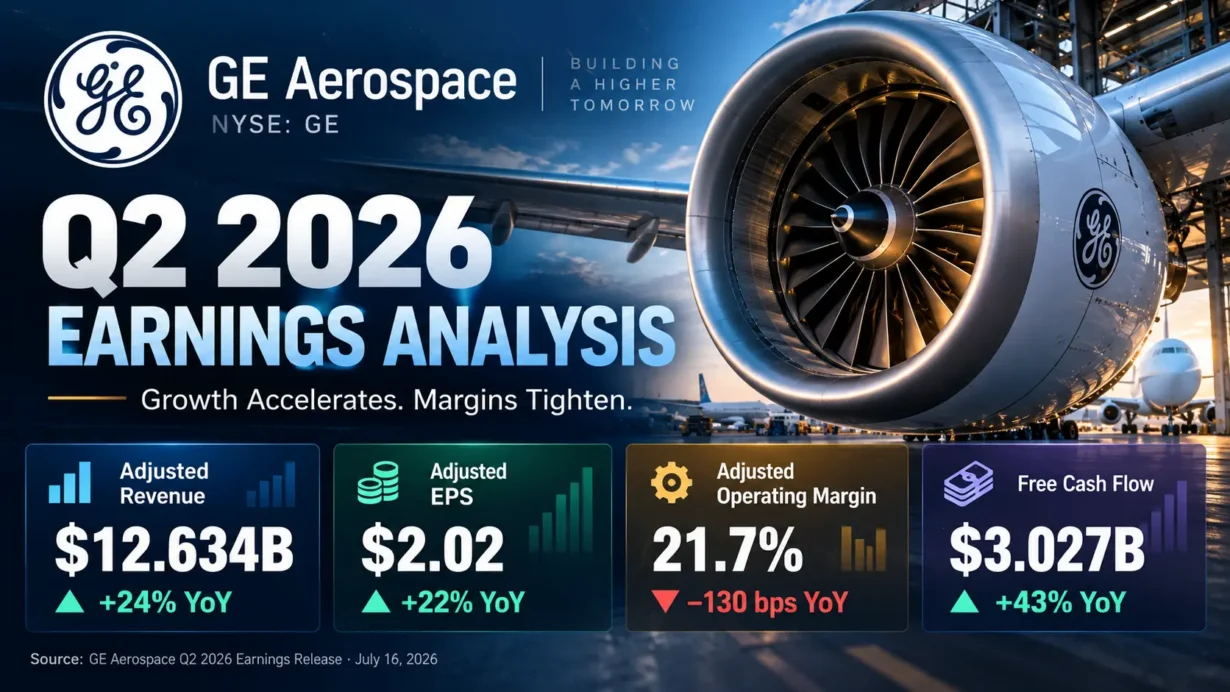
- GE Aerospace reported Q2 2026 GAAP revenue of $13.349 billion (+21%) and adjusted revenue of $12.634 billion (+24%); adjusted EPS of $2.02 exceeded the $1.86 analyst consensus.
- Commercial Engines & Services revenue rose 27%, but its operating margin fell 160 basis points to 27.3%. Consolidated adjusted operating margin also contracted 130 basis points to 21.7%.
- Despite beating revenue and EPS expectations and raising its 2026 guidance, GE shares declined approximately 4.1% on July 16. Investors had reasons to scrutinize aftermarket order growth, manufacturing constraints, and the price already embedded in the stock.
- The July earnings call revealed a consequential bottleneck: spare-parts shipments delayed by material constraints increased 20% sequentially, even as more than 95% of expected Q3 spare-parts revenue was already in backlog.
- As of October 22, following the subsequent Q3 release, GE traded at approximately 36.8 times the midpoint of its newly updated 2026 adjusted EPS guidance, using the October 21 closing price.
Published analysis date: October 22, 2026. This article reviews the quarter ended June 30 and GE Aerospace’s July 16, 2026 earnings call. Since GE subsequently reported Q3 results on October 20, any later developments are separately dated to prevent mixing the Q2 disclosure with current valuation inputs. Dollar figures are in U.S. dollars.
1. Core Earnings Breakdown
Revenue and Profitability Analysis
GE Aerospace (NYSE: GE) delivered strong underlying demand in the second quarter of 2026, particularly in aircraft engine maintenance and spare parts. According to its official July 16 earnings release, GAAP total revenue reached $13.349 billion, up 21% from $11.023 billion a year earlier. Adjusted revenue rose 24%, from $10.151 billion to $12.634 billion. Those are two different accounting measures: the $715 million gap in Q2 2026 was revenue from GE’s run-off insurance operations, excluded from adjusted revenue. They should never be interchanged when judging consensus expectations or operating margins.
GAAP profit increased 17% to $2.801 billion, while the GAAP profit margin slipped to 21.0% from 21.7%. On GE’s non-GAAP operating basis, profit climbed 18% to $2.746 billion, but adjusted operating margin narrowed to 21.7% from 23.0%. GAAP diluted earnings per continuing-operation share rose to $2.30 from $1.87; adjusted EPS rose to $2.02 from $1.66. Free cash flow advanced 43% to $3.027 billion, alongside $3.258 billion of GAAP cash flow from operating activities (+39%). Total company orders grew 17% to $16.5 billion.
The investment implication is not simply that GE grew more than 20%. Revenue expanded faster than operating profit, which means the company converted a smaller fraction of incremental sales into operating earnings. In aerospace, this can be economically rational when lower-margin new-engine deliveries enlarge a lucrative future service base. Yet the timing mismatch creates genuine valuation risk for a stock priced for both growth and consistently high profitability.
- Commercial Engines & Services (CES): Q2 revenue of $9.731 billion, up 27% from $7.646 billion. Services revenue grew 26%, including internal shop-visit revenue up 25% and spare-parts revenue up more than 25%. Equipment revenue rose 30%, supported by engine deliveries up 26% and LEAP engine deliveries up 24%. Segment operating profit reached $2.657 billion (+20%), but margin fell to 27.3% from 28.9%. Investment assessment: installed-engine growth supports the future aftermarket annuity, but a 160-basis-point margin decline shows shareholders are financing the ramp before collecting its full economic benefits.
- Defense & Propulsion Technologies (DPT): Revenue grew 16% to $3.443 billion from $2.978 billion; operating profit rose 18% to $475 million. Margin improved to 13.8% from 13.5%. Defense & Systems revenue was up 12%, while Propulsion & Additive Technologies grew 23%, led by Avio Aero. Segment orders increased 12% to $4.138 billion. Investment assessment: defense supplies a second multiyear demand channel and modest margin improvement, although its lower absolute margin means it cannot independently offset material CES profitability deterioration.
How much of the operating business does each segment represent? The two segments generated $13.174 billion of combined revenue before corporate eliminations: $9.731 billion + $3.443 billion. CES represented approximately 73.9% ($9.731 billion / $13.174 billion) and DPT 26.1% ($3.443 billion / $13.174 billion), both calculated from company-reported figures. GE then deducted $540 million of eliminations and other items to arrive at $12.634 billion of adjusted consolidated revenue. These are shares of gross reported segment sales, not GAAP consolidated revenue shares.
Expectations vs. Actual Results
Using contemporaneous analyst-consensus figures archived by MarketBeat, and keeping adjusted financial measures on a comparable basis:
- ✅ Revenue beat: adjusted revenue of $12.634 billion versus approximately $11.87 billion expected, a positive difference of about $764 million, or 6.4% relative to the rounded consensus figure. The GAAP revenue of $13.349 billion is not the appropriate numerator for this non-GAAP consensus comparison.
- ✅ EPS beat: adjusted diluted EPS of $2.02 versus $1.86 expected, a beat of $0.16 per share, or approximately 8.6%.
- ⚪ Operating margin: actual adjusted operating margin of 21.7%, down 130 basis points from 23.0% a year earlier. A reliable pre-release Wall Street margin consensus on the same non-GAAP definition could not be independently verified, so it would be misleading to label this specific metric a consensus beat or miss.
- ✅ Guidance raised: on July 16, GE increased its full-year 2026 adjusted revenue growth outlook to the high teens from low double digits, adjusted operating profit to $10.55–$10.75 billion from $9.85–$10.25 billion, adjusted EPS to $7.65–$7.85 from $7.10–$7.40, and free cash flow to $8.9–$9.2 billion from $8.0–$8.4 billion. These were management’s July forecasts, not realized results.
- ⚪ Next-quarter guidance: GE did not publish a separate numerical Q3 2026 revenue, EPS, or operating-margin guidance range in its July 16 release. The relevant disclosed outlook was for full-year 2026 and segment trends; inventing a Q3 range would distort the investment case.
What generated the beat? GE reported CES services revenue growth of 26%, driven by higher internal shop activity, spare-parts availability, and pricing, alongside 30% equipment sales growth. Commercial demand—not an unexplained accounting adjustment—was the main source of revenue outperformance. CFO Rahul Ghai stated that $0.31 of the $0.36 year-over-year adjusted EPS increase came from higher operating profit, while a lower tax rate and share-count reduction supplied the remainder. That makes the earnings improvement materially operational, even though the tax rate of 16.7% and a 24-million-share reduction also mattered.
Why did the shares fall? Historical NYSE price data shows GE closing at $360.35 on July 15 and $345.73 on earnings day, July 16, a drop of approximately 4.1%. The direction of that reaction diverged from the headline beats and higher annual forecast. One plausible reading is that investors cared more about the trajectory of commercial services growth, operating margins, and the ability to turn order backlog into actual shipments than about a backward-looking EPS beat. CES service orders increased 22% in Q2, slower than the 34% growth recorded for the first half; the sequential increase in spare-parts shipment delinquencies underscored execution constraints. Management also said the second half faced much tougher prior-year comparisons. Those facts do not prove a single cause of the selloff, but they are analytically stronger explanations than a generic claim of ‘selling the news.’
The July selloff should not be blamed on acquisition-related dilution: GE’s agreement to acquire Consolidated Precision Products (CPP) was not announced until September 8, nearly two months later. At the July release, the decision variable was principally how much durable aftermarket earnings the market was willing to capitalize, and how quickly those earnings could emerge despite engine-installation costs and capacity restrictions.
Earnings Call Highlights
The following points accurately paraphrase statements by CEO H. Lawrence (Larry) Culp and CFO Rahul Ghai in the company-hosted, July 16 earnings-call transcript. The interpretive comments are independent investment analysis, not management quotations.
- CEO Larry Culp: FLIGHT DECK process improvements supported record internal shop-visit output, better supplier throughput, and continued execution against a total backlog exceeding $210 billion. 💡 Reading Between the Lines: The strategic asset is not merely engine intellectual property; it is the ability to shorten complex repair cycles when airlines cannot afford downtime. Backlog only becomes high-quality earnings if GE improves material flow and on-time delivery without absorbing disproportionate incremental cost.
- CFO Rahul Ghai: Spare-parts shipment delinquencies grew 20% sequentially because of material constraints, despite spare-parts revenue rising more than 25%; over 95% of expected third-quarter spare-parts revenue was already in backlog. 💡 Reading Between the Lines: This is a capacity-constrained growth business rather than one obviously short of orders. The near-term earnings catalyst is converting delayed shipments into fulfilled demand; the corresponding downside risk is that delivery slippage persists even while reported orders remain strong.
- CEO Larry Culp: Certification of the LEAP-1B durability kit was completed, with management expecting approximately twice the time on wing from the upgraded configuration; LEAP shop turnaround times had declined to roughly 100 days. 💡 Reading Between the Lines: Longer time on wing can improve customer economics and strengthen future platform preference, even if it changes the timing of some maintenance events. Investors should analyze engine retention, service pricing, and installed-base growth together rather than equating more repairs with an automatically better customer proposition.
- CFO Rahul Ghai: About $0.31 of the $0.36 year-over-year adjusted EPS increase came from operating-profit growth; the tax rate declined to 16.7%, and shares outstanding were 24 million lower. 💡 Reading Between the Lines: Most of the EPS growth was supported by operations, but the lower tax burden and repurchases enhanced the per-share result. A disciplined valuation model should separately assess sustainable segment profit growth and the less repeatable effects of tax planning and share-count changes.
- CFO Rahul Ghai: Three forces were holding back margins—rapid new-engine installation growth, LEAP services profitability below the broader service portfolio, and early GE9X engine economics—with management viewing the pressures as timing-related. 💡 Reading Between the Lines: GE is absorbing near-term mix and startup costs to build later aftermarket opportunities, but the eventual recovery is an execution thesis, not a reported fact. The market’s premium multiple depends on management turning today’s engine delivery growth into future higher-margin service income on the schedule it has outlined.
2. Deep Business Insights
Hidden Metrics That Matter
The conventional narrative focuses on a 24% adjusted revenue increase and a $2.02 adjusted EPS print. Two deeper indicators better identify what shareholders actually own and what could derail the compounding story.
Metric one: backlog visibility paired with delayed conversion. At the time of the Q2 call, GE reported a commercial services backlog of roughly $170 billion, with more than 95% of anticipated Q3 spare-parts revenue already represented in backlog. Yet spare-parts shipment delinquencies—orders whose deliveries were delayed by material shortages—had risen 20% from the previous quarter. These are management-reported operating indicators, not evidence that the company has already monetized the full backlog. The key monitoring question is whether material receipts, spare-parts on-time deliveries, and shop turnaround times improve together. If they do, GE can unlock revenue already supported by customer commitments; if they do not, strong orders may coexist with uneven sales realization and customer frustration.
Metric two: the 21.5% absorption of incremental segment profit. CES operating profit increased by $449 million ($2,657 million minus $2,208 million), while DPT added $72 million ($475 million minus $403 million). Combined segment improvement was therefore $521 million. Adjusted corporate costs and eliminations increased by $112 million ($386 million minus $274 million), leaving a consolidated adjusted operating-profit increase of $409 million ($521 million minus $112 million). The $112 million reduction divided by $521 million of incremental segment profit equals approximately 21.5%—calculated from company-reported figures. This is an analytical attribution of one quarter’s year-over-year change, not a company-published margin ratio or a guaranteed recurring run rate.
Why would a customer choose GE despite that execution friction? GE’s installed base covered approximately 80,000 engines and had accumulated more than 2.3 billion flight hours, according to Culp’s July remarks. Engine selection is deeply intertwined with airframe compatibility, certification, maintenance infrastructure, airline fleet planning, and decades of spare-parts availability. The customer proposition is aircraft availability and total life-cycle cost, not simply a cheap engine invoice. GE’s engine data, engineering knowledge, approved service ecosystem, and capacity investments create substantial competitive advantages. For the LEAP program specifically, investors must also remember that CFM International is a joint venture between GE Aerospace and Safran; GE should not be assumed to capture 100% of the economics associated with every LEAP engine.
Another quality-of-earnings check is cash. Q2 free cash flow of $3.027 billion equaled approximately 24.0% of adjusted revenue ($3.027 billion / $12.634 billion), calculated from company-reported figures. GE also reported free-cash-flow conversion above 140%. However, Ghai acknowledged approximately $100 million of tariff refunds benefited quarterly cash flow and said conversion would normalize over time. The appropriate investment conclusion is that cash generation was substantial, not that every quarterly conversion benefit should be extrapolated indefinitely.
Industry Chain Reactions
- ✅ Potential beneficiary — The Boeing Company (NYSE: BA). Higher LEAP-1B production supports the Boeing 737 MAX engine supply chain, while GE’s GEnx manufacturing and shop-capacity improvements are relevant to Boeing’s widebody deliveries. The transmission mechanism is operational: GE’s ability to clear component bottlenecks can help aircraft manufacturers convert their own production schedules into delivered airframes. This benefit is conditional, because engine delays or GE9X development constraints can also limit Boeing’s ramp; GE’s Q2 figures alone do not establish a Boeing earnings uplift.
- ❌ Potential competitive-pressure exposure — Howmet Aerospace (NYSE: HWM). GE’s September 8 agreement to acquire precision-castings supplier CPP for $11.75 billion indicates that GE views critical castings capacity as strategically important. Greater vertical integration could eventually alter bargaining dynamics for independent aerospace component suppliers such as Howmet. This is a plausible strategic risk, not a proven loss of Howmet contracts or revenue. The deal was announced after Q2, is subject to regulatory approval, and was not completed as of this analysis; GE anticipated closing in the second half of 2027.
The common industry signal is that certified aerospace components and repair capacity remain scarce. Airlines, airframers, engine makers, and precision-parts suppliers can all have strong order books while the system as a whole fails to ship at the pace customers need. GE’s strategy increasingly targets ownership of that bottleneck—not just greater gross engine demand.
Valuation Framework and Key Risks
Valuation must use the guidance available on the valuation date rather than preserve a stale July denominator. On October 20, GE released Q3 2026 results and raised full-year guidance again: adjusted revenue growth of approximately 19%–20%, adjusted operating profit of $10.9–$11.0 billion, adjusted EPS of $8.00–$8.10, and free cash flow of $9.1–$9.4 billion. These are the later October management forecasts, not Q2 reported earnings or July guidance. Q3 itself produced adjusted revenue of approximately $13.3 billion and adjusted EPS of $2.25; the analysis here remains centered on Q2.
At the last completed U.S. regular session before this article’s October 22 analysis date, GE closed at $295.85 on October 21, according to ChartExchange’s historical price record. Dividing that share price by the $8.05 midpoint of GE’s October 20 full-year 2026 adjusted EPS guidance gives approximately 36.8 times ($295.85 / $8.05). This is a price-to-management-guided full-year 2026 adjusted EPS multiple, not a GAAP trailing P/E or a next-twelve-month consensus multiple. All such multiples depend on the specific definition and period of earnings used.
A simple valuation sensitivity demonstrates why expectations matter. Holding the $8.05 guidance midpoint constant, a hypothetical 30-times multiple implies $241.50 per share; a 40-times multiple implies $322.00. These values are mechanical illustrations ($8.05 multiplied by 30 or 40), not market price forecasts, price targets, or statements of fair value. At a multiple near 37 times, even strong reported growth can fail to lift the stock if investors revise the eventual margin profile or service-growth runway downward.
The central bull case is that a large installed engine fleet, growing commercial services backlog, certified durability improvements, and higher production throughput allow GE to convert demand into sustained earnings and free cash flow. The central bear case is not an immediate collapse in demand; it is that customers need better turnaround times while GE continues to absorb new-engine startup costs, material constraints, and competitive pressure on service pricing.
Investment risks to monitor include:
- Aftermarket growth deceleration: Q2 CES services revenue grew 26%, while management pointed to tougher second-half comparisons. The mix of parts, shop visits, pricing, and work scope matters more than a single growth percentage.
- Margin normalization risk: Q2 CES margin declined 160 basis points and company adjusted margin declined 130 basis points. LEAP service economics and early GE9X production costs remain significant variables; management’s comments about longer-term improvement are not guarantees.
- Supply-chain delivery risk: the 20% sequential rise in spare-parts delinquencies reveals the gap between demand visibility and the ability to serve customers promptly.
- Capital allocation and acquisition risk: the subsequently announced CPP transaction involves $11.75 billion of consideration, including a planned $7 billion cash component and new debt. Regulatory approval, financing, integration, and the possibility of overpaying can affect valuation even if the capacity strategy is industrially sound.
- Cash-flow quality and EPS composition: Q2 benefited from working-capital improvements, some tariff refunds, a reduced tax rate, and share repurchases. Those positive influences should be modeled separately from recurring operating margins.
- Airline utilization and program concentration: fewer flight hours, changes in engine retirement patterns, delayed Boeing or Airbus production, or slower certification and durability upgrades could change the timing of maintenance demand and installed-engine returns.
Three operating indicators deserve disproportionate attention in future results: spare-parts delinquencies and delivery reliability, the balance between CES service growth and the margin drag of new engines, and free-cash-flow conversion excluding unusual working-capital or tax effects. Together, they are a more useful test of the investment thesis than another isolated EPS beat.
3. Key FAQs
Did GE Aerospace beat Q2 2026 earnings estimates, and why did GE stock fall anyway?
Yes. GE Aerospace reported Q2 adjusted EPS of $2.02 against a $1.86 analyst consensus, and adjusted revenue of $12.634 billion against approximately $11.87 billion expected. Yet the stock fell around 4.1% on July 16, 2026, from $360.35 to $345.73. The earnings call highlighted margin pressure, lower year-over-year growth in quarterly services orders than the first-half pace, and ongoing spare-parts delivery constraints. These factors offer credible reasons investors may have reassessed the outlook despite positive headline results; the exact market attribution cannot be demonstrated from one day’s trading alone.
What did the GE Aerospace Q2 2026 earnings call reveal about LEAP engine durability and aftermarket demand?
Management said the LEAP-1B durability kit had been certified and was expected to approximately double time on wing for engines using the upgraded configuration. LEAP shop turnaround times were around 100 days, more than two weeks shorter than a year earlier. Meanwhile, GE cited approximately $170 billion of commercial services backlog and more than 95% visibility into Q3 spare-parts revenue from backlog. The investment question is whether better customer durability, engine-fleet growth, repair productivity, and aftermarket profitability reinforce one another rather than relying solely on high shop-visit volumes.
What was GE Aerospace’s 2026 guidance after Q2, and what is the latest guidance as of October 22, 2026?
Immediately after Q2 on July 16, management guided to high-teens adjusted revenue growth, $10.55–$10.75 billion of adjusted operating profit, $7.65–$7.85 of adjusted EPS, and $8.9–$9.2 billion of free cash flow for full-year 2026. GE then published Q3 results on October 20 and raised those forecasts to approximately 19%–20% adjusted revenue growth, $10.9–$11.0 billion of adjusted operating profit, $8.00–$8.10 of adjusted EPS, and $9.1–$9.4 billion of free cash flow. Neither guidance set represents actual full-year results, and the October figures must not be attributed to the July earnings call.
Sources and verification: This analysis uses GE Aerospace’s official Q2 2026 Investor Relations press release, the company’s Q2 financial release and non-GAAP reconciliations, the official-hosted July 16 earnings-call transcript, GE’s October 20 Q3 update, archived analyst expectations, and historical stock prices. Reported results, management guidance, third-party consensus, independent calculations, and analytical interpretations are identified separately.
Disclaimer: This article/chart is for educational and informational purposes only and does not constitute investment advice of any kind. Past performance is not indicative of future results. Investors should independently evaluate their own risks.