

Key Takeaways
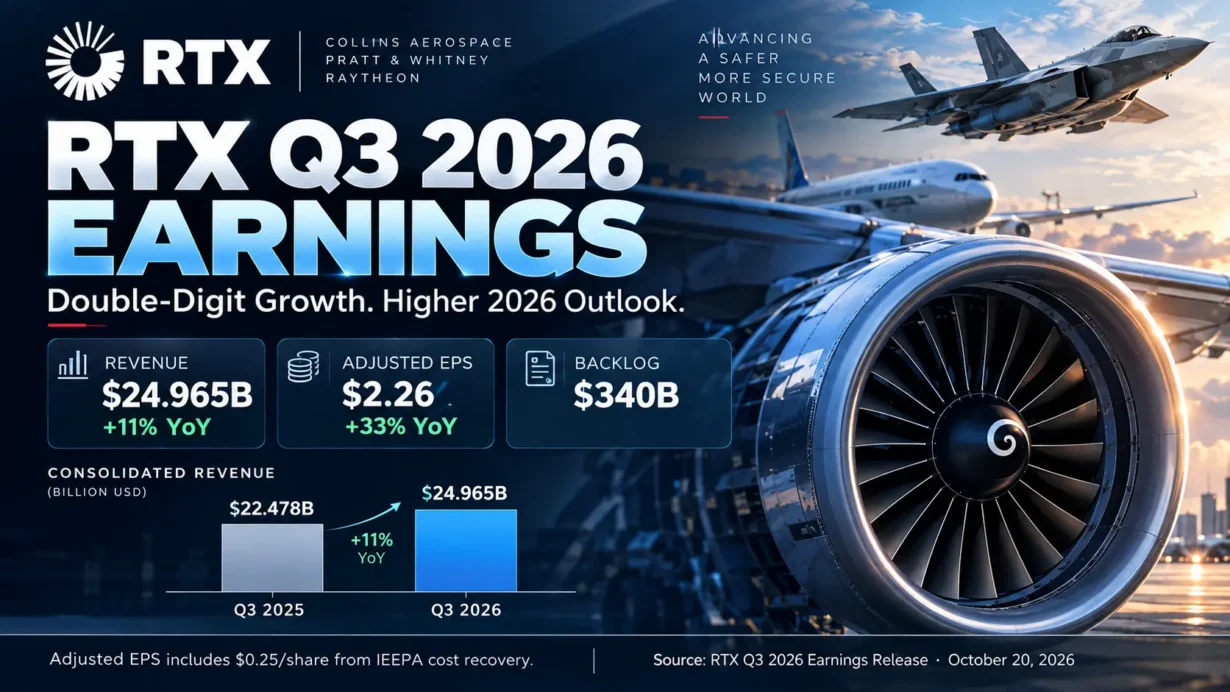
- RTX reported Q3 2026 revenue of $24.965 billion, up 11% year over year and 12% organically, and adjusted diluted EPS of $2.26, up 33%; both exceeded the LSEG consensus cited by Reuters.
- Quarterly adjusted EPS included $0.25 of IEEPA cost recovery. Excluding that identified benefit produces an analytical figure of $2.01, not a separately reported RTX earnings measure.
- Collins Aerospace, Pratt & Whitney and Raytheon all grew revenue, while adjusted segment operating margin reached 15.2%; management attributed approximately 160 basis points of that margin to IEEPA recovery.
- The record $340 billion backlog supports long-run visibility, but RTX’s Form 10-Q says only about 25% of remaining performance obligations should convert to revenue within 12 months.
- RTX lifted 2026 adjusted sales guidance to $97.0–$97.5 billion and adjusted EPS guidance to $7.65–$7.75. At the October 21 closing price of $191.60, the market still demands sustainable operating execution.
Published October 22, 2026. Financial results: quarter ended September 30, 2026; market valuation: NYSE closing price on October 21, 2026. All dollar amounts are in U.S. dollars unless indicated otherwise.
The essential question in RTX Q3 2026 earnings is not whether the company beat expectations. It did. The investment question is how much of the improved profitability can survive after unusual recoveries roll off, whether the defense order surge can be manufactured on schedule, and whether Pratt & Whitney can convert growing service demand into durable cash earnings.
1. Core Earnings Breakdown
Revenue and Profitability Analysis
RTX’s official Q3 2026 earnings release reported sales of $24.965 billion versus $22.478 billion a year earlier, an 11% reported increase and 12% organic growth. GAAP net income attributable to common shareholders was $2.583 billion, compared with $1.918 billion a year ago; GAAP diluted EPS rose to $1.89 from $1.41. Adjusted net income was $3.091 billion, up from $2.311 billion, while adjusted EPS advanced to $2.26 from $1.70.
Reported consolidated operating profit was $3.337 billion, translating to a 13.4% GAAP operating margin, versus 11.2% in Q3 2025. Adjusted consolidated operating profit was $3.987 billion, equivalent to approximately 16.0% of reported sales (calculated from company-reported figures: $3.987 billion ÷ $24.965 billion). Separately, RTX’s own preferred adjusted segment operating margin was 15.2%, up from 12.1% a year ago. These are different measures with different denominators and should not be treated as interchangeable.
For segment-mix comparability, the percentages below use total business-segment sales of $25.644 billion before $679 million in eliminations and other items, not consolidated revenue of $24.965 billion. Each mix figure is calculated from company-reported figures.
- Collins Aerospace: $8.382 billion in sales, up 10% reported and 12% organically; approximately 32.7% of gross segment sales ($8.382 billion ÷ $25.644 billion). Commercial original equipment (OE) grew 23%, commercial aftermarket 9%, and defense 7%. Adjusted operating profit rose 50% to $1.788 billion, with a 21.3% adjusted operating margin versus 15.7% a year earlier. Investment implication: the breadth of installed aircraft content and structural cost reduction supports operating leverage, but roughly $250 million of tariff-related recovery lifted this quarter’s profit.
- Pratt & Whitney: $9.231 billion in sales, up 10% reported and organically; approximately 36.0% of gross segment sales ($9.231 billion ÷ $25.644 billion). Commercial aftermarket sales advanced 21% on higher maintenance volume, primarily geared turbofan (GTF) engines, while commercial OE fell 5% and military engine sales increased 2%. Adjusted operating profit grew 29% to $968 million, implying a 10.5% adjusted margin versus 8.9% previously. Investment implication: servicing the installed engine base is a compelling long-duration revenue opportunity, but engine mix, overhaul throughput and execution matter more than the headline sales increase.
- Raytheon: $8.031 billion in sales, up 14% reported and organically; approximately 31.3% of gross segment sales ($8.031 billion ÷ $25.644 billion). Growth came from naval systems and land and air defense, including Patriot, Standard Missile and Tomahawk. Adjusted operating profit was $1.134 billion, up 32%, and adjusted operating margin reached 14.1% from 12.2%. Investment implication: stronger missile and defense-system volumes create valuable scale economics, although the quarter also benefited from about $85 million associated with an international contract modification and a favorable adjustment to an offset obligation.
One material GAAP-versus-adjusted distinction deserves special attention: Pratt & Whitney recorded a $363 million charge related to a customer bankruptcy, contributing to a 19% decline in its reported operating profit to $608 million even as its adjusted operating profit increased. RTX excludes the identified charge from its adjusted presentation; the exposure still matters when judging counterparty and contract-asset risk.
Expectations vs. Actual Results
Reuters’ October 20 report cited LSEG analyst consensus of $24.08 billion in quarterly revenue and $1.78 in adjusted EPS. The comparison is with published, pre-release market estimates, not with a forecast constructed for this article.
- ✅ Revenue beat: $24.965 billion actual versus $24.08 billion estimated; approximately $885 million, or 3.7%, above consensus (calculated from the cited actual and estimate).
- ✅ Adjusted EPS beat: $2.26 actual versus $1.78 estimated; $0.48, or approximately 27.0%, above consensus. Excluding the specifically disclosed $0.25 IEEPA benefit gives analytical EPS of $2.01 ($2.26 − $0.25), still $0.23 above the published consensus. This analytical adjustment does not establish what analysts had assumed about recoveries.
- ⚪ Operating margin, not scored against consensus: actual adjusted segment margin was 15.2%, versus 12.1% a year earlier; actual GAAP consolidated operating margin was 13.4%. A reliable, like-for-like pre-release street consensus for either specific margin definition could not be verified, so labeling the margin a consensus beat or miss would be unsupported.
- ✅ Full-year guidance raised: management increased 2026 adjusted sales guidance to $97.0–$97.5 billion from $95.0–$96.0 billion, organic sales growth to 10%–11% from 8%–9%, adjusted EPS to $7.65–$7.75 from $7.10–$7.25, and free cash flow to $9.0–$9.2 billion from $8.5–$8.75 billion.
What actually drove the beat? Demand was real: commercial OE, aerospace aftermarket and defense all posted double-digit organic growth at the company-wide channel level. But the earnings surprise was magnified by approximately $400 million of IEEPA recovery in adjusted segment operating profit, equivalent to about $0.25 per adjusted share. The Q3 operating margin expansion of 310 basis points included roughly 160 basis points from this recovery. Operational volume, cost actions and Raytheon productivity contributed too; the correct conclusion is neither that the entire beat was a one-off nor that the entire beat is recurring.
The 2026 adjusted EPS guidance midpoint increased from $7.175 to $7.70, a $0.525 increase (calculated from company-reported guidance ranges). Management’s call attributed approximately $0.28 of the midpoint improvement to operating performance and approximately $0.25 to IEEPA recovery, subject to rounding. This distinction matters for an investor capitalizing 2026 earnings at a long-term multiple: a refund received once should not automatically carry the same valuation as durable service and program profit.
RTX did not publish separate formal Q4 2026 sales or EPS guidance in this release. For orientation only, subtracting the officially reported nine-month results from the company-issued full-year outlook implies Q4 adjusted sales of approximately $25.251–$25.751 billion ($97.0–$97.5 billion minus $71.749 billion); mechanically implied adjusted EPS of approximately $1.72–$1.82 ($7.65–$7.75 minus nine-month adjusted EPS of $5.93); and free cash flow of approximately $2.694–$2.894 billion ($9.0–$9.2 billion minus nine-month free cash flow of $6.306 billion). These are calculations from company-reported figures, not standalone RTX Q4 guidance; period-to-period EPS aggregation can differ slightly because of share-count and rounding effects.
What mattered most to the market? More than the EPS beat alone, RTX needed to show repeatable Collins margins, Pratt overhaul capacity, firm defense orders translating to revenue and credible cash flow. The GTF Advantage and Hot Section+ upgrade programs are meaningful product-development checkpoints, but RTX’s valuation story rests more on installed-fleet economics and backlog execution than on a speculative product pipeline.
The stock’s initial reaction was restrained. RTX closed at $192.11 on October 19, before the release; at $193.34 on the October 20 announcement day, up 0.64%; and at $191.60 on October 21, down 0.90% on the day. Across those two sessions, it was about 0.3% below the pre-announcement close (calculated from verified historical closing prices). This is not evidence that investors rejected the reported growth. It is consistent with several plausible pressures: partial nonrecurrence of IEEPA benefits, cash-conversion concerns, production-risk skepticism, and a valuation already requiring sustained execution. The daily closes cannot establish any single motive, and there is no basis in these disclosures to attribute the decline specifically to an acquisition-dilution announcement or to reduce it to a generic “sell the news” narrative. The price history is available from Stock Analysis.
Earnings Call Highlights
Source discipline: The October 20, 2026 official earnings-call event page provides the presentation and audio replay, but did not list an official Q3 written transcript as of October 22. The management points below are accurate paraphrases checked against two independently published call transcriptions (Stock Analysis and The Motley Fool) and the official release/10-Q where applicable. They are not presented as verbatim quotes.
- CEO Chris Calio: Converting multiyear missile agreements into contractual production work gives Raytheon roughly a decade of demand visibility, with planned production rates rising two- to fourfold on relevant programs. 💡 Reading Between the Lines: RTX is shifting the investor debate from order capture to factory throughput. Multiyear agreements can justify supplier tooling and capacity, but the speed of profit recognition depends on actual program costs, deliveries and appropriations rather than contract headlines.
- CEO Chris Calio: PW1100 GTF maintenance, repair and overhaul output rose more than 35% year over year in Q3; management expects aircraft-on-ground pressure to ease in Q4, while GTF Advantage and Hot Section+ target longer time on wing. 💡 Reading Between the Lines: Improving maintenance turnaround is strategically important because airline availability affects both customer loyalty and service economics. The future upgrade benefits and Q4 improvement remain management expectations, not completed operating outcomes.
- CEO Chris Calio and CFO Neil Mitchill: Collins is consolidating facilities, shifting more work to efficient locations and reducing overhead; third-quarter margin expansion reflects these actions as well as exceptional recoveries. 💡 Reading Between the Lines: The durable value driver is cost per unit, not a one-quarter reported margin record. Investors should monitor whether Collins sustains improvement after the roughly 300-basis-point segment benefit from IEEPA reverses.
- CFO Neil Mitchill: Approximately $0.28 of the increased 2026 adjusted EPS midpoint comes from stronger company performance and approximately $0.25 from IEEPA cost recovery. 💡 Reading Between the Lines: The higher guidance is supported by genuine operations, but roughly half of the midpoint increase is linked to an identified exceptional item. A normalized valuation should not treat those two contributions as equally repeatable.
- CFO Neil Mitchill: Lower powder-metal-related cash payments may provide roughly a $500 million cash-flow tailwind in 2027, but expiring tariff refunds, pension costs and working-capital needs present offsets; formal 2027 guidance has not yet been issued. 💡 Reading Between the Lines: The end of legacy compensation payments is a cash-flow catalyst, not a guarantee of equivalent incremental free cash flow. Profit growth must cover capacity investment and working capital before investors can assign a higher sustainable cash-generation rate.
2. Deep Business Insights
Hidden Metrics That Matter
Metric 1 — margin quality after unusual recovery. RTX’s Q3 adjusted segment operating margin was 15.2%, up 310 basis points from 12.1% in Q3 2025. CFO commentary identified approximately 160 basis points of IEEPA benefit. Subtracting it gives an estimated 13.6% adjusted segment margin without that identified benefit (15.2% − 1.6 percentage points), or roughly 150 basis points above Q3 2025. This is calculated from company-reported figures and the management earnings-call bridge, not an additional RTX-reported non-GAAP measure. The same logic shows that Collins’ 21.3% reported adjusted margin falls to approximately 18.3% when its roughly 300-basis-point recovery benefit is subtracted; that would still compare favorably with its 15.7% prior-year adjusted margin. The critical test for future results is whether structural productivity keeps margins moving higher once the favorable comparison disappears.
Metric 2 — backlog duration matters more than the headline multiple. RTX’s Form 10-Q identifies about $340 billion in remaining performance obligations as of September 30, 2026, with approximately 25% expected to be recognized as revenue over the following 12 months. In addition, roughly 40% relates to long-term commercial aerospace maintenance contracts at Pratt & Whitney, generally realized over as many as 20 years. Multiplying these disclosed percentages by $340 billion gives roughly $85 billion in next-12-month recognition and $136 billion associated with these long-duration Pratt service contracts; both dollar figures are calculated from company-reported figures and are approximate. They are overlapping descriptions of the same backlog, not additive buckets. The disclosure comes from RTX’s filed Q3 2026 Form 10-Q, Note 19.
Why does this matter to the investment thesis? Customers choose RTX for more than a single piece of equipment. Airlines need certified engines, spares, engineering data, global overhaul capacity, predictable aircraft availability and contractual life-cycle support. For example, British Airways’ July selection of GTF engines for 33 firm and 30 option A320neo aircraft also included a 12-year EngineWise maintenance agreement, according to RTX’s official announcement. This engine-and-service combination creates a long customer relationship and switching friction, even as it leaves RTX exposed to execution and warranty obligations.
Defense customers likewise value mature, interoperable systems, qualification history, industrial scale and the ability to supply allied countries over long procurement cycles. That is a meaningful competitive barrier in Patriot, Tomahawk and the Standard Missile family. It is not immunity from budget decisions: RTX’s 10-Q explicitly says the critical-munitions contracts remain subject to annual congressional appropriations and production investment, even though contractual remedies may apply if funding changes.
A cash-quality cross-check reinforces the need for discipline. Q3 free cash flow fell 47% to $2.119 billion from $4.025 billion a year ago, while adjusted net income increased. Quarterly free-cash-flow conversion was about 68.6% of adjusted net income ($2.119 billion ÷ $3.091 billion), versus approximately 174.2% a year earlier ($4.025 billion ÷ $2.311 billion); both are calculated from company-reported figures. These are single-quarter measures affected by timing, not evidence of permanent deterioration. Nine-month free cash flow, by contrast, increased to $6.306 billion from $4.745 billion, and the Q3 amount included about $300 million in tariff-related cash receipts and approximately $165 million in powder-metal-related compensation payments. It is important to track both the quarterly volatility and full-year delivery.
Industry Chain Reactions
- ✅ Could benefit — Howmet Aerospace (NYSE: HWM). Howmet supplies precision castings, forgings and other engineered components into aviation engines and explicitly discusses its involvement in Pratt & Whitney’s geared-turbofan ecosystem on its aerospace business page. Higher GTF maintenance throughput, aircraft production and supply-chain expansion could increase demand for qualified engine components. This is a directional industry read-through, not a disclosed dollar-value award to Howmet arising from RTX’s Q3 results.
- ❌ Could face competitive pressure — GE Aerospace (NYSE: GE), through its 50%-owned CFM International engine joint venture with Safran. CFM’s LEAP-1A competes with Pratt & Whitney’s GTF for Airbus A320neo-family engine selections, as reflected in GE Aerospace’s own product description. Pratt’s reported engine orders and the British Airways GTF selection show that the GTF remains an active competitor for future installed-base economics. This does not demonstrate a quantified loss to GE, nor does it imply GE’s broader engine and services business will decline; both franchises can grow as the overall aircraft fleet expands.
The transmission mechanism in both cases is slow: suppliers benefit only when RTX translates demand into manufacturing and overhaul orders, while competitors feel the impact over aircraft delivery cycles and subsequent aftermarket contracts. Neither reaction should be modeled as immediate revenue purely because RTX reported a large backlog.
Valuation Framework and Key Risks
Using the verified October 21, 2026 closing price of $191.60 and RTX’s 2026 adjusted EPS guidance of $7.65–$7.75, the shares traded at approximately 24.7–25.0 times management’s guided current-year earnings (calculated from $191.60 ÷ $7.75 and $191.60 ÷ $7.65). This is a multiple on guided 2026 adjusted EPS, not a forecast of next-12-month earnings and not a claim about the appropriate fair value.
Because the full-year guidance includes about $0.25 of IEEPA EPS recovery, a simple one-item normalization reduces the guidance range to $7.40–$7.50 per share ($7.65–$7.75 less $0.25). At $191.60, that corresponds to approximately 25.5–25.9 times this analytical earnings range. These are calculated from company-reported figures and the verified closing price; the $7.40–$7.50 range is not RTX guidance and makes no adjustment for other possible one-time or cyclical effects.
That valuation supports an investment case only if investors gain confidence in three mechanisms: Collins converts volume growth into recurring margin gains; Pratt delivers more reliable fleet maintenance and improves longer-term economics; and Raytheon converts funded missile programs into profitable output without excessive upfront capital demands. The record backlog is an important advantage, but treating its full face value as near-term revenue would overstate visibility.
The principal risks to underwrite are:
- Normalization risk: IEEPA recoveries and selected favorable contract adjustments inflate a comparison that will become harder to repeat.
- GTF technical and service execution: aircraft-on-ground levels, engine removals, shop capacity, warranty exposure and Hot Section+ certification timing could delay anticipated improvement.
- Funding and production constraints: multiyear U.S. defense agreements remain exposed to appropriations, supplier bottlenecks, skilled labor, electronics and materials availability, and the cost of scaling production.
- Cash conversion and counterparty risk: a customer-bankruptcy charge, contract assets, higher working capital, capital spending and powder-metal compensation can separate adjusted earnings from cash generation.
- Commercial aviation and valuation risk: higher airline fuel costs or weaker passenger demand could affect flight activity and service economics, while a multiple above 25 times one-item-normalized current-year earnings leaves room for a rerating if execution disappoints.
Investment conclusion: RTX’s Q3 results strengthen the demand and competitive-position thesis, especially in aerospace service and critical munitions. They are less decisive for the quality-of-earnings thesis. The most informative next evidence will be the fourth-quarter margin bridge without comparable one-time benefits, GTF shop throughput and AOG trends, funded defense production milestones, and actual free cash flow. Management indicated that a detailed 2027 outlook would follow with the fourth-quarter earnings call; there was no formal 2027 financial guidance in the Q3 release.
3. Key FAQs
Did RTX beat Q3 2026 earnings estimates, and how much of the EPS beat was one-time?
Yes. RTX reported $24.965 billion in sales versus the $24.08 billion LSEG consensus reported by Reuters and adjusted diluted EPS of $2.26 versus $1.78 expected. The $0.48 EPS beat included a disclosed $0.25 IEEPA recovery benefit. Removing that specific amount results in analytical adjusted EPS of $2.01, still above the published consensus; this is not a substitute for a fully normalized earnings calculation.
What is RTX’s Q4 2026 earnings outlook after the Q3 results?
RTX raised its full-year 2026 adjusted EPS guidance to $7.65–$7.75, sales guidance to $97.0–$97.5 billion and free cash flow guidance to $9.0–$9.2 billion. It did not issue an independent Q4 forecast. Subtracting nine-month company-reported results gives an illustrative Q4 adjusted EPS range of approximately $1.72–$1.82 and sales of $25.251–$25.751 billion, calculated from company-reported figures rather than independently issued Q4 guidance.
Is RTX stock attractive after Q3 2026 earnings and the $340 billion backlog?
At the October 21 closing price of $191.60, RTX traded near 24.7–25.0 times guided 2026 adjusted EPS and approximately 25.5–25.9 times that guidance after removing the identified $0.25 IEEPA benefit. The $340 billion backlog improves multi-year visibility, but its mix and timing matter: RTX expects only approximately one-quarter of remaining performance obligations to become revenue within 12 months. At this valuation, cash conversion, sustainable margins and contract execution are more important than the backlog headline alone.
Sources: RTX Investor Relations, RTX’s October 20, 2026 earnings release, the official earnings-call event and materials, the Form 10-Q filed with the U.S. SEC, Reuters’ LSEG consensus report, and a third-party call transcript. All cited URLs were checked against publicly accessible pages on October 22, 2026.
Disclaimer: This article/chart is for educational and informational purposes only and does not constitute investment advice of any kind. Past performance is not indicative of future results. Investors should independently evaluate their own risks.