



Key Takeaways
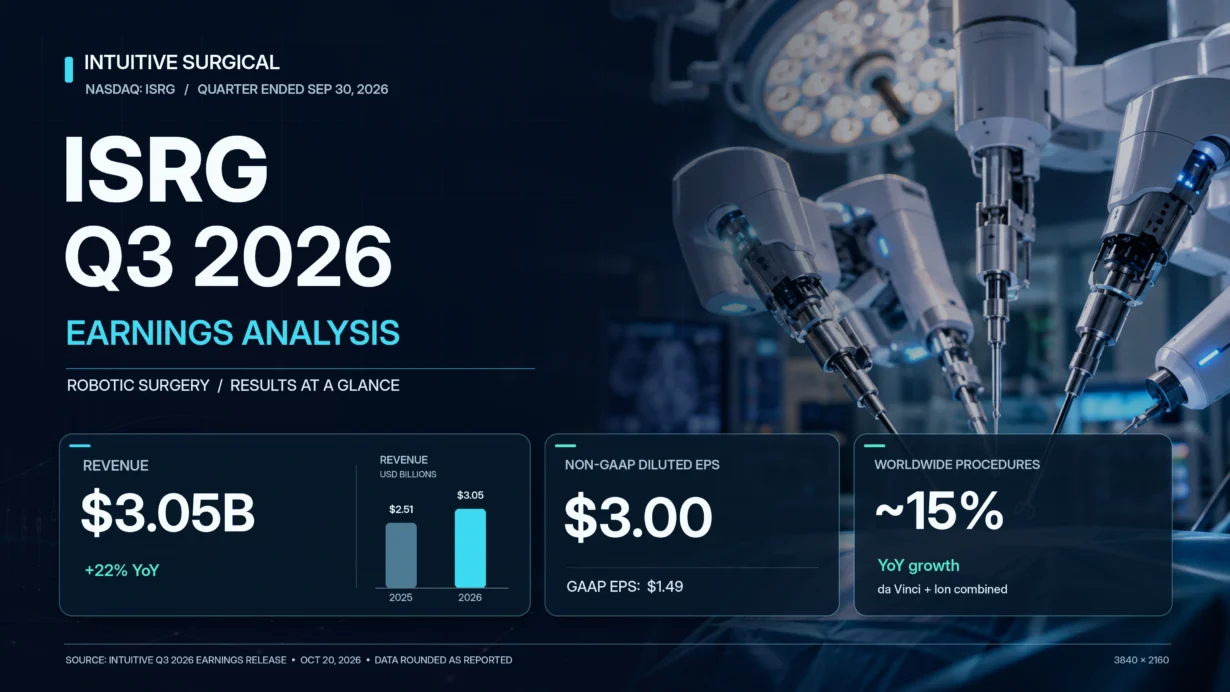
- Intuitive Surgical reported Q3 2026 revenue of $3,048.7 million, up approximately 22% year over year, and non-GAAP diluted EPS of $3.00 versus a published consensus of $2.65.
- GAAP diluted EPS was $1.49, affected by a $450 million pretax antitrust settlement charge; non-GAAP gross margin reached 69.9%, including a one-time tariff-refund benefit.
- Da Vinci placements rose to 546 systems, worldwide procedures across da Vinci and Ion grew approximately 15%, and management said 84% of revenue was recurring.
- Management narrowed full-year 2026 da Vinci procedure-growth guidance to 14%–15% while outlining planned changes expected to reduce da Vinci instrument-and-accessory revenue per procedure by 3%–5% on a constant-mix basis once fully implemented.
- ISRG closed at $428.12 on October 21, down 2.26% from its pre-earnings close, implying approximately 39.5 times the last four quarters’ reported non-GAAP EPS. The investment question is whether system adoption and case-volume growth can offset future pricing concessions.
The headline earnings beat was real, but it was not the entire story. Intuitive’s installed base and utilization are expanding while management is deliberately lowering the price of selected instruments to penetrate economically sensitive procedures. That combination can support a larger long-term addressable market, yet it also changes how investors should model per-procedure monetization, operating margins and competitive durability. The following analysis separates reported financial results, independently sourced consensus estimates, management’s stated outlook and analytical inferences.
1. Core Earnings Breakdown
Revenue and Profitability Analysis
For the quarter ended September 30, 2026, Intuitive generated $3,048.7 million of revenue, versus $2,505.1 million a year earlier. That is 21.7% growth calculated from the unrounded reported amounts, consistent with the company’s headline figure of 22%. Revenue expanded faster than approximately 15% growth in combined da Vinci and Ion procedures, reflecting new-system demand, revenue from operating leases and a broader installed base.
Revenue-line shares and year-over-year changes below are calculated from company-reported figures: share = Q3 2026 revenue line ÷ $3,048.7 million; growth = (Q3 2026 revenue line ÷ Q3 2025 revenue line − 1) × 100. The company reports these as revenue categories rather than separate reportable operating segments.
- Instruments and accessories: $1,797.4 million, or 59.0% of total revenue, up 18.3% from $1,518.8 million. Investment interpretation: this remains the most direct expression of installed-system usage and procedure economics; it is also the line most exposed to the newly disclosed instrument-pricing strategy.
- Systems: $769.1 million, or 25.2% of revenue, up 30.3% from $590.4 million. Investment interpretation: robust placements are extending the future consumables-and-service revenue opportunity, but the expanding lease model means installation counts should not be confused with immediate cash sales.
- Services: $482.2 million, or 15.8% of revenue, up 21.8% from $395.9 million. Investment interpretation: a larger installed base creates an increasingly durable servicing relationship, complementing the recurring economics of instruments, accessories and operating leases.
Da Vinci systems placed increased to 546 from 427 a year ago, including 315 da Vinci 5 systems versus 240 last year. Intuitive also placed 56 Ion systems versus 50 in Q3 2025. At quarter-end, the installed bases stood at 12,094 da Vinci systems and 1,152 Ion systems, up 12% and 21%, respectively, year over year. Management reported approximately 14% da Vinci procedure growth and 31% Ion procedure growth. Within da Vinci, the U.S. grew 10%, while markets outside the U.S. grew 20%; single-port procedures rose 55%. The geographic divergence is especially important because U.S. procedural momentum was slower than the consolidated headline suggested.
Profitability requires a GAAP/non-GAAP distinction. GAAP gross margin was 68.4%, while non-GAAP gross margin was 69.9%, up from 68.0% in Q3 2025. The non-GAAP figure benefited from a $28 million pretax refund of previously paid IEEPA tariffs; CFO Jamie Samath said it would have been approximately 68.9% without that benefit. GAAP operating income was $592.6 million, compared with $759.7 million a year earlier, because the quarter included the litigation charge. Non-GAAP operating income was $1,269.7 million, up from $975.9 million.
The operating margins, calculated from company-reported figures, were 19.4% GAAP ($592.6 million ÷ $3,048.7 million) and 41.6% non-GAAP ($1,269.7 million ÷ $3,048.7 million). Excluding the $28 million pretax tariff-refund benefit alone, the latter would be about 40.7% (($1,269.7 million − $28 million) ÷ $3,048.7 million). That is still above the prior-year non-GAAP operating margin of about 39.0% ($975.9 million ÷ $2,505.1 million), indicating meaningful operating leverage even after removing this particular benefit.
GAAP net income attributable to Intuitive was $522.8 million, or $1.49 per diluted share, versus $704.4 million, or $1.95, a year earlier. By contrast, non-GAAP attributable net income reached approximately $1.05 billion, or $3.00 per diluted share, up from $867 million and $2.40. The $450 million pretax antitrust settlement, equivalent to approximately $347 million after tax, reduced current-quarter GAAP EPS by $0.99, according to the company. Both GAAP and non-GAAP EPS included a $0.06 benefit from tariff refunds; therefore, the $3.00 figure is not entirely free of one-off tailwinds.
Expectations vs. Actual Results
For a consistent expectations comparison, this section uses the $2.91 billion revenue and $2.65 non-GAAP EPS pre-report consensus figures published by MarketBeat and reported by Investing.com. Estimates are third-party snapshots, not historical company results, and may vary by data provider.
- ✅ Revenue — actual $3.0487 billion versus approximately $2.91 billion expected: a beat of about $138.7 million, or 4.8% relative to that consensus.
- ✅ Non-GAAP diluted EPS — actual $3.00 versus $2.65 expected: a $0.35 beat, or approximately 13.2%. The $0.06 tariff-refund contribution accounts for approximately 17% of the $0.35 surprise ($0.06 ÷ $0.35), calculated from company-reported figures and the cited consensus.
- ⚠️ Operating margin — actual non-GAAP 41.6% and GAAP 19.4%, calculated from reported income and sales. A verifiable, like-for-like pre-release Q3 operating-margin consensus was not established from the public sources reviewed, so an operating-margin “beat” is not asserted. For context, the prior-year figures were approximately 39.0% non-GAAP and 30.3% GAAP.
- ✅ Reported gross-margin resilience — Q3 non-GAAP gross margin was 69.9%, versus 68.0% a year earlier; it was about 68.9% excluding the one-time tariff refund. This is a year-over-year comparison, not a claim of beating a separately verified margin consensus.
The underlying surprise was not just accounting. Systems revenue grew roughly 30%, and a broader lease-installed base supported revenue recognition, while cost reduction and fixed-cost absorption reinforced non-GAAP operating profitability. Nevertheless, the precise allocation of the revenue beat between systems, procedure volume and other drivers cannot be measured without reliable pre-release estimates for each revenue line. It would be inaccurate to assign a numerical surprise to any segment using only the company’s year-over-year growth data.
Even subtracting the $0.06 tariff-refund EPS benefit gives an indicative $2.94, still above the cited $2.65 consensus; that subtraction is an analytical adjustment rather than an additional company-reported non-GAAP measure. The more important distinction is between the quarter’s upside and the market’s next-period expectations. Intuitive’s full-year 2026 da Vinci procedure-growth outlook was narrowed to 14%–15%, with management expecting results nearer the midpoint. The previous range was 13.5%–15.5%, also near the midpoint; therefore, the midpoint remained 14.5%. This was a narrowing of the range, not a reduction of its midpoint. The company raised the full-year non-GAAP gross-margin range to 68.7%–69.3% from 68.0%–69.0%, while retaining its expectation for 11%–13% growth in non-GAAP operating expenses. The revised gross-margin outlook incorporates an estimated 0.9-percentage-point tariff headwind, excluding recognized tariff refunds.
For Q4 2026 specifically, management indicated an expected non-GAAP effective tax rate of 22%, plus or minus 0.5 percentage points. It did not give numerical Q4 revenue, diluted EPS or operating-margin guidance in the Q3 release or prepared call remarks. No values have been imputed here to fill those gaps. These are management’s disclosed forward-looking statements, not realized results.
ISRG finished October 20, the day the results were announced after the close, at $438.00. After a sharp negative initial response in extended trading, shares opened October 21 at approximately $402.50, traded as low as $398.99 and recovered to close at $428.12, down $9.88 or 2.26% from the pre-results close, according to Barchart market data distributed via Raymond James. Thus, the verified full-session reaction was materially less severe than some early post-release headlines suggested.
Why did the shares retreat despite an EPS beat? The defensible explanation is a repricing of uncertainty rather than a weak reported quarter: U.S. da Vinci procedure growth of 10% contrasted with 20% outside the U.S.; management disclosed the forthcoming 3%–5% constant-mix per-procedure pricing headwind; and the $450 million settlement drew attention to legal and customer-contract risk. Meanwhile, a still-premium earnings multiple leaves little tolerance for disappointing volume or margin trajectories. The settlement charge is not an acquisition-related dilution, and there is no evidence here that a dilutive acquisition caused the October 21 decline. Price action alone cannot establish which concern each investor prioritized. For a valuation-sensitive market, the practical hierarchy appears to be U.S. procedure momentum, future instrument revenue per case and sustainable margins ahead of the already-realized EPS beat; early-stage product and AI initiatives are longer-dated potential offsets rather than immediately verifiable earnings drivers.
Earnings Call Highlights
These five items accurately paraphrase management’s October 20 remarks and Q&A rather than reproducing extended quotations. The official Investor Relations event page provides the company-hosted webcast; a separately published written transcript is available from The Motley Fool. The official event page does not list a company-issued transcript.
- CEO Dave Rosa: The commercial strategy is shifting toward distinct customer segments, using da Vinci 5, single-port systems and lower-cost XiR configurations to fit clinical and economic needs.
💡 Reading Between the Lines: Intuitive is defending its installed-base advantage by offering more than one price and capability tier. This may enlarge adoption in benign surgery and outpatient settings, but makes product mix and realized system pricing more important than raw unit growth. - CFO Jamie Samath: Recurring revenue represented 84% of Q3 revenue, while net da Vinci placements that expanded the installed base grew approximately 40%.
💡 Reading Between the Lines: The economic asset is the ongoing hospital relationship, not simply a robot shipped this quarter. If utilization holds, today’s installed-base expansion can support successive years of instruments, accessories and service activity. - CFO Jamie Samath: Extended-use instruments, volume-based pricing and China policy changes are expected to lower da Vinci instruments-and-accessories revenue per procedure by 3%–5% on a constant-mix basis when fully rolled out.
💡 Reading Between the Lines: This is a calculated trade of price for potential procedure-volume elasticity, concentrated in cost-sensitive benign surgery. China reductions begin in November 2026, while the broader rollout starts in 2027 subject to relevant clearances; neither the volume offset nor the margin recovery is guaranteed. - Head of Investor Relations Dan Connally: Full-year da Vinci procedure growth is now expected at 14%–15%, non-GAAP gross margin at 68.7%–69.3%, and non-GAAP operating-expense growth at 11%–13%.
💡 Reading Between the Lines: The unchanged procedure-growth midpoint means management did not cut its central volume objective, although U.S. volume trends and Chinese competitive intensity remain constraints. The higher gross-margin range reflects better cost execution, not permission to ignore the upcoming pricing adjustment. - CFO Jamie Samath: Q3 share repurchases totaled $2.94 billion, and management continues to view a 35%–40% non-GAAP operating-margin range as consistent with significant reinvestment opportunities.
💡 Reading Between the Lines: The company is simultaneously reducing share count and funding product development, but investors should not automatically capitalize today’s roughly 42% reported non-GAAP operating margin as a permanent ceiling-free run rate. Management explicitly described room to redeploy margin into R&D and growth initiatives.
2. Deep Business Insights
Hidden Metrics That Matter
The first underappreciated metric is the installed-base expansion yield of system placements. Intuitive ended Q2 2026 with 11,710 da Vinci systems and Q3 with 12,094, a sequential net addition of 384. Relative to 546 da Vinci placements in Q3, that is 70.3% (384 ÷ 546 × 100), calculated from company-reported figures. In the comparable 2025 period, the installed base moved from 10,488 to 10,763, a net increase of 275; net additions therefore accelerated by 39.6% ((384 ÷ 275) − 1) × 100, calculated from company-reported figures. This independently corroborates management’s approximately 40% net-placement growth statement.
The remaining 162 systems (546 reported placements minus 384 net installed-base growth) should not be labeled as a disclosed replacement count. It is only an implied difference and can reflect replacements, retirements and other fleet movements. Why this matters: the economically attractive part of a placement quarter is how much genuinely new surgical capacity enters the ecosystem. Expansion that adds active surgeons and procedures has a different long-term earnings profile from upgrades replacing older systems.
The second metric is the balance between capital-light customer adoption and Intuitive’s own lease economics. Of the 546 Q3 da Vinci placements, 291 were under operating-lease arrangements: 53.3% (291 ÷ 546 × 100), calculated from company-reported figures. Of those 291 leased systems, 160 were usage-based: 55.0% (160 ÷ 291 × 100), calculated from company-reported figures. Lease-heavy adoption can lower hospitals’ upfront purchase hurdle and align charges with activity, potentially helping penetration of facilities with tighter capital budgets. The offset is that lease economics create ongoing capital, utilization, credit and contract-duration exposures for Intuitive, even as they contribute to a more recurring revenue mix. As a cross-check, instruments and accessories plus services represented 74.8% of reported revenue (($1,797.4 million + $482.2 million) ÷ $3,048.7 million × 100), calculated from company-reported figures; management’s broader 84% recurring-revenue figure also captures recurring sources within the systems category, including operating leases. These two measures should not be conflated.
These dynamics help explain the customer proposition. Hospitals are not purchasing only a capital device: they are buying surgical capabilities supported by instruments, maintenance, surgeon training, workflow integration, clinical evidence and a global network of experienced users. Management cited nearly 7,000 da Vinci customers in more than 70 countries, over 18,000 surgeons who have used da Vinci 5 since launch, and more than 48,000 peer-reviewed publications evaluating da Vinci surgery. Those figures support the existence of a broad ecosystem; they do not prove superior outcomes in every indication. Intuitive’s customer stickiness is likely reinforced by trained teams and established operating-room processes, but competition, hospital purchasing power and the antitrust settlement remain important limits on that advantage.
A further leading indicator is the gap between system innovation and monetization. Management said approximately 8% of da Vinci 5 cases used Force Feedback instruments during Q3, with supply availability limiting adoption for part of the quarter. It also described advanced imaging, voice controls and Ion programs for rapid on-site cytology and integrated endobronchial ultrasound as areas under development. These are potential long-duration drivers of clinical utility and revenue per procedure, not reported Q3 sales contributions that can responsibly be valued as realized earnings today.
Industry Chain Reactions
- ✅ Potential beneficiary — HCA Healthcare (NYSE: HCA). HCA reported operating 190 hospitals and 118 freestanding outpatient surgery centers at June 30, 2026, and HCA facilities publicly describe use of da Vinci systems. A broader portfolio of Intuitive system price points and planned lower per-case instrument costs could improve the economics of selected robotic procedures for large hospital and outpatient operators. The benefit is conditional on adoption, case mix, utilization and reimbursement; ISRG’s Q3 filing does not quantify a financial benefit for HCA. See HCA’s reported operating statistics.
- ❌ Potential competitive pressure — Medtronic (NYSE: MDT). Medtronic’s Hugo robotic-assisted surgery platform is already commercially active in U.S. urologic procedures, and the company is pursuing broader soft-tissue indications. Intuitive’s combination of 546 quarterly da Vinci placements, differentiated da Vinci 5 capability and lower-cost instrument programs can raise the burden on competitors to establish a compelling total-cost and workflow proposition. This is an assessment of competitive positioning, not evidence of a measured loss of Hugo share; expanding competition also poses a reciprocal risk to ISRG. See Medtronic’s September 2026 Hugo update.
Valuation Framework and Key Risks
At the verified October 21, 2026 closing price of $428.12, a simple trailing non-GAAP EPS multiple can be constructed entirely from already reported quarters. Non-GAAP diluted EPS was $2.53 in Q4 2025, $2.50 in Q1 2026, $2.80 in Q2 2026 and $3.00 in Q3 2026. Total: $2.53 + $2.50 + $2.80 + $3.00 = $10.83. Price divided by this sum is $428.12 ÷ $10.83 = approximately 39.5 times trailing reported non-GAAP EPS, calculated from company-reported figures and the cited closing price. The EPS inputs are documented in Intuitive’s Q4 2025, Q1 2026, Q2 2026 and Q3 2026 releases.
This is a trailing historical calculation, not a forward P/E, price target or forecast. It is also not a perfectly normalized earnings multiple: Q2 and Q3 included tariff-refund benefits of $0.08 and $0.06 per share, respectively, and Q4 2025 included certain discrete tax benefits. Moreover, Intuitive excludes stock-based compensation from non-GAAP profits even though it is an ongoing economic cost. The reported 39.5-times multiple therefore should not be confused with a multiple of fully recurring, GAAP-equivalent earnings.
One investment framework follows directly from the evidence:
- Constructive case: net installed-base additions continue to outgrow the existing fleet, procedure utilization stays positive, da Vinci 5 and SP penetration improves mix, and lower-cost instruments stimulate incremental high-volume benign procedures without eroding overall unit economics.
- Balanced case: strong recurring revenues and system growth coexist with 3%–5% constant-mix pressure on da Vinci instrument revenue per case, slower U.S. procedures and deliberate reinvestment that contains margin expansion.
- Adverse case: U.S. procedure growth weakens further, pricing elasticity disappoints, competitive tenders intensify, and a premium trailing earnings multiple compresses even while the business remains operationally profitable.
The main variables to monitor are not just adjusted EPS: they are quarterly U.S. and international procedure growth, net da Vinci installed-base additions, utilization per system, instrument revenue per procedure adjusted for product mix, Force Feedback adoption, operating-lease exposure, and non-GAAP gross margin excluding temporary refunds. Other genuine risks include China reimbursement and tender policy, U.S. insurance enrollment and reimbursement, tariff and input-cost volatility, regulatory clearances for extended-use instruments and new procedures, new robotic competition, customer contracting practices and the final court approval of the antitrust settlement.
Capital allocation also matters. Intuitive repurchased 7.8 million shares for $2.94 billion in Q3 at an average cost of roughly $377 per share, according to management, while ending the quarter with $6.80 billion in cash, equivalents and investments. A buyback can improve per-share economics, but cash deployed into repurchases cannot simultaneously finance manufacturing capacity, research or acquisitions. Management’s decision to maintain substantial R&D investment and develop a planned Malaysia manufacturing facility reinforces the point that this is a capital-allocation decision as well as a near-term EPS story.
Investment conclusion: ISRG’s Q3 operating performance supports the durability of its robotics ecosystem, but the stock’s valuation still assumes a favorable combination of procedure adoption, monetization and margin discipline. The central debate is whether Intuitive can earn back lower instrument prices through greater procedure volumes and innovation-driven product mix before competitive and regulatory pressures reshape the economics. The evidence is stronger for continued adoption today than for any precise prediction about 2027 earnings, which management has not yet formally guided.
3. Key FAQs
Did ISRG beat Q3 2026 earnings estimates, and why did the stock fall afterward?
Yes. Intuitive reported $3.0487 billion of revenue versus a cited consensus of approximately $2.91 billion, and $3.00 in non-GAAP diluted EPS versus $2.65 expected. The stock nonetheless closed 2.26% lower on October 21 after a sharper early selloff. Investors had to absorb a $450 million antitrust settlement, 10% U.S. da Vinci procedure growth versus 20% abroad, and management’s planned 3%–5% constant-mix reduction in instrument revenue per procedure. Those concerns help explain the divergence, although no single cause of the price movement can be proven.
What guidance did Intuitive Surgical issue after its Q3 2026 earnings call?
The company expects full-year 2026 da Vinci procedure growth of 14%–15%, non-GAAP gross margin of 68.7%–69.3% and non-GAAP operating-expense growth of 11%–13%. Management said it expected procedure growth nearer the midpoint of its range and gave Q4 2026 non-GAAP effective-tax-rate guidance of 22%, plus or minus 0.5 percentage points. It did not provide numerical Q4 revenue or EPS guidance in the reviewed Q3 release or prepared call commentary.
Will Intuitive Surgical’s new instrument pricing strategy reduce ISRG earnings?
Management expects upcoming actions, including extended-use instruments, volume-based pricing and a China policy-driven reduction, to lower da Vinci instrument-and-accessory revenue per procedure by approximately 3%–5% on a constant-mix basis when fully implemented. That is not the same as a 3%–5% reduction in companywide revenue. Management intends to offset part of the impact through more procedures, favorable innovation mix and manufacturing savings, but the actual effect on future earnings remains uncertain until prices, volume elasticity and costs are observable.
Sources and verification: Intuitive Surgical’s official Q3 2026 earnings press release and GAAP/non-GAAP reconciliation; its official Q3 2026 earnings conference-call event and webcast; the independently published call transcript; and the company’s Investor Relations website. Consensus and market prices are attributed separately in the text. All calculations identified as such use reported figures and disclosed formulas.
Disclaimer: This article/chart is for educational and informational purposes only and does not constitute investment advice of any kind. Past performance is not indicative of future results. Investors should independently evaluate their own risks.