
Key Takeaways
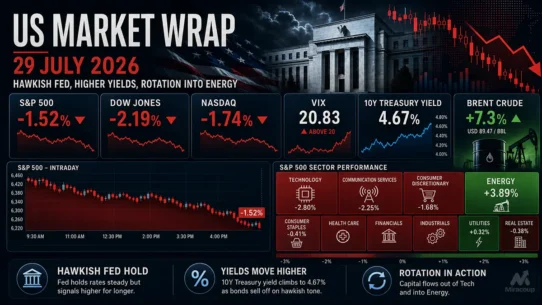
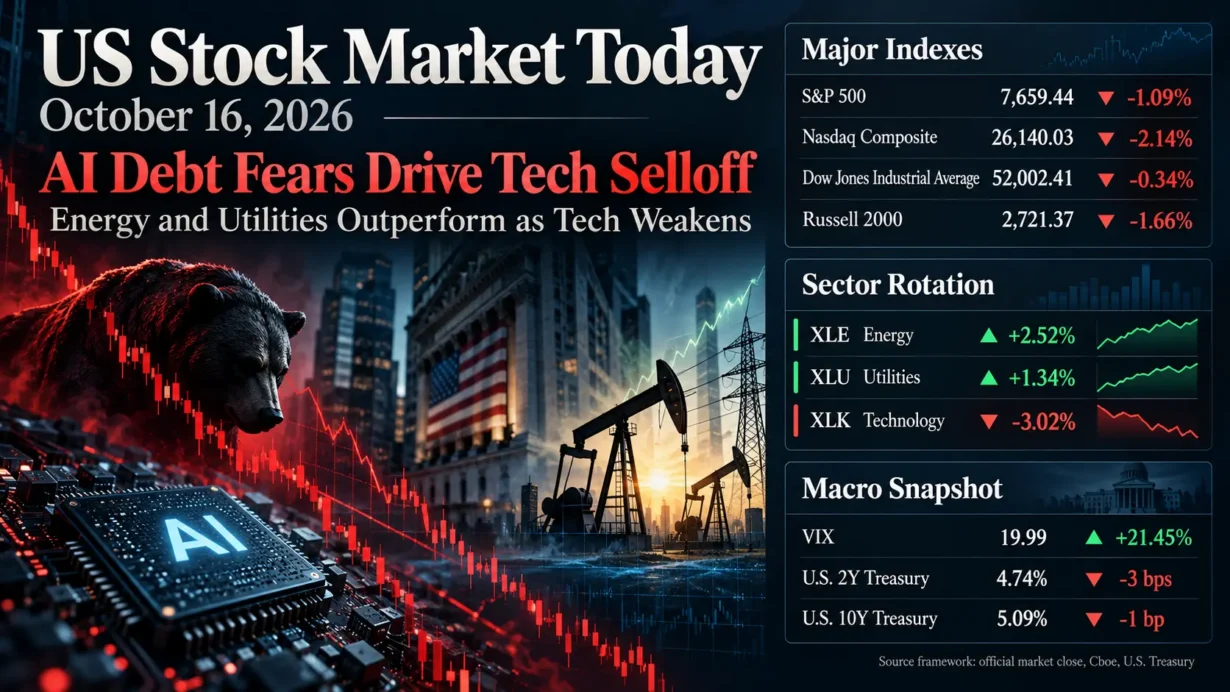
- The S&P 500 closed at 7,659.44 (−1.09%), the Nasdaq Composite at 26,140.03 (−2.14%), the Dow at 52,002.41 (−0.34%), and the Russell 2000 at 2,721.37 (−1.66%).
- AI infrastructure credit concerns hit growth stocks. As sector proxies, XLE gained 2.52% and XLU rose 1.34%, while technology ETF XLK lost 3.02%.
- September CPI rose 3.7% year over year and September final-demand PPI rose 1.3% month over month, complicating the Federal Reserve’s inflation outlook.
- The Cboe VIX climbed 3.53 points to 19.99 (+21.45%). Official Treasury constant-maturity yields stood at 4.74% for two years and 5.09% for ten years, both below Thursday’s readings.
1. Market Capital Flows and Sector Rotation
Friday’s decline was concentrated in crowded, long-duration growth exposures rather than evenly distributed across the market. The Nasdaq’s 2.14% loss far exceeded the Dow’s 0.34% decline, while smaller companies also lagged the S&P 500: the Russell 2000 fell 1.66%. The energy-linked cyclical trade diverged sharply from technology and consumer discretionary, and defensive utilities and consumer staples held up. The pattern favored value-oriented, cash-generative businesses over capital-intensive growth, though it was not a universal advance for all defensive or cyclical industries. The AP closing index report confirms the benchmark finishes.
For transparent sector comparisons, liquid Select Sector SPDR ETFs serve as proxies, not the official S&P 500 GICS sector-index returns: Energy (XLE) gained 2.52%, Utilities (XLU) 1.34%, and Consumer Staples (XLP) 1.08%; Technology (XLK) dropped 3.02%, Communication Services (XLC) 1.89%, and Consumer Discretionary (XLY) 0.84%. Six of the 11 sector ETFs advanced. The equal-weight S&P 500 ETF (RSP) declined just 0.42%, versus 1.11% for the capitalization-weighted SPY, a 0.69-percentage-point relative advantage. That divergence points to outsized index pressure from larger constituents, not broad-based capitulation. Sources: sector ETF closing tape, RSP history, and SPY history.
Institutional Flow Insight: The price pattern is consistent with, but does not prove, rotation toward businesses with more visible near-term cash flows and less dependence on refinancing. AI infrastructure credit repricing raises the discount rate on uncertain future profits even when Treasury yields ease. Higher oil prices supported energy producers but added inflation risk for the broader economy. Portfolio risk-budget reductions and relative-valuation discipline are plausible additional drivers; no verified institutional flow totals establish the precise motivation.
2. Decoding the Biggest Market Movers
CoreWeave (CRWV)
CoreWeave fell 11.91% to $61.39 at the regular-session close, becoming a focal point of the AI financing reset. Reuters reported that debt issued in June at a 9.675% yield traded at yields around 15% during the week. That is a secondary-market credit-risk signal, not a new company borrowing rate or an announced default. According to CoreWeave’s latest published quarterly earnings release, second-quarter revenue was $2.575 billion, but the company recorded a $49 million GAAP operating loss (−2% operating margin), a $626 million net loss (−$1.14 diluted EPS), and $640 million in net interest expense. Its 59% adjusted EBITDA margin must not be confused with a GAAP profit or free-cash-flow margin.
The company’s officially hosted August 11 earnings-call transcript explains that infrastructure spending comes before contracted revenue and requires debt, customer prepayments, and other financing; second-quarter capital expenditures totaled $9.4 billion. Its reported $104 billion June-end backlog represents conditional future commitments, not revenue already earned. The investment implication extends beyond CRWV: lenders’ willingness to finance data centers may influence margins, construction schedules, and valuation premiums throughout the AI supply chain, although less-leveraged chip designers and hyperscalers have different risk profiles. Verified CRWV closing price.
The Travelers Companies (TRV)
Travelers advanced 1.47% to $389.54 despite the market selloff. Its October 16 official third-quarter release reported $12.412 billion of revenue, $1.917 billion in GAAP net income, $9.04 in diluted GAAP EPS, and $9.18 in diluted core EPS, a non-GAAP measure. The reported combined ratio improved 0.5 percentage point year over year to 86.8%; the underlying ratio, however, deteriorated 0.2 point to 84.1%. Pretax net investment income increased 6% to $1.098 billion, helping offset $538 million of catastrophe losses, up from $402 million a year earlier. Revenue was slightly below the prior year’s $12.470 billion, so this was an underwriting-and-investment-income story, not accelerating top-line growth.
That distinction matters for sector selection: an insurer can monetize higher reinvestment yields and disciplined underwriting while highly leveraged infrastructure firms face more expensive funding. Travelers also repurchased $1.508 billion of stock during the quarter, supporting per-share results; catastrophe exposure and reserve movements remain key risks. Its relative strength, alongside gains at other insurers, demonstrated that investors were still rewarding earnings quality. Verified TRV closing price. The company lists a third-quarter earnings webcast; this analysis does not attribute unverified remarks to a written Q3 call transcript.
3. Macro Indicators and Market Outlook
The Cboe VIX finished at 19.99, up 3.53 points or 21.45% from 16.46. Rising implied volatility aligned with falling equities and showed a more expensive market for S&P 500 options protection. It is consistent with greater demand for hedging and event-risk premia, but the VIX alone cannot identify actual hedge flows. The rise brought volatility close to 20 without establishing a lasting stress regime.
The U.S. Treasury’s official daily par yield curve put the two-year constant-maturity yield at 4.74%, down 3 basis points from 4.77%, and the ten-year at 5.09%, down 1 basis point from 5.10%. The 2s10s spread therefore widened modestly to positive 35 basis points. These are Treasury’s indicative fixed-maturity rates derived near 3:30 p.m. ET, not executable end-of-day benchmark-bond quotations. The modest bull steepening suggests some duration demand during equity weakness, but neither yield movement establishes a specific future Fed action. Inflation risk remains substantial: the BLS September CPI report showed a 0.6% monthly rise and 3.7% annual inflation, while its September PPI report recorded a 1.3% monthly increase and a 6.3% annual gain in final-demand prices.
Brent crude settled 3.72% higher at $109.86 a barrel amid Middle East supply concerns, according to Reuters’ updated market close. The oil move helps explain energy’s relative strength but complicates the inflation-versus-growth trade-off: higher energy revenues can support producers while squeezing consumer purchasing power and limiting monetary-policy flexibility.
Upcoming Economic Data & Catalysts:
- U.S. Census Bureau — September 2026 New Residential Construction (Release date: October 20, 2026, 8:30 a.m. ET): Housing starts and permits will test rate-sensitive demand, building activity, and the transmission of elevated financing costs.
- Federal Reserve — FOMC Policy Decision (Release date: October 28, 2026, 2:00 p.m. ET; press conference at 2:30 p.m. ET): Investors will assess the committee’s inflation-growth balance and policy guidance against still-elevated yields and energy costs.
Market Insights:
Friday was primarily a growth-and-concentration selloff, not a uniform retreat from equities: six sector proxies advanced and equal weight outperformed capitalization weight. A sustained rebound would be more convincing with improving technology breadth, stabilizing AI credit pricing, and a retreat in implied volatility. Risks to that view include another surge in Treasury yields or oil prices, weakening corporate guidance, further credit-market stress, or a broader decline in advancing shares.
Trading & Investment Strategy:
Maintain position sizes that account for gap risk and the VIX’s rapid repricing; avoid extrapolating a single session into a permanent style shift. Favor balance-sheet resilience and visible free cash flow over headline revenue growth alone, and scale into positions rather than chasing sharp rebounds. Establish exit levels and a maximum portfolio drawdown budget before entry, while recognizing that stop orders cannot guarantee execution at the chosen price. Reassess sector and duration exposure after the housing data and FOMC decision.
4. Key FAQs About the US Stock Market Today
Why did the US stock market move on October 16, 2026?
Investors reassessed debt-funded AI infrastructure economics after sharp weakness in CoreWeave credit, while elevated September inflation and rising oil prices complicated the interest-rate outlook. Technology’s index weight amplified the Nasdaq and S&P 500 declines; select insurers and defensive businesses remained resilient.
Which sectors performed best and worst in the US stock market on October 16, 2026?
Using verified sector ETF closes as proxies rather than official GICS index returns, Energy (XLE, +2.52%) led, followed by Utilities (XLU, +1.34%). Technology (XLK, −3.02%) lagged, followed by Communication Services (XLC, −1.89%). The split reflected oil-related revenue support and a preference for earnings visibility over AI-financing sensitivity.
What should investors watch after the US stock market close on October 16, 2026?
Monitor the October 20 housing release, the October 28 Fed decision, the two- and ten-year Treasury curve, AI-related credit yields, whether the VIX can stabilize near 20, and whether equal-weight outperformance broadens into a sustainable advance. These indicators identify risks, not guaranteed market outcomes.
Disclaimer: This article is intended solely for the exchange of investment ideas and does not constitute investment advice of any kind.