


Key Takeaways
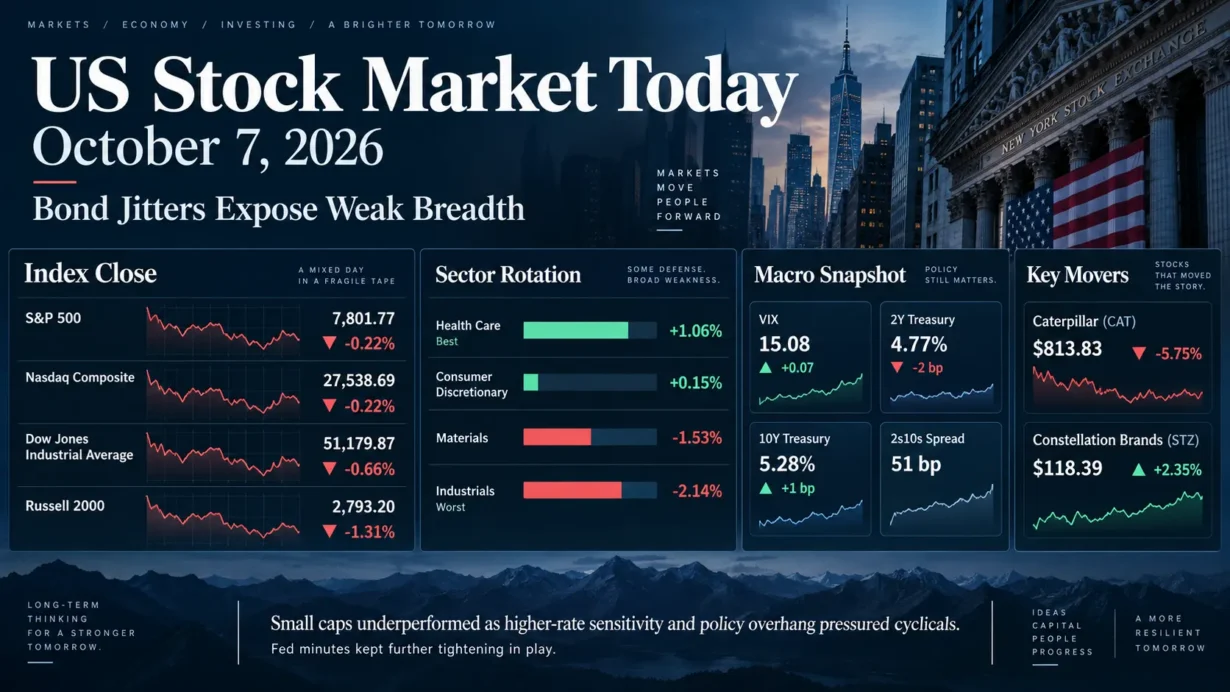
- The S&P 500 closed at 7,801.77, down 0.22%; the Nasdaq Composite finished at 27,538.69, down 0.22%; and the Dow fell 0.66% to 51,179.87.
- Small caps absorbed more damage: the Russell 2000 lost 1.31% to 2,793.20, signaling substantially weaker participation beneath the large-cap benchmarks.
- Health care led S&P 500 sectors with a 1.06% gain, while industrials fell 2.14%, the worst performance. Machinery stocks faced a new regulatory overhang.
- September Fed minutes kept further tightening in play. Treasury’s official daily 10-year par yield was 5.28%, up just 1 basis point after a much larger intraday market move.
1. Market Capital Flows and Sector Rotation
Seven of the 11 S&P 500 sectors declined. Health care led with a 1.06% gain, while industrials fell 2.14% and materials lost 1.53%. Yet consumer discretionary gained 0.15%, showing that cyclical exposure was not uniformly weak. The strongest divide was between defensive health care and economically sensitive machinery and materials.
Large caps held up better than small caps, while the growth-versus-value gap was narrow. On the same issuer-reported NAV basis, the iShares Russell 1000 Growth ETF declined 0.28% and its Value counterpart declined 0.34%. These are fund NAV changes, distinct from index or exchange closing-price returns. The evidence supports selective risk reduction rather than a sweeping shift between investment styles.
Reuters reported 3.34 declining stocks for every advancer on the NYSE and 2.37 on Nasdaq. U.S. exchange volume totaled 16.21 billion shares, below the preceding 20-session average of 17.57 billion. Selling was broad, but aggregate turnover did not indicate an unusually heavy liquidation day.
Institutional Flow Insight: A plausible allocation response is to favor cash-generative businesses with limited refinancing needs while trimming exposures vulnerable to financing costs or policy uncertainty. Earnings visibility can support relative valuations even when discount rates remain demanding. The small growth/value differential suggests balance-sheet resilience and business exposure deserve more attention than style labels. These are interpretations of price action; the evidence does not establish institutional net flows, changes in risk budgets, or quarter-opening rebalancing.
2. Decoding the Biggest Market Movers
Caterpillar (CAT)
Caterpillar closed at $813.83, down 5.75%, weighing on industrials and the price-weighted Dow. The FTC and USDA announced a public inquiry into agricultural-equipment manufacturing and distribution practices, creating a policy overhang for machinery shares. The announcement did not identify Caterpillar as a target or establish wrongdoing.
The business context matters. Caterpillar’s latest results, released August 4, showed quarterly sales and revenues of $20.5 billion, up 24%. Its official earnings-call transcript reported a $72 billion backlog and strong data-center demand for power-generation equipment. These were previously disclosed results, not an October 7 earnings update.
With long-term yields also volatile, the selloff was consistent with reduced tolerance for capital-spending and valuation risk. For industrial peers, the investment question is whether financing costs or actual regulatory exposure threaten future returns on capital. The share-price decline alone does not demonstrate a new deterioration in Caterpillar’s orders.
Constellation Brands (STZ)
Constellation Brands gained 2.35% to $118.39 following its October 6 after-close earnings release. Fiscal second-quarter net sales were $2.633 billion, up 6%; GAAP diluted EPS was $3.32, and comparable non-GAAP EPS was $3.74. Management reaffirmed fiscal 2027 comparable EPS guidance of $11.20–$11.90; that range is company guidance, not a realized result.
The more revealing comparison was beer shipments, up 5.5%, against depletions, down 0.6%. Depletions track distributor sales to retailers and provide a different demand signal from producer shipments. Beer operating margin fell 160 basis points to 39.0%, as higher marketing and other administrative spending outweighed favorable cost effects.
The rally suggests investors rewarded earnings delivery, but the shipment/depletion gap and margin pressure limit the case for extrapolating a broad consumer recovery. Beverage-stock valuations should distinguish market-share gains, underlying demand, and the spending needed to sustain brands.
Source note: A complete company-issued Constellation earnings-call transcript could not be retrieved. Its financial figures above were verified against the official earnings release and accompanying tables.
3. Macro Indicators and Market Outlook
The Cboe VIX closed at 15.08, up 0.07 point, or 0.47%, from 15.01. This is the official daily index close at approximately 4:15 p.m. ET, distinct from equities’ 4:00 p.m. close. The direction matched falling stocks, but the modest increase suggested limited additional broad-index volatility pricing. It does not independently establish institutional put buying or measure the full extent of stock-specific risk.
Treasury’s official daily par yields were 4.77% for the 2-year, down 2 basis points from October 6, and 5.28% for the 10-year, up 1 basis point. The 2s10s spread therefore widened from 48 to 51 basis points. These benchmarks use indicative quotations collected around 3:30 p.m. ET. Their modest changes should be distinguished from the earlier cash-market selloff, which eased after a strong 10-year auction.
The mixed curve movement does not imply a uniform repricing toward higher Fed rates. Inflation uncertainty, growth expectations, and compensation for holding longer maturities can move differently; nominal yields alone cannot isolate the term premium. Meanwhile, September meeting minutes released October 7 showed that most participants considered another rate increase likely appropriate by year-end after September’s 25-basis-point hike to 3.75%–4.00%. Future decisions remained conditional on incoming information.
Upcoming Economic Data & Catalysts:
- Unemployment Insurance Weekly Claims Report (Release date: October 8, 2026, at 8:30 a.m. ET): Initial and continuing claims will help assess labor-market resilience and the risk that tighter financing conditions are affecting employment.
- Consumer Price Index for September 2026 (Release date: October 14, 2026, at 8:30 a.m. ET): Monthly headline and core inflation will test whether price pressures remain persistent enough to reinforce the Fed’s tightening bias and pressure equity valuations.
Market Insights:
The session reflected broad underlying weakness cushioned by more resilient large-cap benchmarks and selective defensive strength. It offered little evidence of expanding risk appetite. A more durable recovery would require improving breadth and smaller-company participation alongside stable yields. Renewed increases in long-term yields, wider selling, weaker earnings expectations, or additional policy surprises could undermine that recovery. A quiet VIX should not substitute for monitoring those risks.
Trading & Investment Strategy:
Keep aggregate equity exposure and single-stock concentration within predetermined risk limits. Stage new positions, favor businesses with durable cash flow and manageable refinancing needs, and require improving participation before increasing cyclical exposure. Set position-specific exit levels and follow stop-loss discipline, recognizing that price gaps can prevent execution at the intended level. Avoid chasing a one-day defensive rally or treating a sharp industrial decline as an automatic bargain.
4. Key FAQs About the US Stock Market Today
Why did the US stock market move on October 7, 2026?
Intraday Treasury-market stress pressured equities, while Fed minutes preserved the possibility of further tightening. Machinery stocks faced a new sector inquiry, and Constellation’s earnings supported a company-specific gain. Together, these factors produced substantial dispersion beneath modest headline index losses.
Which sectors performed best and worst in the US stock market on October 7, 2026?
Health care led with a 1.06% gain; industrials were weakest, down 2.14%. That contrast was consistent with a preference for defensive earnings over financing-sensitive and policy-exposed cyclicals, although price changes alone do not confirm fund flows.
What should investors watch after the US stock market close on October 7, 2026?
Watch October 8 jobless claims, October 14 CPI, the direction of Treasury yields, and whether market breadth and small caps stabilize. Improving participation would strengthen a recovery; persistent divergence would leave the major benchmarks vulnerable.
Selected Primary Sources
- FTC and USDA agricultural-equipment inquiry — October 7, 2026
- Caterpillar second-quarter 2026 earnings release — August 4, 2026
- Constellation Brands fiscal Q2 2027 results and financial tables — October 6, 2026
- U.S. Treasury daily par yield curve — October 2026
- FOMC minutes, September 15–16, 2026 — released October 7
Disclaimer: This article is intended solely for the exchange of investment ideas and does not constitute investment advice of any kind.