Key Takeaways
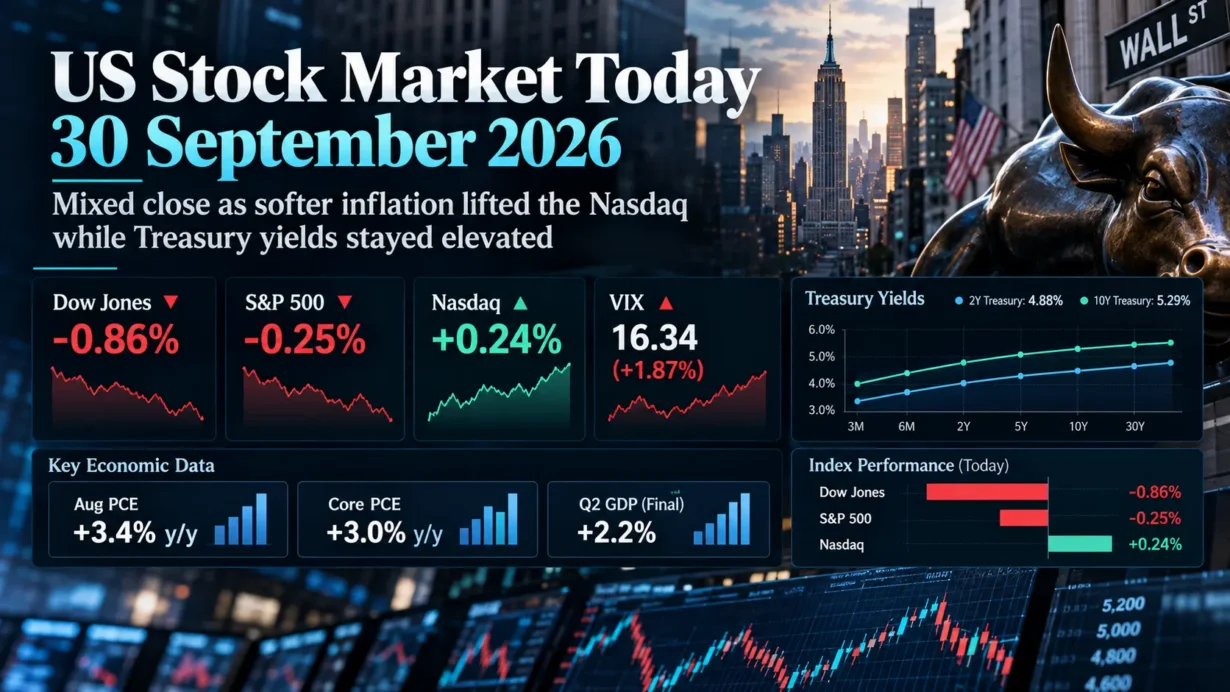
- The Dow Jones Industrial Average fell 0.86% to 50,906.05 and the S&P 500 slipped 0.25% to 7,651.54, while the Nasdaq Composite gained 0.24% to 26,861.06. The Russell 2000 fell 0.39% to 2,796.86, reinforcing the session’s large-cap growth bias.
- August PCE inflation rose 0.3% month over month and 3.4% year over year; core PCE increased 0.2% month over month and 3.0% year over year. Real consumer spending rose 0.6%, while second-quarter real GDP was revised up to a 2.2% annualized rate.
- Information Technology led the S&P 500 with a 0.61% gain, while Consumer Staples was the weakest sector at -1.68%. Nine of the 11 S&P 500 sectors finished lower.
- Market breadth was materially weaker than the Nasdaq headline suggested: decliners outnumbered advancers 1.66-to-1 on the NYSE and 1.51-to-1 on the Nasdaq, while U.S. exchange volume reached 18.13 billion shares versus a 20-day average of 17.06 billion.
- The official U.S. Treasury daily par curve showed the 2-year yield at 4.88%, down 1 basis point, and the 10-year at 5.29%, up 3 basis points. The Cboe VIX closed at 16.34, up 1.87%, consistent with a modest late-session increase in hedging demand rather than a disorderly risk-off move.
1. Market Capital Flows and Sector Rotation
The most important message from Wednesday’s tape was the gap between index-level resilience and underlying participation. Information Technology rose 0.61%, the best S&P 500 sector performance, while Consumer Staples fell 1.68%, the worst. Nine of 11 sectors closed lower. Mega-cap growth remained the relative winner: the Nasdaq Composite gained 0.24% as Microsoft, Apple and Nvidia helped keep technology in positive territory, while the value-leaning Dow fell 0.86% and the small-cap Russell 2000 lost 0.39%. That pattern points to selective capital concentration in companies with stronger earnings visibility and secular AI exposure rather than a broad expansion in risk appetite.
Neither cyclicals nor defensives provided a broad refuge. Rate-sensitive and economically exposed groups such as industrials, financials and real estate were under pressure, while defensive health care and consumer staples also weakened. The latter is particularly notable because higher Treasury yields can reduce the relative income appeal of dividend-oriented defensive equities, while company-specific execution concerns added pressure in packaged foods. The breadth data confirm that the session was narrower than the Nasdaq’s positive close implied: NYSE decliners led advancers by 1.66-to-1, Nasdaq decliners by 1.51-to-1, and the Nasdaq registered 212 new 52-week lows against 54 new highs. Trading activity was also above the recent norm, with 18.13 billion shares changing hands across U.S. exchanges versus a 17.06 billion 20-day average.
Institutional Flow Insight: The allocation pattern is consistent with institutions preserving exposure to high-visibility secular growth while trimming broader beta as long-duration Treasury yields remained elevated. Cooler PCE inflation improved the near-term policy backdrop for growth stocks, but stronger real activity, a higher GDP revision and rising long-end yields kept the discount-rate problem alive for the broader market. Quarter-end rebalancing may have amplified closing-hour flows, but the available data do not establish it as the primary driver. With breadth weak and volatility edging higher, a plausible institutional response is to reduce risk in lower-conviction cyclicals, small caps and bond-proxy defensives while retaining exposure to companies where earnings momentum can offset valuation pressure.
2. Decoding the Biggest Market Movers
Hewlett Packard Enterprise (HPE)
Hewlett Packard Enterprise closed 3.9% higher after two company announcements materially strengthened the market’s view of its AI networking opportunity. HPE disclosed a $1.2 billion order from Vultr for AMD Helios AI Rack by HPE systems, its first order for the platform, with deployments planned at U.S. cloud data centers. At its Networking Investor Day, HPE also raised its fiscal 2027 Networking segment revenue growth outlook to a range from the high teens to the low 20s percent, while maintaining an expected segment operating margin in the mid-to-high 20s. It lifted its Juniper-related annual run-rate cost-synergy target to $800 million by the end of fiscal 2028 from at least $600 million previously.
The same-day announcements build on a strong reported base rather than an unproven forecast alone. In its latest fiscal third quarter, released September 2, HPE reported record revenue of $12.2 billion, up 34% year over year, with Networking revenue of $2.9 billion, up 74.9%, and a 22.0% Networking operating margin. Companywide non-GAAP operating margin was 16.2% and non-GAAP diluted EPS was $1.11. The official earnings-call transcript also showed networking orders growing materially faster than revenue and described supply constraints as a limit on conversion. For the sector, the September 30 news matters because it provides another tangible sign that AI infrastructure spending is broadening beyond accelerators into switching, routing, rack-scale systems and liquid-cooled data-center architecture. That can support valuation attention across AI networking peers, although supply execution and the market’s already elevated growth expectations remain key risks.
Conagra Brands (CAG)
Conagra Brands closed at $13.44, down 4.88%, after its fiscal first-quarter results highlighted a difficult combination of weak volumes and persistent cost pressure despite higher earnings per share. Reported net sales fell 1.4% to approximately $2.6 billion and organic net sales declined 1.1%, with a 2.1% volume decline partly offset by a 1.0% contribution from price and mix. Reported operating margin was 10.3% and adjusted operating margin was 11.5%. GAAP diluted EPS was $0.36, up 5.9% year over year, while adjusted EPS rose 5.1% to $0.41.
Management reaffirmed fiscal 2027 guidance for organic net sales to decline 3% to 1%, adjusted operating margin of 10.0% to 10.5%, and adjusted EPS of $1.40 to $1.50. The official earnings-call transcript added an important quality-of-earnings warning: management expects full-year inflation of 5% to 6%, now trending toward the high end of that range, and expects second-quarter adjusted operating margin to be in the high single digits. The stock’s reaction suggests investors focused less on the EPS increase and more on volume elasticity, freight and fuel inflation, and the durability of pricing. That read-through is relevant for consumer staples broadly: defensive demand characteristics do not eliminate margin risk when household price sensitivity rises and input costs remain elevated, which helps explain why staples were the day’s weakest S&P 500 sector.
3. Macro Indicators and Market Outlook
The Cboe VIX closed at 16.34, up 0.30 point or 1.87% from 16.04. The rise in volatility was directionally consistent with the S&P 500’s late-session reversal and weak market breadth, but its magnitude did not signal disorderly stress. The more useful interpretation is that option hedging demand increased modestly as investors confronted a split macro message: softer inflation reduced immediate policy anxiety, while resilient growth and elevated long-term yields kept valuation risk in focus.
On the U.S. Treasury’s official daily par yield curve, the 2-year yield was 4.88% on September 30, down 1 basis point from 4.89% on September 29, while the 10-year yield rose 3 basis points to 5.29% from 5.26%. The 2s10s spread therefore widened to about 41 basis points from 37 basis points. That steepening is consistent with a market that modestly reduced pressure on the front end after softer PCE inflation while continuing to demand a higher yield at longer maturities because growth remained firm and inflation and term-premium risks had not disappeared. It should not be read as a definitive signal of any specific Federal Reserve decision.
The macro data themselves explain the tension. August headline PCE inflation increased 0.3% month over month and 3.4% year over year, while core PCE rose 0.2% month over month and 3.0% year over year. At the same time, real PCE increased 0.6% in August, second-quarter real GDP was revised up to a 2.2% annualized rate, and ADP reported a 90,000 increase in September private-sector employment. WTI crude also settled at $90.42 a barrel, up $1.04 or 1.2%, keeping energy-linked inflation risk relevant to the long end of the curve.
Upcoming Economic Data & Catalysts:
- U.S. Employment Situation for September 2026 (Release date: October 2, 2026): The Bureau of Labor Statistics is scheduled to publish nonfarm payrolls, unemployment and wage data at 8:30 a.m. ET. The report will be important for front-end Treasury yields and the market’s assessment of whether labor demand is cooling enough to reduce inflation pressure without undermining earnings growth.
- U.S. Consumer Price Index for September 2026 (Release date: October 14, 2026): The Bureau of Labor Statistics is scheduled to release headline and core CPI at 8:30 a.m. ET. The inflation composition will matter for real yields, policy expectations and valuation multiples, particularly if shelter or services inflation conflicts with the softer August PCE signal.
Only officially scheduled events after the September 30 close are included above.
Market Insights:
The session was driven more by concentrated leadership than by broad risk appetite. The Nasdaq finished positive, but the S&P 500 fell, the Russell 2000 underperformed, nine of 11 S&P sectors declined and breadth was negative on both major exchanges. The most important reversal risks are a renewed acceleration in the 10-year yield, further deterioration in new-high/new-low breadth, downward earnings revisions, an inflation or policy surprise, or a sustained expansion in equity volatility. Conversely, broader participation would require evidence that earnings strength is spreading beyond a narrow group of mega-cap and AI-linked companies while long yields stabilize.
Trading & Investment Strategy:
A risk-managed approach favors staged deployment rather than chasing strong single-day moves. Position sizes should reflect the unusually high long-end yield environment and the fact that index performance is masking weak breadth. Investors seeking growth exposure can prioritize businesses with visible cash flow, pricing power and funded demand rather than relying on multiple expansion alone; cyclical and small-cap exposure is better added incrementally if breadth and financing conditions improve. For existing positions, predefined loss limits or thesis-based exit levels can reduce the risk of allowing a macro-driven drawdown to become a portfolio-level problem. Gap-up names such as HPE warrant discipline after sharp repricing, while defensive sectors should not be treated as automatically low risk when bond yields and input-cost pressure are rising.
4. Key FAQs About the US Stock Market Today
Why did the US stock market move on September 30, 2026?
U.S. stocks finished mixed because softer-than-expected PCE inflation initially supported risk assets, but stronger underlying growth and rising long-term Treasury yields limited the rally. Mega-cap technology stocks held up better than the broader market, while weak breadth, small-cap underperformance and pressure across nine of 11 S&P 500 sectors pulled the S&P 500 and Dow lower into the close. Company-specific news, including HPE’s stronger networking outlook and Conagra’s volume and inflation concerns, reinforced the split between secular growth winners and more challenged areas of the market.
Which sectors performed best and worst in the US stock market on September 30, 2026?
Information Technology was the best-performing S&P 500 sector, rising 0.61%, while Consumer Staples was the worst, falling 1.68%. Technology benefited from relative strength in mega-cap growth and AI-linked infrastructure names, whereas staples faced both higher-yield competition for defensive income exposure and company-specific concerns over consumer price sensitivity and cost inflation.
What should investors watch after the US stock market close on September 30, 2026?
The next major macro catalyst is the September U.S. Employment Situation on October 2. Investors should also watch whether the 10-year Treasury yield can stabilize around or below its September 30 official par-yield level of 5.29%, whether market breadth improves from the session’s negative advance-decline ratios, and whether the heavy count of Nasdaq 52-week lows begins to recede. The October 14 CPI release is the next major inflation test. None of these signals guarantees a market direction, but together they will help determine whether the current narrow leadership can broaden or whether elevated discount rates continue to pressure the rest of the market.
Disclaimer: This article is intended solely for the exchange of investment ideas and does not constitute investment advice of any kind.