
Key Takeaways
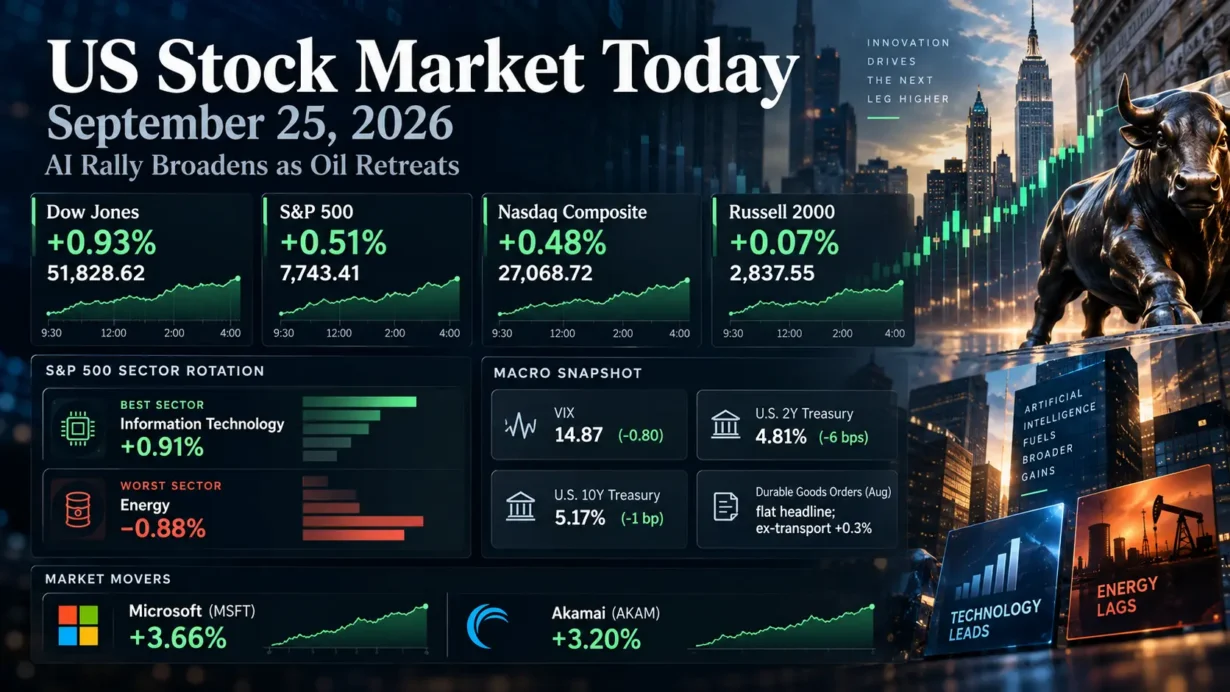
- The Dow rose 0.93% to 51,828.62, the S&P 500 gained 0.51% to 7,743.41, and the Nasdaq Composite advanced 0.48% to 27,068.72. Microsoft helped lead the AI rebound, but the Dow’s outperformance showed that gains extended beyond mega-cap technology.
- Information technology led the S&P 500’s 11 sectors, up 0.91% in Reuters’ closing figures; energy was the weakest, down 0.88% in TipRanks’ sector snapshot as crude retreated. Seven sectors finished higher.
- August durable-goods orders were virtually unchanged at $338.6 billion, while orders excluding transportation increased 0.3%—a firmer underlying reading than the headline suggested.
- The VIX finished at 14.87, down 0.80 point, while the Treasury’s 3:30 p.m. par curve showed a 4.81% two-year yield and a 5.17% 10-year yield. Lower closing volatility did not eliminate elevated duration risk.
1. Market Capital Flows and Sector Rotation
Technology’s 0.91% gain and industrials’ 0.60% advance drove a selective pro-growth session; energy’s 0.88% decline revealed the other side of falling oil prices. The Dow outpaced the S&P 500 and Nasdaq, but small caps lagged: the Russell 2000 added just 0.07% to 2,837.55. The combination favors a reading of large-cap leadership with some cyclical participation, not a confirmed, market-wide rotation from growth into value. Industrials and energy also diverged sharply, preventing any simple claim of uniform cyclical strength or wholesale defensive selling. Sector percentages are from Reuters and TipRanks; the Russell close is from MarketScreener.
Breadth was constructive but not emphatic: S&P 500 advancers outnumbered decliners 1.9 to 1, yet the index registered 31 new lows against only three new highs. U.S. exchange volume totaled 14.9 billion shares, below the preceding 20-session average of 16.8 billion. This is evidence of broader participation on the day, tempered by uneven momentum and relatively light turnover. Reuters market breadth and volume.
Institutional Flow Insight: A plausible allocation framework is to favor businesses able to monetize AI spending while retaining industrial exposure that benefits from physical infrastructure investment. Softer oil can relieve some inflation pressure but directly challenges energy earnings. With long-term Treasury yields still elevated, cash-flow durability, financing costs and valuation discipline matter more than an indiscriminate growth-versus-value trade. Quarter-end rebalancing could amplify individual moves, but the session’s data do not establish that institutions actually made those reallocations.
2. Decoding the Biggest Market Movers
Microsoft (MSFT)
Microsoft closed at $516.17, up 3.66%, after unveiling a revamped Copilot experience with Home, Code and Autopilot, extending its pitch from AI assistance toward application creation and persistent agents. Its latest reported fiscal fourth quarter—not a September earnings release—delivered $90.0 billion in revenue, up 18% year over year, and $4.81 in GAAP diluted EPS. Management’s earnings-call transcript put company gross margin at 67%, down year over year partly because of AI infrastructure investment. The investment question is whether broader Copilot adoption can translate into recurring revenue and offset compute intensity; Friday’s product launch alone proves no incremental earnings. Microsoft’s index weight helped technology outperform, although Meta’s 3.3% decline underscored selective positioning within large-cap AI. Verified close; Microsoft announcement, September 25; official earnings release.
Akamai Technologies (AKAM)
Akamai finished at $113.94, up 3.20%, following its September 24 after-hours announcement of a seven-year, $11.6 billion contractual commitment from Anthropic for CPU-oriented cloud infrastructure. The additional $9 billion is only a potential expansion, not contracted revenue. Akamai estimates approximately $5.5 billion of related capital expenditures, including a roughly $1.7 billion increase in planned 2026 spending; it said its 2026 revenue guidance was unchanged. Anthropic also received warrants that could represent up to approximately 5% of shares outstanding, introducing potential dilution. Akamai’s September 24 release; closing quote and prior earnings transcript.
The scale matters relative to Akamai’s last reported quarter: Q2 revenue was $1.100 billion, Cloud Infrastructure Services revenue $99 million, GAAP diluted EPS $0.52 and GAAP operating margin 7%. Its August-issued full-year revenue guidance was $4.445 billion–$4.530 billion, which management explicitly left unchanged after the Anthropic agreement. The deal offers long-duration contracted demand for an AI-infrastructure peer group, but capital intensity, counterparty concentration, utilization, financing costs and warrant dilution warrant attention before extrapolating the headline commitment into near-term profits. Akamai Q2 results and company guidance; Q2 earnings-call transcript.
3. Macro Indicators and Market Outlook
The Cboe VIX’s 4:15 p.m. close of 14.87 was 0.80 point lower than Thursday’s 15.67, a 5.11% decline consistent with the equity advance and reduced near-term demand for index-option protection. It is not evidence that geopolitical or earnings risk disappeared. VIX end-of-day series.
On a consistent official basis, the Treasury’s approximately 3:30 p.m. par-curve observations put the two-year yield at 4.81%, down six basis points from September 24, and the 10-year at 5.17%, down one basis point. The 2s10s spread therefore widened five basis points to 36 basis points. Reuters separately reported the actively traded benchmark 10-year note at 5.196%, up 3.4 basis points at its later market snapshot; that security and observation time should not be conflated with Treasury’s fixed-maturity par series. The short-end decline was consistent with a modest easing of immediate policy-rate pressure, while persistently high long yields kept inflation, fiscal supply and term-premium sensitivity relevant. One day’s curve move is not a reliable forecast of the next Fed decision. Official Treasury observations and methodology; Reuters later benchmark quote.
Brent crude eased but remained above $100 a barrel as reports of continuing U.S.–Iran discussions reduced some immediate supply anxiety. Lower oil helped sentiment and pressured energy shares, but an unresolved geopolitical backdrop leaves inflation and rates exposed to renewed supply disruption. Reuters.
Upcoming Economic Data & Catalysts:
- BEA Personal Income and Outlays, August 2026 (Release date: September 30, 2026, 8:30 a.m. ET): The PCE price indexes and consumer spending will help distinguish persistent inflation from demand resilience, with direct implications for discount rates. Official BEA schedule.
- BLS Employment Situation, September 2026 (Release date: October 2, 2026, 8:30 a.m. ET): Payrolls, unemployment and wage growth will test whether labor-market conditions justify a change in rate expectations. Official BLS schedule.
Market Insights:
Friday was neither a purely narrow mega-cap rally nor an unqualified risk-on breakout. Seven rising sectors and positive breadth indicate participation, but the Russell 2000’s near-flat finish, numerous index constituent new lows and below-average volume argue for confirmation. A renewed Treasury-yield spike, higher oil, weaker earnings expectations or a VIX reversal could challenge the advance.
Trading & Investment Strategy:
Frame exposure around portfolio risk budgets rather than chasing a single AI headline. Stagger entries, control position size in capital-intensive infrastructure names, compare contract economics with dilution and cash-flow requirements, and predefine invalidation levels or stop-loss rules appropriate to liquidity and volatility. Monitor breadth and rate sensitivity alongside price momentum; no single close establishes a durable trend.
4. Key FAQs About the US Stock Market Today
Why did the US stock market move on September 25, 2026?
Microsoft’s Copilot launch and Akamai’s Anthropic agreement reinforced AI-related earnings narratives. Retreating crude prices and reports of continued diplomatic discussions supported sentiment, while August durable-goods orders excluding transportation rose 0.3%. Elevated Treasury yields continued to constrain risk appetite. Reuters; Census Bureau.
Which sectors performed best and worst in the US stock market on September 25, 2026?
Information technology ranked first, up 0.91% in Reuters’ closing figures, helped by Microsoft and AI-linked hardware. Energy ranked last, down 0.88% in TipRanks’ sector snapshot as oil prices fell. Different closing-data vendors reported slightly different technology returns. Reuters; TipRanks.
What should investors watch after the US stock market close on September 25, 2026?
Watch the September 30 PCE release and October 2 employment report, alongside two- and 10-year yields, market breadth and any renewed increase in energy prices. For AI infrastructure, distinguish recognized revenue and free cash flow from multiyear contractual commitments and management estimates.
Disclaimer: This article is intended solely for the exchange of investment ideas and does not constitute investment advice of any kind.