Key Takeaways
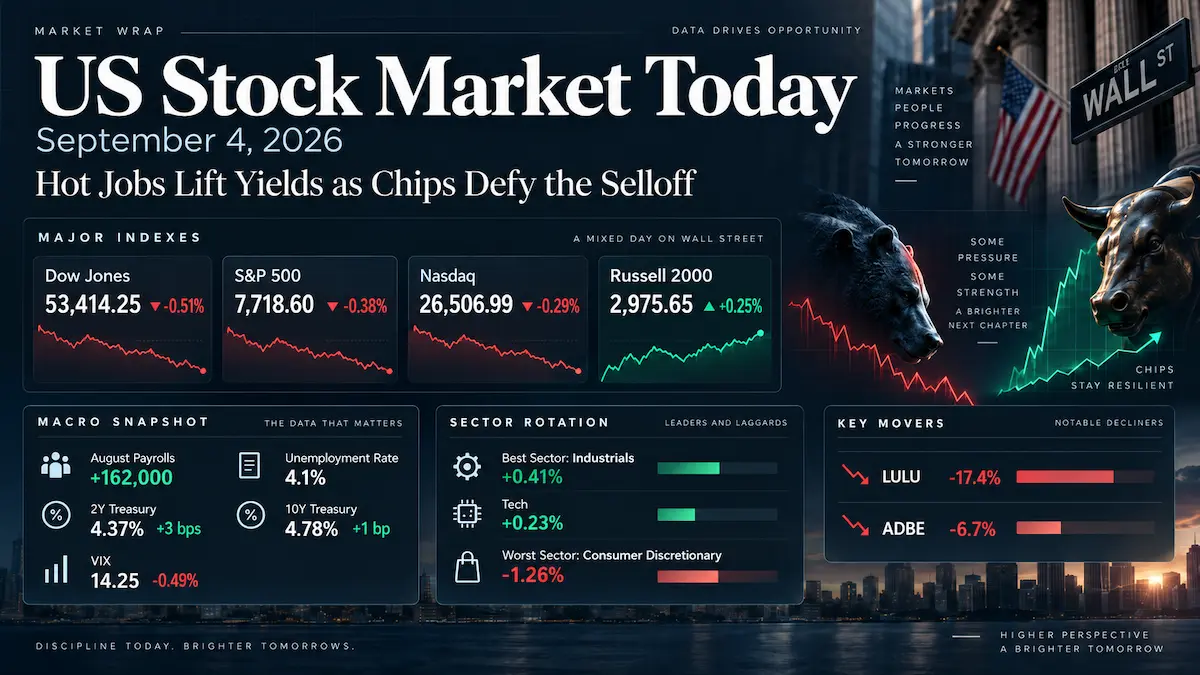
- The Dow Jones Industrial Average fell 0.51% to 53,414.25, the S&P 500 lost 0.38% to 7,718.60 and the Nasdaq Composite declined 0.29% to 26,506.99. The Russell 2000 moved the other way, gaining about 0.25% to 2,975.65.
- August nonfarm payrolls increased by 162,000 and the unemployment rate held at 4.1%. Average hourly earnings rose 0.3% month over month and 3.1% year over year, while June and July payrolls were revised higher by a combined 55,000.
- The stronger labor report pushed the Treasury curve higher at the front end: the 2-year yield finished near 4.37%, roughly 3 basis points above Thursday, while the 10-year ended near 4.78%, about 1 basis point higher.
- Sector leadership was unusually selective. Industrials led the S&P 500 sectors at +0.41% and Information Technology gained 0.23%, helped by a 3.4% semiconductor rally, while Consumer Discretionary was worst at -1.26%.
- Lululemon fell 17.4% after cutting its full-year outlook, while Adobe dropped 6.7% after naming Anil Chakravarthy as its next CEO. Both moves reinforced the market’s preference for visible execution over headline growth narratives.
1. Market Capital Flows and Sector Rotation
Friday’s index decline looked more defensive at the headline level than it did underneath the surface. Eight of the 11 S&P 500 sectors finished lower, but Industrials led with a 0.41% gain, Information Technology rose 0.23% and Utilities edged up 0.04%. Consumer Discretionary was the weakest sector at -1.26%, followed by Health Care at -1.04% and Energy at -0.98%. The mix does not fit a simple cyclical-versus-defensive template: cyclical Industrials outperformed while discretionary shares sold off, and defensive Utilities held up while Health Care and Consumer Staples weakened.
Market-cap leadership was also mixed. The S&P 500 lost 0.38%, but the Russell 2000 gained about 0.25%, indicating that small caps were not the source of the day’s risk reduction. Within growth, leadership was concentrated rather than broad. The Nasdaq-100 gained 0.21% even as the Nasdaq Composite fell 0.29%, and the semiconductor index advanced 3.4%. By contrast, software-related shares were notably weaker. That divergence matters because it suggests investors were still willing to fund areas tied to AI infrastructure and capital spending even as higher short-term rates pressured other long-duration and consumer-sensitive exposures.
Breadth was soft but not disorderly. Decliners outnumbered advancers by 1.04-to-1 on the NYSE, while Nasdaq advancers outnumbered decliners by about 1.1-to-1. U.S. exchange volume totaled 13.14 billion shares versus a 20-session average of 14.89 billion. In combination with a lower VIX, the below-average turnover argues against interpreting Friday as a forced deleveraging event.
Institutional Flow Insight: The pattern is consistent with, but does not prove, a selective institutional rotation away from areas where higher front-end rates directly compress valuation support or weaken consumer demand visibility. At the same time, investors appeared willing to retain exposure to semiconductors and industrial earnings streams with stronger structural demand. Early-month rebalancing and pre-holiday positioning may have amplified individual moves, but the modest volume and resilient small-cap tape do not point to a broad risk-budget shock.
2. Decoding the Biggest Market Movers
lululemon athletica (LULU)
Lululemon closed down 17.4% after its fiscal second-quarter results and updated outlook exposed a sharper deterioration in demand than the headline EPS figure initially suggested. Official company results showed revenue of $2.416 billion, down 4% year over year and 5% in constant currency. Americas revenue fell 8%, comparable sales declined 9% globally, and Americas comparable sales dropped 12%. Diluted EPS was $2.92 versus $3.10 a year earlier.
The quality of the reported margin improvement is important. Gross margin rose 200 basis points to 60.5%, but the quarter included $134.5 million of IEEPA tariff refunds that lifted gross margin by 560 basis points. Operating margin fell 190 basis points to 18.8%, even though the same refunds added 560 basis points to that measure. The refunds and related interest contributed $0.86 per diluted share. In other words, the accounting benefit masked weaker underlying operating economics rather than signaling a clean margin inflection.
Management also reduced forward visibility. Third-quarter revenue is now expected at $2.290 billion to $2.320 billion, down 10% to 11%, with diluted EPS of $0.93 to $0.98. For fiscal 2026, the company now expects revenue of $10.350 billion to $10.500 billion, down 5% to 7%, and EPS of $9.48 to $9.73; that full-year EPS range includes the $0.86 benefit already recognized from tariff refunds and associated interest. On the earnings call, management described pressure on traffic and conversion, inconsistent product response and an approximately 20% decline in leggings sales during the quarter. Those comments make the problem more than a macro slowdown: brand heat, assortment execution and full-price sell-through are now central to the earnings-recovery debate.
The sector implication is broader than one stock. Lululemon’s collapse helped reinforce Consumer Discretionary as the day’s weakest S&P 500 sector and raises the hurdle for premium consumer brands whose valuations depend on durable traffic, pricing power and clean inventory. For peers, the key read-through is not that all discretionary demand is deteriorating equally, but that markets are demanding more evidence that brand strength can translate into full-price revenue growth.
Adobe (ADBE)
Adobe closed down 6.7% after the company named Anil Chakravarthy as president and CEO effective December 1, 2026, with Shantanu Narayen moving to executive chair. This was not the first disclosure that Narayen would transition: Adobe had announced in March that he intended to step down once a successor was appointed. Friday’s stock reaction therefore looks more like a repricing of execution and succession risk around the specific leadership choice than a response to an unexpected retirement.
The move was also not tied to a fresh earnings miss. Adobe’s latest reported quarter, fiscal Q2 ended May 29, produced record revenue of $6.62 billion, up 13% year over year, with GAAP diluted EPS of $4.25 and non-GAAP diluted EPS of $5.96. GAAP operating income was $2.24 billion and non-GAAP operating income was $2.95 billion. Adobe’s official Q2 release set Q3 revenue targets of $6.67 billion to $6.72 billion, GAAP EPS of $4.40 to $4.45, non-GAAP EPS of $6.05 to $6.10, a 34% GAAP operating-margin target and a 44% non-GAAP operating-margin target. The company also raised fiscal-2026 revenue targets to $26.50 billion to $26.60 billion and non-GAAP EPS targets to $24.35 to $24.45.
That distinction is strategically important. The market was discounting leadership continuity and AI-era execution rather than reacting to newly released deterioration in the income statement. Adobe’s 6.7% decline, alongside weakness in software while semiconductors rallied, illustrates how aggressively investors are separating AI infrastructure beneficiaries from software businesses that still need to prove durable monetization and competitive positioning. Adobe’s Q3 earnings call on September 10 is therefore a near-term test of whether operating momentum can offset the governance discount created by the transition.
3. Macro Indicators and Market Outlook
The Cboe VIX closed at 14.25, down 0.49% from 14.32 on Thursday. That was an important confirmation signal: equities fell, but implied volatility did not rise with them. The divergence suggests Friday’s decline was primarily a rates-and-rotation event rather than a broad scramble for crash protection. It does not mean hedging demand was absent, but the VIX close offers little evidence of a generalized volatility shock.
The U.S. Treasury market delivered the clearest macro message. The 2-year yield ended near 4.37%, about 3 basis points above Thursday’s 4.34%, while the 10-year yield ended near 4.78%, roughly 1 basis point above 4.77%. That moved the 2s10s spread to about +41 basis points from roughly +43 basis points, a modest flattening. The front end’s larger move is consistent with investors repricing near-term Federal Reserve policy risk after the payroll report, while the smaller 10-year move suggests less dramatic change in long-run growth or term-premium assumptions. CME FedWatch pricing cited in market reports put the implied probability of a 25-basis-point September rate increase at 58.4%, up from 49.4% a day earlier. That is market-implied pricing, not a certainty about the Federal Reserve’s next decision.
The labor report explains why that repricing mattered. August payroll growth of 162,000 was accompanied by a stable 4.1% unemployment rate, a 0.3% monthly increase in average hourly earnings and a 3.1% year-over-year wage gain. June payrolls were revised from +20,000 to +31,000 and July from -23,000 to +21,000, lifting the two-month total by 55,000. The combination reduced the urgency for near-term easing and shifted attention back toward inflation risk without, by itself, proving that tighter policy is inevitable.
Upcoming Economic Data & Catalysts:
- Producer Price Index for August 2026 (Release date: September 10, 2026): Investors will focus on pipeline price pressure and whether producer costs reinforce or challenge the post-payroll rise in front-end yields. A stronger inflation impulse could also affect corporate margin assumptions.
- Consumer Price Index for August 2026 (Release date: September 11, 2026): CPI is the next major test for rate expectations. The composition of core inflation will matter as much as the headline because a persistent services impulse could affect real yields, equity duration and the valuation premium assigned to growth stocks.
Market Insights:
Friday was not a classic broad risk-off session. Eight S&P 500 sectors declined, yet small caps advanced, the Nasdaq-100 finished higher, semiconductors rallied and the VIX fell. The more accurate description is selective de-risking after a front-end rate shock, with stock-specific execution risk magnifying losses in Consumer Discretionary and software. The setup would become materially less constructive if Treasury yields accelerate higher, breadth deteriorates while cap-weighted indexes remain supported by fewer names, earnings revisions turn negative, or the VIX breaks decisively out of its mid-teens range. Conversely, stable yields and broader participation would make Friday look more like a rotation than the start of a sustained drawdown.
Trading & Investment Strategy:
Risk management should take priority over chasing one-day relative strength. Investors can keep position sizes aligned with volatility, add exposure in stages rather than on gap moves, and favor sectors where earnings visibility and balance-sheet quality justify current valuations. Semiconductor and industrial strength deserves attention, but entry discipline still matters after sharp advances. In weaker consumer and software names, wait for evidence that estimates and operating trends have stabilized before assuming valuation alone provides a floor. Define invalidation or stop levels before entering positions, avoid oversized leverage, and preserve liquidity around the September 10-11 inflation data window.
4. Key FAQs About the US Stock Market Today
Why did the US stock market move on 4 September 2026?
U.S. stocks fell mainly because the August employment report was stronger than expected, pushing Treasury yields higher and increasing market-implied odds of a September Fed rate increase. The effect was amplified by company-specific weakness in Lululemon and Adobe, while semiconductor strength prevented the decline from becoming a uniform technology selloff.
Which sectors performed best and worst in the US stock market on 4 September 2026?
Industrials was the best-performing S&P 500 sector at +0.41%, followed by Information Technology at +0.23%. Consumer Discretionary was the worst at -1.26%, with Lululemon’s 17.4% decline adding to pressure in the group. The rotation was selective rather than a simple move from cyclicals into defensives.
What should investors watch after the US stock market close on 4 September 2026?
The next major macro catalysts are the August PPI on September 10 and CPI on September 11. Investors should also watch whether the 2-year Treasury yield continues to rise faster than the 10-year, whether market breadth weakens beneath the headline indexes, and whether the VIX begins to confirm equity weakness. Adobe’s Q3 earnings call on September 10 is an additional corporate catalyst for software and AI-monetization sentiment.
Disclaimer: This article is intended solely for the exchange of investment ideas and does not constitute investment advice of any kind.