
Key Takeaways
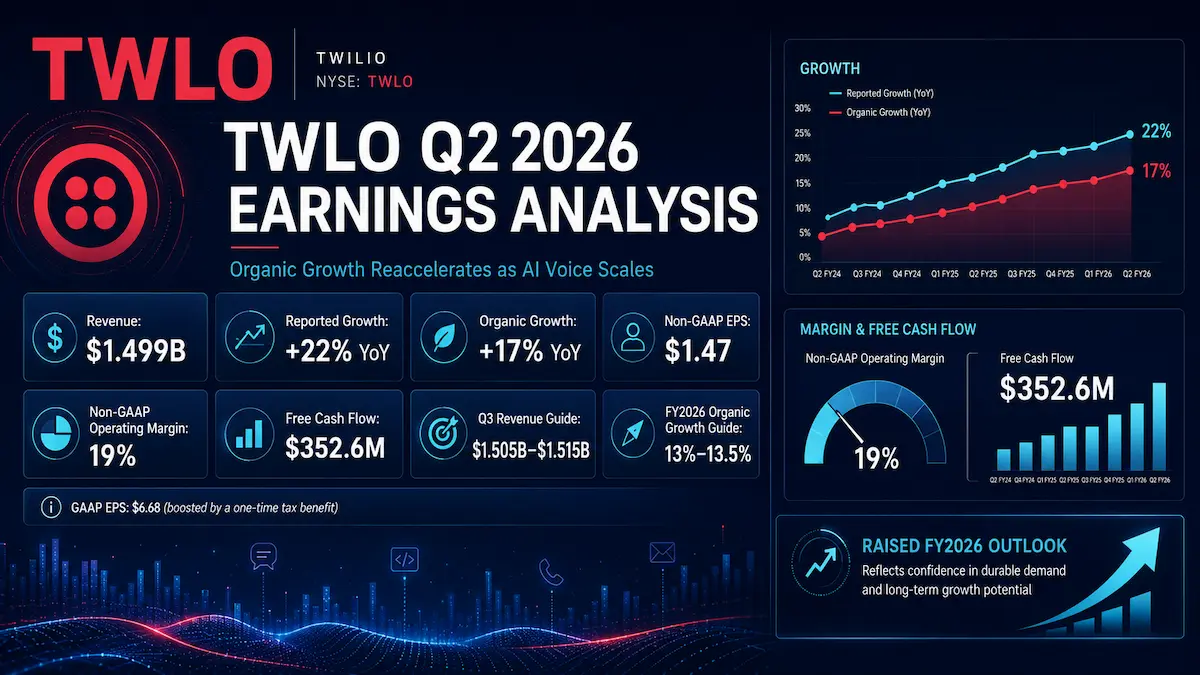
- Twilio delivered Q2 2026 revenue of $1.499 billion, up 22% reported and 17% organically. The gap matters: reported growth includes incremental U.S. carrier pass-through fees that raise revenue without adding gross profit.
- Profitability was stronger than the headline revenue beat alone suggests. Non-GAAP operating income reached $284.6 million, non-GAAP operating margin was 19%, and free cash flow reached a record $352.6 million. By contrast, GAAP diluted EPS of $6.68 was heavily boosted by a one-time $5.91-per-share non-cash tax benefit.
- Underlying product momentum broadened. Messaging grew 28% reported but approximately 18% excluding the incremental carrier-fee contribution; Voice grew more than 20%; software add-ons grew more than 25%; and Verify grew more than 30%.
- Management raised FY2026 organic revenue growth guidance to 13%-13.5% from 9.5%-10.5%, while lifting both non-GAAP operating income and free-cash-flow guidance to $1.135-$1.155 billion.
- The roughly 17% post-earnings share-price jump was directionally consistent with the fundamental surprise. At a post-earnings reference price around $226, the stock is no longer priced like a turnaround: investors are paying for sustained double-digit organic growth, improving product mix and durable AI-related demand.
1. Core Earnings Breakdown
Revenue and Profitability Analysis
Twilio’s Q2 2026 earnings were materially better than the company’s prior guidance and Wall Street’s published revenue and EPS expectations. Revenue was $1.499 billion, up 22% year over year on a reported basis. Twilio’s company-defined organic revenue growth was 17%. The distinction is essential because Twilio excludes specified incremental U.S. application-to-person carrier fees from organic revenue for a defined period; those carrier fees are passed through to customers at cost and therefore increase reported revenue without increasing gross profit dollars.
Twilio does not report a separate metric called “operational revenue growth.” For analytical purposes, company-defined organic growth is the cleaner proxy for operating momentum because it removes the specified carrier-fee distortion and acquisition/divestiture effects under Twilio’s stated methodology. On that basis, the quarter represented a genuine acceleration rather than merely a pass-through-fee-driven revenue beat.
- Revenue: $1.499 billion, up 22% reported and 17% organic year over year.
- GAAP gross profit: $725.9 million, up 20%, with a 48% GAAP gross margin.
- Non-GAAP gross profit: $735.7 million, up 18%, with a 49% reported non-GAAP gross margin; management cited a more precise 49.1% on the call.
- GAAP operating income: $84.5 million, up 129%, with a 6% GAAP operating margin. The quarter included a $32.8 million prepaid-asset impairment.
- Non-GAAP operating income: $284.6 million, up 29%, with a 19% non-GAAP operating margin.
- Operating cash flow: $372.4 million. Free cash flow: $352.6 million, equivalent to a company-reported rounded FCF margin of 24%.
- GAAP diluted EPS: $6.68. Non-GAAP diluted EPS: $1.47.
The GAAP EPS figure requires special treatment. Twilio disclosed that $5.91 per diluted share came from a one-time non-cash benefit related to the release of a significant portion of the valuation allowance against U.S. deferred tax assets. A simple $6.68 minus $5.91 calculation yields approximately $0.77 per share before that benefit. This $0.77 figure is calculated from company-reported figures and is not a company-reported adjusted EPS measure. The practical conclusion is that the $6.68 headline GAAP EPS is not a sensible run-rate earnings base.
Earnings quality was nevertheless strong where it matters for valuation. Free cash flow of $352.6 million exceeded non-GAAP operating income of $284.6 million, while non-GAAP operating income grew 29% against 18% non-GAAP gross-profit growth. That indicates real operating leverage. The main caveat is that non-GAAP operating income remains materially above GAAP operating income because Twilio excludes items including stock-based compensation, acquired-intangible amortization, impairments and certain other charges. Stock-based compensation was still 9.5% of revenue in Q2, although management said that ratio fell 270 basis points year over year.
Twilio did not publish a Q2 2026 product-by-product revenue-dollar mix in the earnings release or call, so an exact current-quarter product share should not be invented. The latest company-reported full-year product mix is FY2025, which provides a useful scale anchor for interpreting Q2 growth rates:
- Messaging: FY2025 revenue was $2.878 billion, or approximately 56.8% of FY2025 revenue ($2.878 billion / $5.067 billion; calculated from company-reported figures). Q2 2026 Messaging revenue grew 28%, with roughly 10 percentage points of that growth coming from incremental carrier fees. Investment read-through: the approximately 18% ex-fee growth rate is the more important signal because it shows Twilio’s largest revenue engine was accelerating even before the mechanical pass-through benefit.
- Voice: FY2025 revenue was $615.7 million, or approximately 12.1% of FY2025 revenue ($615.7 million / $5.067 billion; calculated from company-reported figures). Q2 Voice growth exceeded 20%, and self-service Voice grew more than 50%. Investment read-through: Voice remains much smaller than Messaging, but its growth profile and adjacency to AI agents can improve consolidated growth and gross-profit mix if software attach continues to rise.
- Email: FY2025 revenue was $523.5 million, or approximately 10.3% of FY2025 revenue ($523.5 million / $5.067 billion; calculated from company-reported figures). Management did not disclose a standalone Q2 Email revenue growth rate, but the CFO said Email margins continued to improve as Twilio lapped its cloud-migration work. Investment read-through: Email is currently more relevant to margin durability and platform breadth than to the quarter’s headline reacceleration thesis.
- Segment: FY2025 revenue was $303.3 million, or approximately 6.0% of FY2025 revenue ($303.3 million / $5.067 billion; calculated from company-reported figures). Twilio did not disclose a standalone Q2 Segment growth rate. Investment read-through: investors should avoid assigning material near-term growth credit to Segment solely because management is emphasizing conversation memory, context and orchestration across the broader platform; the strategic relevance may be rising, but discrete Q2 Segment growth was not disclosed.
- Other products: FY2025 revenue was $746.5 million, or approximately 14.7% of FY2025 revenue. Twilio separately said Q2 software add-on revenue grew more than 25%, led by Verify at more than 30%, while Branded Calling and Conversational Intelligence grew at triple-digit rates. Investment read-through: this is the most important mix-shift vector because higher-margin software can make gross-profit growth more valuable than an equivalent dollar of pass-through-heavy communications revenue.
Expectations vs. Actual Results
- Revenue: $1.499 billion actual versus approximately $1.43 billion Wall Street consensus — ✅ Beat by about $69 million, or 4.8%.
- Non-GAAP diluted EPS: $1.47 actual versus $1.32 consensus — ✅ Beat by $0.15, or 11.4%.
- Non-GAAP operating margin: 19.0% actual versus approximately 17.9% implied by Twilio’s prior Q2 guidance midpoint of $255 million in non-GAAP operating income on $1.425 billion of revenue — ✅ Approximately 110 basis points above the company-guidance-implied benchmark. A consistently sourced public Street consensus for operating margin was not available, so the company’s own prior guidance is used rather than fabricating an estimate.
The beat was broad-based rather than the result of one accounting line. Twilio had previously guided Q2 revenue to $1.420-$1.430 billion, non-GAAP operating income to $250-$260 million and non-GAAP EPS to $1.27-$1.32. Actual revenue exceeded the high end by approximately $69 million, non-GAAP operating income exceeded the high end by $24.6 million, and non-GAAP EPS exceeded the high end by $0.15. Management attributed the upside to strong volumes, customer additions, self-service and ISV momentum, stronger Messaging and Voice usage, and faster software add-on adoption.
The quality of the revenue beat is best understood in two layers. First, reported growth was helped by carrier pass-through fees, so 22% reported growth should not be treated as fully economic growth. Second, organic revenue still grew 17%, far above the 10%-11% organic growth range Twilio issued three months earlier. The difference between those two observations is why the quarter was genuinely strong even after stripping out the accounting noise.
For Q3 2026, Twilio guided revenue to $1.505-$1.515 billion, implying 16%-16.5% reported growth and 11%-12% organic growth. The $1.510 billion midpoint was about 3.0% above the approximately $1.466 billion published consensus cited after the release. Management also guided Q3 non-GAAP operating income to $285-$295 million and non-GAAP diluted EPS to $1.42-$1.47 on 160 million diluted shares.
For FY2026, management raised reported revenue growth guidance to 18%-18.5% from 14%-15% and organic revenue growth guidance to 13%-13.5% from 9.5%-10.5%. Non-GAAP operating income guidance increased to $1.135-$1.155 billion from $1.08-$1.10 billion, and free-cash-flow guidance increased to the same $1.135-$1.155 billion range. Management expects full-year non-GAAP gross-profit growth to be similar to organic revenue growth.
The market’s hierarchy of evidence appears to have been: organic growth durability first, guidance second, gross-profit and operating-leverage quality third, and AI product/pipeline evidence fourth. The headline EPS beat helped, but the more important re-rating input was the combination of 17% organic growth, an FY2026 organic growth midpoint raised from 10.0% to 13.25%, and a Q3 revenue outlook above consensus. In other words, this was not simply an “EPS beat” quarter.
The share-price reaction was consistent with the fundamental surprise rather than at odds with it. TWLO closed the August 6 regular session at $193.20 and rose to about $225.40 after hours, a gain of roughly 16.7%. On August 7, shares traded around the mid-$220s and were reported near $227 in early trading. There is therefore no negative post-earnings reaction that needs to be rationalized as “sell the news.” The more relevant question is whether the post-earnings valuation now discounts too much of the improved growth trajectory.
Earnings Call Highlights
- Management said the Q2 strength was broad-based: Messaging grew 28%, Voice grew above 20%, software add-ons grew more than 25%, and self-service revenue grew more than 30%.
💡 Reading Between the Lines: This matters because Twilio’s reacceleration is no longer dependent on one channel or one customer cohort. A broader set of growth vectors reduces the probability that the quarter was a temporary usage spike, although harder second-half comparisons remain a real constraint. - Twilio said self-service Voice grew more than 50% year over year, while AI-native customers are often starting with Voice and then expanding into Messaging and software add-ons.
💡 Reading Between the Lines: Voice AI is potentially more valuable than a standalone usage tailwind because it creates a land-and-expand motion into higher-margin software. If that behavior persists, Twilio’s AI exposure can improve both revenue duration and gross-profit mix rather than merely adding low-margin minutes. - The redesigned Twilio Console has produced more than a 90% uplift in conversion versus the old experience, but management said it contributed very little to Q2 multi-product revenue.
💡 Reading Between the Lines: The Console is a leading indicator rather than a current-quarter revenue explanation. That is constructive for 2027 optionality because the Q2 beat was not dependent on this product change, but investors should not capitalize the conversion uplift into near-term revenue until production workloads and paid multi-product adoption become visible. - Management emphasized neutral infrastructure positioning across LLMs, clouds, data warehouses and systems of record, describing Twilio’s role as an ecosystem-neutral layer rather than a closed AI stack.
💡 Reading Between the Lines: The strategic goal is to monetize AI traffic regardless of which model or application layer wins. This “picks-and-shovels” posture lowers model-selection risk, but it only supports a premium valuation if Twilio can retain pricing power and avoid being commoditized at the communications layer. - Q2 DBNE was 116%; management said carrier fees contributed about five percentage points, while fee-adjusted DBNE still improved by roughly one point sequentially and multi-product customer revenue continued to accelerate.
💡 Reading Between the Lines: Existing-customer expansion is improving even after removing the fee distortion. That strengthens the durability case because Twilio is getting contribution from both new customers and higher same-customer spend, rather than relying solely on acquisition-driven growth.
2. Deep Business Insights
Hidden Metrics That Matter
Two operating metrics provide a cleaner read on the investment case than the headline 22% revenue growth figure.
- Underlying Messaging growth was approximately 18%: 28% reported Messaging growth minus roughly 10 percentage points from incremental carrier fees = approximately 18%. This is calculated from company-reported figures. Why it matters: Messaging represented approximately 56.8% of FY2025 revenue, so high-teens underlying growth in Twilio’s largest product family has far more earnings relevance than a small new product growing from a low base.
- Fee-adjusted DBNE was approximately 111%: 116% reported DBNE minus roughly five percentage points from incremental carrier fees = approximately 111%. This is calculated from company-reported figures. Management also said fee-adjusted DBNE improved by about one percentage point sequentially. Why it matters: a low-110s underlying expansion rate suggests existing customers are again increasing usage and product adoption at a healthier pace, while net-new customer wins provide incremental growth on top.
Customer choice is increasingly about more than API convenience. Twilio’s advantage combines global reach across more than 180 countries, carrier connectivity, developer distribution, a large installed base, cross-channel communications, identity and software add-ons, and an emerging context/orchestration layer. Management specifically cited direct connectivity for 10DLC and toll-free messaging with all major U.S. carriers as a source of efficiency. On the demand side, OpenEvidence chose Twilio for reliability, performance and global reach combined with orchestration, while enterprise and ISV customers are increasingly consolidating communications traffic rather than spreading it across multiple vendors.
The key differentiator is therefore not simply “Twilio has APIs.” The more defensible proposition is that an enterprise or AI-native developer can use one neutral layer to reach end users across Voice, Messaging, RCS, WhatsApp and other channels, then attach verification, conversation intelligence, memory, orchestration and contact-center functionality. If the company can make those components work as one platform, switching costs rise because the customer is moving not only traffic but also context, workflows, analytics and operating logic.
Industry Chain Reactions
- ✅ Benefit — Atlassian (NASDAQ: TEAM): Twilio disclosed that Atlassian is using Twilio communications infrastructure and Flex capabilities to deliver contextual, AI-powered omnichannel support in its customer-service offering, and management separately cited work embedding Voice AI capabilities into that platform. This is a direct strategic read-through: stronger Twilio Voice AI adoption can make Atlassian’s service-management stack more capable without requiring Atlassian to recreate global communications infrastructure internally. The financial materiality to TEAM is not yet disclosed.
- ❌ Face Pressure — Five9 (NASDAQ: FIVN): Twilio’s accelerating Voice, Branded Calling, Conversational Intelligence, Flex and Agent Connect adoption increases competitive pressure across AI-enabled contact-center and customer-engagement budgets. The risk for Five9 is not that Twilio’s quarter proves a specific customer loss; it does not. The pressure comes from Twilio’s ability to bundle communications infrastructure, AI-native developer adoption and software layers in one platform, which can complicate standalone CCaaS differentiation.
Valuation Framework and Key Risks
Using approximately $226 as a post-earnings reference share price on August 7, 2026, Twilio is no longer trading at a valuation that assumes mediocre growth. A valuation bridge illustrates what the market is now underwriting.
Twilio reported 152.785 million weighted-average basic shares in Q2. Using that as an analytical share-count proxy gives an equity-value proxy of approximately $34.5 billion: $226 × 152.785 million. This is calculated from company-reported figures plus the market-price reference and should not be confused with an official point-in-time market capitalization.
At June 30, Twilio held $823.3 million of cash and cash equivalents and $1.833 billion of short-term marketable securities, against $993.2 million of long-term debt. Net cash therefore was approximately $1.663 billion: $823.3 million + $1.833 billion – $993.2 million. This is calculated from company-reported figures. Subtracting that net cash from the equity-value proxy produces an enterprise-value proxy of roughly $32.9 billion.
Twilio generated $5.067 billion of FY2025 revenue. Applying management’s raised FY2026 reported growth guidance of 18%-18.5% implies approximately $5.979-$6.005 billion of FY2026 revenue: $5.067 billion × 1.18 to 1.185. This is calculated from company-reported figures. At the midpoint, the approximate enterprise-value-to-FY2026-revenue multiple is about 5.5x.
Using the $1.145 billion midpoint of FY2026 free-cash-flow guidance and the same equity-value proxy, the stock trades at roughly 30.2x FY2026 free cash flow, equivalent to an approximately 3.3% forward FCF yield. These figures are calculated from company-reported figures plus the $226 market-price reference.
That valuation is defensible if three things remain true: organic growth can stay in the low-to-mid teens after tougher comparisons; higher-margin Voice software and add-ons can keep gross-profit growth near organic revenue growth; and AI-native workloads remain incremental rather than merely replacing existing human-driven communications traffic. If those conditions hold, the market can value Twilio more like a durable growth infrastructure platform and less like a mature CPaaS vendor.
The valuation also leaves less room for disappointment after the post-earnings re-rating. The principal risks are:
- Carrier-fee optics and margin dilution: Twilio incurred $71 million of incremental U.S. carrier pass-through fees in Q2. Management said those fees reduced Q2 non-GAAP operating margin by roughly 90 basis points and expects roughly a 210-basis-point full-year non-GAAP gross-margin headwind versus FY2025, all else equal. The fees do not reduce gross-profit dollars directly, but they can pressure customers and mechanically depress reported margins.
- Harder comparisons: management explicitly warned that Voice and software add-ons accelerated in the second half of 2025, creating more difficult Q3 and Q4 comparisons. The company also cautioned investors not to treat the greater-than-5% guidance beats seen in Q1 and Q2 as a new normal.
- AI monetization is early: management described the Voice AI market as being in very early innings. That supports a long runway but also means current valuation may be capitalizing revenue streams whose adoption curve is still uncertain.
- Mix and commoditization risk: Messaging remains the largest product family, and pass-through fees can inflate revenue without profit. A durable multiple expansion requires higher-margin software, Voice intelligence and orchestration to become more meaningful contributors to gross profit.
- Competition and platform power: OpenAI, Salesforce, ServiceNow, Microsoft, AWS and other ecosystem participants can be partners, complements or competitors depending on the layer. Twilio’s neutrality is strategically useful, but the company must remain essential enough that model providers and application vendors do not abstract away its economics.
- GAAP versus adjusted profitability: the gap between $84.5 million of GAAP operating income and $284.6 million of non-GAAP operating income remains significant. Stock-based compensation at 9.5% of revenue is improving but still material for long-duration equity holders.
The investment debate has therefore changed. Before this quarter, the core question was whether Twilio could reaccelerate without sacrificing the cash-generation gains from its post-2022 restructuring. After Q2 2026, the more difficult question is whether the company can sustain mid-teens organic growth long enough to justify a roughly 5.5x forward-revenue and approximately 30x forward-FCF framework. The quarter improved the evidence materially, but the post-earnings price also raised the performance threshold.
3. Key FAQs
Did TWLO beat Q2 2026 earnings expectations?
Yes. Twilio reported Q2 2026 revenue of $1.499 billion versus approximately $1.43 billion in published Wall Street consensus, a beat of roughly 4.8%. Non-GAAP diluted EPS was $1.47 versus $1.32 consensus, an 11.4% beat. Non-GAAP operating margin was 19.0%, about 110 basis points above the approximately 17.9% margin implied by the midpoint of Twilio’s prior Q2 revenue and non-GAAP operating-income guidance.
Why did Twilio stock rise after Q2 2026 earnings?
The stock rose because the quarter combined a revenue and EPS beat with better-quality organic growth and a meaningful guidance raise. Organic revenue grew 17%, compared with Twilio’s prior Q2 guidance of 10%-11%, and FY2026 organic growth guidance increased to 13%-13.5% from 9.5%-10.5%. The Q3 revenue midpoint of $1.510 billion was also above the approximately $1.466 billion published consensus. The earnings call added evidence that Voice AI, software add-ons, self-service and multi-product adoption were contributing to the acceleration.
What is Twilio’s Q3 and FY2026 guidance after Q2 2026 earnings?
For Q3 2026, Twilio expects revenue of $1.505-$1.515 billion, reported growth of 16%-16.5%, organic growth of 11%-12%, non-GAAP operating income of $285-$295 million, and non-GAAP diluted EPS of $1.42-$1.47. For FY2026, Twilio now expects reported revenue growth of 18%-18.5%, organic growth of 13%-13.5%, non-GAAP operating income of $1.135-$1.155 billion, and free cash flow of $1.135-$1.155 billion.
Source verification: financial data and guidance were checked against Twilio’s official Q2 2026 earnings release, the official Q2 2026 earnings conference call page, and the company’s Investor Relations website. Twilio’s IR site provides the official webcast and supporting presentation. As of August 7, 2026, a company-hosted text transcript was not located; management wording in this analysis was cross-checked against the official call materials and a contemporaneous full earnings-call transcript.
Disclaimer: This article/chart is for educational and informational purposes only and does not constitute investment advice of any kind. Past performance is not indicative of future results. Investors should independently evaluate their own risks.