
💡 Key Takeaways
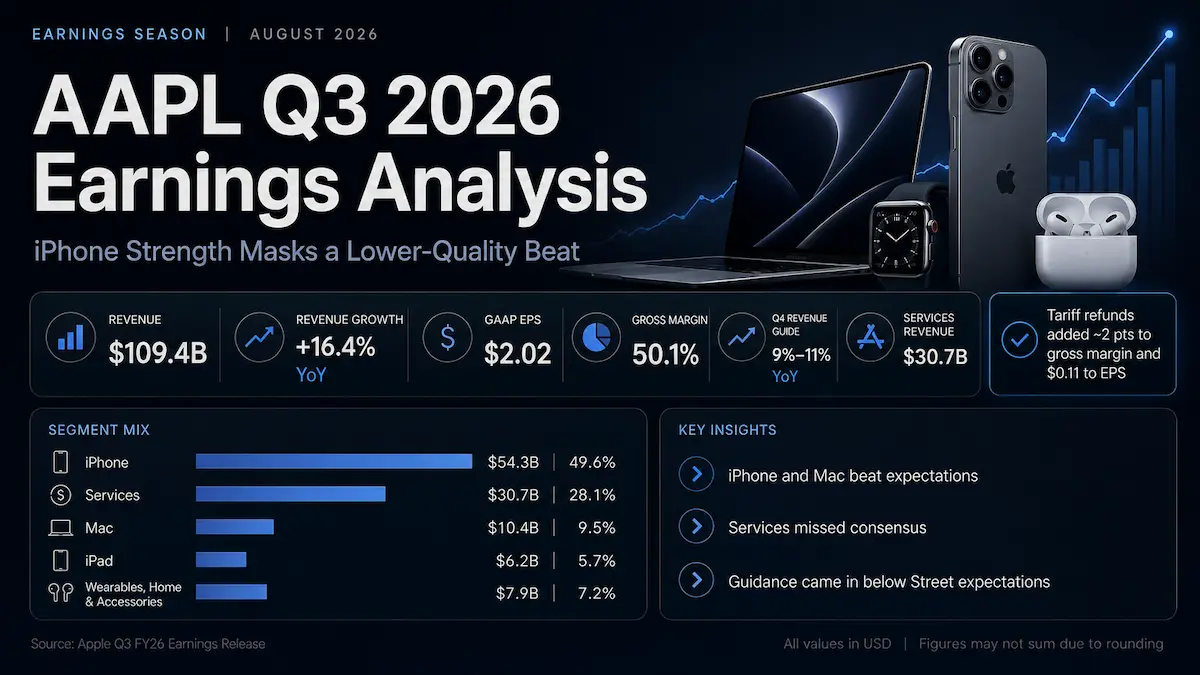
- Apple reported fiscal Q3 2026 revenue of $109.417 billion, up 16.4% year over year, and GAAP diluted EPS of $2.02, up 28.7%.
- The headline profit beat was less powerful than it appeared: tariff refunds added about 2 percentage points to gross margin and $0.11 to EPS.
- iPhone and Mac materially exceeded expectations, while Services, iPad and Greater China fell short of consensus estimates.
- Fiscal Q4 revenue growth guidance of 9%–11% was below the roughly 12% Wall Street expectation, with supply constraints and foreign exchange driving the gap.
- At the July 31, 2026 close of $308.91, AAPL traded at about 37.4 times trailing earnings, leaving limited room for execution slippage in Services, supply and AI monetization.
Core Earnings Breakdown
Revenue and Profitability Analysis
Apple’s fiscal third quarter ended June 27, 2026 produced GAAP revenue of $109.417 billion, compared with $94.036 billion a year earlier. Reported growth was 16.4%. Apple did not disclose a company-wide constant-currency growth rate, so the 16.4% figure should not be relabeled as operational growth. Management did, however, identify foreign exchange as a sequential headwind, particularly within Services.
GAAP gross profit reached $54.770 billion and reported gross margin was 50.1%, versus 46.5% in the prior-year quarter. The comparison requires an important adjustment: management disclosed that tariff refunds added approximately 2 percentage points to company gross margin. Excluding that benefit, gross margin would have been approximately 48.1%, which was near the midpoint of Apple’s prior 47.5%–48.5% guidance range.
Operating income was $35.695 billion, up 26.6% year over year, producing a reported operating margin of 32.6%. Net income increased 27.1% to $29.789 billion. GAAP diluted EPS rose 28.7% to $2.02, helped by the tariff refund and a 1.6% year-over-year reduction in diluted shares outstanding.
- iPhone revenue was $54.252 billion, up 21.7% and equal to 49.6% of total revenue. The investment conclusion is that Apple’s largest franchise is not merely stable; it is again the primary growth engine, although the scale of the advance raises the risk that some demand was accelerated by anticipated price increases and supply concerns.
- Mac revenue was $10.352 billion, up 28.7%. The strength of MacBook Neo and MacBook Pro suggests Apple is gaining incremental share in consumer, education and enterprise computing, but the category is also the most visibly constrained by advanced-node supply.
- iPad revenue was $6.191 billion, down 5.9%. The decline partly reflected a difficult launch comparison, yet it also shows that Apple’s installed-base growth does not automatically translate into consistent category revenue growth.
- Wearables, Home and Accessories revenue was $7.883 billion, up 6.5%. The segment returned to growth, but it remains a secondary contributor and did not materially alter the quarter’s earnings profile.
- Services revenue was $30.739 billion, up 12.1%. Services remains Apple’s highest-quality revenue stream, but the miss versus consensus and slower reported growth matter more for valuation than the absolute revenue record because the segment carries a 75.6% gross margin.
The product mix did not shift toward Services this quarter. Services represented 28.1% of revenue, down from 29.2% a year earlier, because hardware growth accelerated more quickly. Nevertheless, Services generated 42.4% of total gross profit, underscoring why even modest changes in Services growth have an outsized impact on Apple’s valuation framework.
Expectations vs. Actual Results
Metric | Q3 2026 Actual | Expectation / Benchmark | Result | Fiscal Q4 2026 Guidance |
|---|---|---|---|---|
Total revenue | $109.417 billion | About $109.0 billion FactSet consensus | ✅ Beat by about $0.4 billion | 9%–11% year-over-year growth, implying approximately $111.7–$113.7 billion |
GAAP diluted EPS | $2.02 | $1.89 FactSet consensus | ✅ Beat by $0.13; tariff-refund-excluded proxy was approximately $1.91 | No EPS guidance |
Gross margin | 50.1% | 48.0% midpoint of prior company guidance | ✅ Headline beat; approximately 48.1% excluding tariff refunds | 47%–48%, including an expected benefit of about 1 percentage point from tariff refunds |
Operating margin | 32.6% | Approximately 30.6% implied by prior revenue, gross-margin and OpEx guidance midpoints | ✅ Headline beat; approximately 30.6% after removing the 2-point gross-margin refund benefit | OpEx of $19.1–$19.4 billion; no direct operating-margin guidance |
The true source of the beat was concentrated rather than broad-based. iPhone revenue of $54.252 billion exceeded the approximately $53.86 billion LSEG estimate, while Mac revenue of $10.352 billion was far above the approximately $8.74 billion estimate. By contrast, Services revenue of $30.739 billion missed the approximately $31.22 billion estimate, iPad revenue of $6.191 billion missed the approximately $6.92 billion estimate, and Greater China revenue of $18.816 billion was below the approximately $19.67 billion Visible Alpha estimate.
The EPS beat also needs normalization. Apple disclosed that tariff refunds contributed $0.11 to diluted EPS. Subtracting that benefit produces an EPS proxy of $1.91, calculated from company-reported figures and not presented by Apple as an adjusted result. That is only about 1.1% above the $1.89 consensus. On the same basis, EPS growth would have been approximately 21.7%, rather than the reported 28.7%.
Investors therefore focused less on the reported EPS number and more on the composition of growth, Services momentum and forward supply. The market was willing to look through a one-time refund, but not through a lower Services trajectory and a September-quarter revenue outlook below consensus. Management guided to 9%–11% revenue growth versus an approximately 12% Street expectation, while also warning that supply constraints would increase significantly and affect iPhone, Mac and iPad.
AAPL fell to $308.91 on July 31, 2026, a decline of roughly 7% from the prior close. The reaction was not adequately explained by the phrase “sell the news.” The more relevant drivers were a lower-quality EPS beat, a Services miss, gross-margin normalization, worsening advanced-node and memory constraints, and a valuation that had already embedded strong execution. The stock’s decline was a repricing of forward earnings quality rather than a rejection of the current quarter’s demand.
Earnings Call Highlights
- “We’re seeing some very significant constraints currently, with limited flexibility in the supply chain to remedy it.” 💡 Reading Between the Lines: Demand exceeded Apple’s internal forecast for both iPhone and Mac, but the shortage is not confined to a single product. The revenue risk is now a capacity problem across advanced-node silicon, with the potential to defer rather than destroy demand, while still pressuring near-term estimates.
- Management expects September-quarter revenue growth of 9%–11%, with foreign exchange creating an approximately 2.5 percentage point sequential headwind and supply constraints worsening materially. 💡 Reading Between the Lines: The underlying demand picture is stronger than the reported guide, but investors cannot capitalize deferred demand at full value when timing, mix and component costs are uncertain. The guide lowers near-term operating leverage and raises the probability of estimate dispersion into the holiday quarter.
- “We reluctantly raised prices” because Apple is facing what Tim Cook characterized as a “100-year flood” in memory pricing. 💡 Reading Between the Lines: Apple is prioritizing a balance among unit volume, revenue and gross profit rather than defending a fixed margin percentage. Pricing can offset bill-of-material inflation, but it also creates elasticity risk and may pull demand forward before additional price actions.
- Apple surpassed 1.5 billion paid subscriptions, while both transacting accounts and paid accounts reached all-time highs. 💡 Reading Between the Lines: The ecosystem remains structurally healthy even though quarterly Services growth disappointed. The strategic question is no longer whether Apple has distribution, but whether App Store regulation, mobile-gaming softness and mix can prevent that distribution from converting into faster high-margin growth.
- Apple said intensive Siri AI users may have opportunities to move to higher iCloud+ tiers, while management acknowledged that the compute-cost and monetization balance remains early and uncertain. 💡 Reading Between the Lines: Apple is testing an AI monetization model based on storage and service-tier expansion rather than a stand-alone chatbot subscription. That could preserve product integration and reduce customer friction, but investors should not yet assign a mature recurring-revenue multiple to an unproven uptake curve.
Deep Business Insights
Hidden Metrics That Matter
First, Services’ economic contribution is much larger than its revenue share. Services gross profit was $23.245 billion and total gross profit was $54.770 billion. The calculation is $23.245 billion ÷ $54.770 billion = 42.4%, calculated from company-reported figures. Services represented only 28.1% of revenue, calculated as $30.739 billion ÷ $109.417 billion. This gap explains why the Services miss mattered more than the modest total-revenue beat: each incremental Services dollar has materially more profit value than an average hardware dollar.
Second, Apple’s AI investment is becoming visible in operating expenses. R&D expense rose 32.3% to $11.729 billion, twice the company’s 16.4% revenue growth rate. R&D intensity increased to 10.7% of revenue, calculated as $11.729 billion ÷ $109.417 billion, from approximately 9.4% a year earlier. Apple’s 10-Q attributed the increase primarily to infrastructure-related costs, including AI investment, and headcount. This is a key valuation bridge: Apple remains less capital-intensive than hyperscale cloud peers, but AI is not costless and is already reducing the amount of operating leverage that would otherwise flow from 16% revenue growth.
Customers choose Apple because the company combines hardware, operating systems, silicon, privacy architecture, distribution and services within one controlled platform. Management cited enterprise deployments that emphasize on-device AI, lower cloud-token costs, security and workflow integration. It also reported that roughly half of large U.S. education purchases of MacBook Neo displaced Windows or Chromebook devices. The differentiator is therefore not a single feature; it is the ability to lower total workflow friction while maintaining high device residual values, security and a unified user identity across more than 2.5 billion active devices.
Earnings quality remained strong in cash terms. Management reported quarterly operating cash flow of $34.4 billion against net income of $29.789 billion, equivalent to approximately 115.5% cash conversion, calculated from company-reported figures. For the first nine months of fiscal 2026, operating cash flow was $116.996 billion and capital expenditures were $6.799 billion, producing free cash flow of approximately $110.197 billion, calculated from company-reported figures. That cash generation supports continued buybacks even as R&D spending rises.
Industry Chain Reactions
- ✅ Benefit — Micron Technology (MU): Apple’s description of exponential memory-price increases, higher September-quarter memory costs and a concentrated DRAM supplier base validates a favorable pricing environment for memory producers. The offsetting risk is that Apple is evaluating alternative sourcing options, which could eventually reduce supplier concentration.
- ❌ Face Pressure — HP Inc. (HPQ): Mac revenue rose 28.7%, and Apple said about half of large U.S. education purchases of MacBook Neo displaced Windows and Chromebook devices. If that pattern expands, HP could face pressure in education and commercial notebooks even if the broader PC market remains healthy.
Valuation Framework and Key Risks
At the July 31, 2026 close of $308.91, Apple’s market capitalization was approximately $4.55 trillion and the stock traded at about 37.4 times trailing earnings, equivalent to a 2.7% trailing earnings yield. That valuation is not supported by current-quarter growth alone. It assumes that Apple can sustain premium margins, convert the installed base into higher Services revenue, monetize AI without hyperscaler-like capital intensity, and protect unit demand while passing through component inflation.
A practical valuation framework should separate three earnings layers:
- Core hardware earnings: iPhone and Mac demand is currently strong, but hardware remains cyclical and supply-constrained. A premium multiple is justified only if upgrade rates remain elevated after pricing changes.
- Services earnings: the 75.6% gross margin supports a higher multiple, but the segment’s 12.1% growth and App Store headwinds argue against assuming uninterrupted mid-teens growth.
- AI optionality: Siri AI, on-device inference and possible iCloud+ upgrades can expand lifetime value, but current monetization and compute-cost economics are not yet sufficiently disclosed to justify treating AI as a fully formed profit pool.
The most important near-term risk is that supply constraints persist into the holiday quarter while memory costs continue to rise. In that scenario, Apple may lose both revenue timing and margin leverage. The second risk is Services deceleration caused by mobile-gaming weakness, App Store business-model changes and link-out regulation. The third is price elasticity: Apple has already raised Mac and iPad prices, and management said it is too early to assess the unit response.
There is also a regional AI risk. Management said Siri AI would not initially have full availability on iPhone and iPad in the European Union and that China required additional regulatory work. Delayed feature availability could weaken the global upgrade case and create uneven monetization across Apple’s highest-value markets.
At roughly 37 times trailing earnings, the valuation can absorb temporary supply-driven revenue deferrals more easily than a structural Services slowdown. The key distinction for investors is whether fiscal Q4 weakness is primarily timing-related or whether it signals a lower normalized growth and margin regime. The quarter supports the first interpretation on hardware demand, but the Services data and rising R&D burden prevent a definitive conclusion.
Key FAQs
Did Apple beat AAPL Q3 2026 earnings expectations?
Yes. Apple reported revenue of $109.417 billion versus approximately $109.0 billion expected and GAAP diluted EPS of $2.02 versus $1.89 expected. However, tariff refunds added $0.11 to EPS. Excluding that disclosed benefit, the EPS proxy was approximately $1.91, leaving only a modest underlying beat.
Why did AAPL stock fall after Q3 2026 earnings?
The stock fell because the market focused on forward earnings quality rather than the headline beat. Fiscal Q4 revenue growth guidance of 9%–11% was below the roughly 12% Street expectation, supply constraints were expected to worsen, Services missed consensus, and reported margins benefited from tariff refunds that will not recur at the same magnitude.
What is Apple’s Q4 2026 guidance and biggest earnings risk?
Apple expects total revenue growth of 9%–11%, implying approximately $111.7–$113.7 billion based on the prior-year quarter. Gross margin is expected at 47%–48%, including about a 1 percentage point tariff-refund benefit, and OpEx is expected at $19.1–$19.4 billion. The largest risk is the interaction of advanced-node supply constraints, rising memory costs and price elasticity across iPhone, Mac and iPad.
Primary sources include Apple’s official Q3 2026 earnings release, fiscal Q3 2026 Form 10-Q, official earnings-call webcast, and Investor Relations page; Apple publishes the official call as webcast audio rather than a written transcript, so call wording was checked against the webcast and cross-checked with a full transcript.
Disclaimer: This article/chart is for educational and informational purposes only and does not constitute investment advice of any kind. Past performance is not indicative of future results. Investors should independently evaluate their own risks.