


Key Takeaways
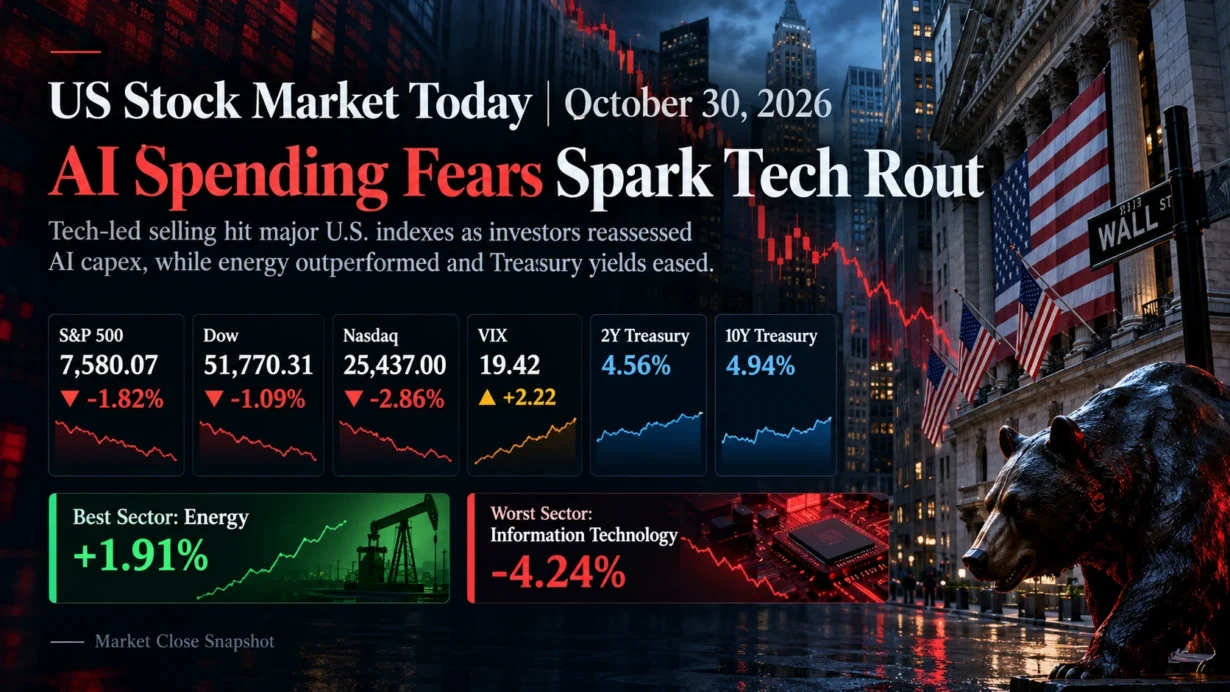
- The S&P 500 fell 1.82% to 7,580.07, the Nasdaq Composite lost 2.86% to 25,437.00, and the Dow declined 1.09% to 51,770.31 at Friday’s regular-session close, according to Reuters’ closing report.
- Among S&P 500 sectors, energy led with a 1.91% gain, while information technology fell 4.24%, the weakest performance. The selloff centered on the economics of AI investment rather than an across-the-board surge in bond yields.
- Intel plunged 28.58% following a weaker fourth-quarter margin outlook; Amazon fell 1.41% despite rapid AWS growth as its trailing-12-month free cash flow turned sharply negative.
- The VIX closed at 19.42, up 2.22 points. U.S. Treasury’s daily two-year and 10-year yields fell to 4.56% and 4.94%, respectively, even as September core PCE inflation remained at 3.1% year over year.
1. Market Capital Flows and Sector Rotation
The S&P 500 sector breakdown shows energy up 1.91%, the day’s best performer, and information technology down 4.24%, the worst. Consumer staples and utilities also advanced, reflecting a defensive tilt. This was not a uniform cyclical rally: oil-sensitive producers benefited from supply risk and strong refining economics, while semiconductor and PC-related cyclicals sold off. WTI crude settled at $104.12 per barrel, up 2.08%, and Brent at $117.63, up 2.4%, according to Reuters’ cross-asset close.
The damage was concentrated in growth-heavy large-cap technology but extended beyond it. The Russell 2000 fell 1.66% to 2,811.84, less than the Nasdaq’s 2.86% decline. The Invesco S&P 500 Equal Weight ETF (RSP), an equal-weight proxy rather than the index itself, lost 0.79%, versus 1.82% for the capitalization-weighted S&P 500. Energy and defensives showed greater relative resilience than highly valued, capital-intensive growth stocks; that is a sector-based style assessment, not a verified growth-versus-value index return.
Market breadth cautions against calling this merely a handful of mega-cap stocks dragging down the averages. NYSE decliners outnumbered advancers 1.8 to 1, while the Nasdaq recorded 3,622 declining and 1,196 advancing stocks. U.S. exchange volume reached 19.87 billion shares versus a 17.26 billion 20-session average, according to Reuters. Participation was broadly negative even though capitalization weights amplified the index losses.
Institutional Flow Insight: A plausible allocation response is to favor visible near-term cash generation, inflation-linked energy revenues and defensive earnings over businesses whose AI spending has a long or uncertain payback period. Falling Treasury yields may also support rate-sensitive defensives, while elevated absolute yields still challenge expensive growth valuations. Month-end rebalancing and tighter volatility-based risk budgets could have reinforced positioning, but neither motive can be established from price action alone; the evidence is relative performance, not confirmed institutional fund flows.
2. Decoding the Biggest Market Movers
Intel (INTC)
Intel closed at $65.76, down 28.58%. Its official third-quarter earnings release reported $16.5 billion in revenue, up 21% year over year; GAAP diluted EPS of $0.60; non-GAAP EPS of $0.52; and GAAP and non-GAAP gross margins of 43.0% and 44.1%. Data Center and AI revenue rose 78% to $7.3 billion, but Client Computing and Physical AI revenue fell 5% to $8.1 billion. Crucially, Intel’s company-issued fourth-quarter guidance—not reported results—called for $15.0 billion–$16.0 billion in revenue, 37.1% GAAP gross margin (38.0% non-GAAP), and diluted EPS of $0.10 GAAP ($0.25 non-GAAP).
On the October 29 earnings call, management emphasized supply-constrained server demand alongside weak PC conditions and capacity investment needs; the IR release indicated that PC softness could persist through the first half of 2027. The stock’s repricing therefore reflects doubts about the near-term margin and cash returns from AI infrastructure, not an absence of data-center demand. Contagion was material: the Philadelphia Semiconductor Index dropped approximately 7.2%, while AMD declined 10.9% and Nvidia 4.2%, pressuring technology-sector valuations more broadly.
Amazon (AMZN)
Amazon ended at $240.35, down 1.41%. Its official third-quarter report showed sales of $201.9 billion, up 12%; AWS revenue of $46.0 billion, up 39%; operating income of $28.1 billion; a record 13.9% consolidated operating margin; and GAAP diluted EPS of $1.89, compared with $1.95 a year earlier. The year-earlier EPS included a significant investment-related gain, limiting the usefulness of a simple EPS comparison.
The market’s concern was cash conversion. Amazon reported trailing-12-month free cash flow of negative $42.4 billion versus positive $14.8 billion a year earlier, principally reflecting higher AI-related investment. Management’s published outlook, reiterated on its October 29 earnings call, included fourth-quarter revenue guidance of $240.0 billion–$247.0 billion, operating income of $28.5 billion–$33.5 billion and approximately $220 billion of expected 2026 cash capital expenditure. These are company forecasts, not actual results. The investment question for cloud platforms is increasingly how quickly strong demand and operating margins can translate into durable free cash flow and returns on invested capital.
3. Macro Indicators and Market Outlook
The Cboe Volatility Index (VIX) finished at 19.42, up 2.22 points, or 12.91%, from 17.20. It touched 23.93 intraday before retreating. Higher implied volatility alongside falling equities is consistent with increased demand for downside protection and event-risk hedging; a close below 20, however, does not by itself establish a disorderly volatility regime.
On the U.S. Treasury’s official daily par-yield curve, the two-year yield was 4.56%, down 5 basis points from October 29, and the 10-year was 4.94%, down 4 basis points. The 10-year-minus-two-year spread was thus a positive 38 basis points. These daily Treasury benchmark observations differ slightly from traded-note closing quotes. Bonds rallied during the equity decline, indicating a haven bid rather than a same-day discount-rate shock. The Federal Reserve held its policy range at 3.75%–4.00% on October 28; the October 30 Employment Cost Index showed civilian compensation up 0.8% quarter over quarter, while the latest September core PCE reading was 3.1% year over year. These crosscurrents do not justify treating one day’s bond rally as confirmation of future rate cuts. Higher oil prices also keep inflation and term-premium risks relevant.
Upcoming Economic Data & Catalysts:
- ISM Manufacturing PMI for October 2026 (Release date: November 2, 2026, 10:00 a.m. ET): New orders, production and prices paid will help distinguish demand resilience from renewed input-cost pressure.
- BLS Employment Situation for October 2026 (Release date: November 6, 2026, 8:30 a.m. ET): Payroll growth, unemployment and wage trends could affect rate expectations, earnings assumptions and the risk appetite for smaller companies.
Market Insights: This was a broad risk-off session magnified by semiconductor and other high-weight technology declines, not simply a market-wide response to rising yields. A rebound would be more persuasive if market breadth improves alongside large-cap leadership. Key reversal risks include another oil-driven inflation shock, renewed Treasury-yield pressure, cuts to AI-related earnings or cash-flow expectations, weaker breadth and a sustained rise in the VIX.
Trading & Investment Strategy: Keep position sizes consistent with defined loss limits and portfolio concentration constraints. Consider staggered entry rather than attempting to identify a one-day bottom, and distinguish cash-generative defensive or energy exposure from long-duration growth risk. Reassess balance-sheet capacity, margin guidance and free-cash-flow conversion before adding to beaten-down AI names. Predefine risk-reduction or stop-loss levels, account for gap risk around earnings and economic releases, and avoid chasing a single session’s sector winners.
4. Key FAQs About the US Stock Market Today
Why did the US stock market move on October 30, 2026?
Intel’s lower near-term margin outlook and Amazon’s AI-driven free-cash-flow deterioration sharpened concerns about returns on capital-intensive technology spending. The selloff spread through semiconductors and broader market breadth, even as Treasury yields fell. Persistently elevated underlying inflation and higher oil prices complicated the macro picture.
Which sectors performed best and worst in the US stock market on October 30, 2026?
Energy led the S&P 500’s sectors at +1.91%, helped by higher crude prices and integrated oil-company earnings; information technology ranked last at −4.24% as semiconductor valuations repriced. Consumer staples and utilities were also positive, indicating selective defensive demand rather than indiscriminate risk-taking.
What should investors watch after the US stock market close on October 30, 2026?
Watch the November 2 ISM manufacturing report, the November 6 U.S. employment report, Treasury yields, VIX behavior and whether advance-decline breadth improves. For technology, the central test remains whether incremental AI revenue can support margins and free cash flow without further valuation compression.
Disclaimer: This article is intended solely for the exchange of investment ideas and does not constitute investment advice of any kind.