




Key Takeaways
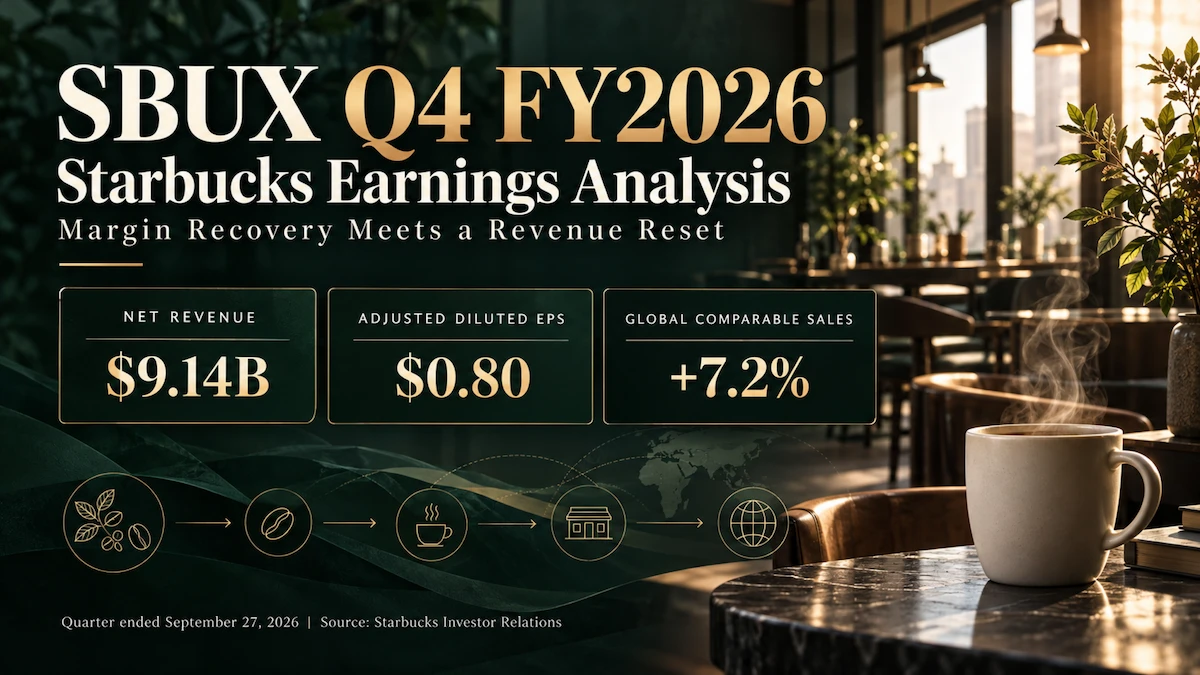
- Starbucks reported adjusted diluted EPS of $0.80, above the cited $0.71 consensus, while revenue of $9.1412 billion fell short of the cited $9.22 billion estimate.
- Global comparable sales rose 7.2%, but U.S. transaction growth of 2.4%, ticket growth of 5.2% and sales transfers require a more nuanced reading of demand.
- Adjusted operating margin reached 14.0%. Lower restructuring charges helped GAAP comparisons, while China’s licensed joint venture changed the revenue and profit mix.
- FY2027 adjusted EPS guidance of $3.15–$3.25 includes slightly more than $0.10 from a 53rd week. Valuation should account for that calendar benefit.
Starbucks’ October 29 results show a business with improving coffeehouse economics and a financial reporting structure that has changed materially. This SBUX Q4 FY2026 earnings analysis examines whether better execution can support a premium valuation after separating customer demand, portfolio changes and accounting effects.
1. Core Earnings Breakdown
Revenue and Profitability Analysis
For the 13-week quarter ended September 27, 2026, revenue was $9.1412 billion versus $9.5690 billion a year earlier, down 4.5% in the official financial table. The earnings release attributes the reported decline primarily to converting China retail operations to a licensed joint venture.
North America remained the dominant economic exposure. The segment revenue shares below use each segment’s revenue divided by consolidated revenue of $9,141.2 million; these percentages are calculated from company-reported figures.
- North America: $7,328.4 million, up 6.2%, representing 80.2% of revenue. GAAP segment margin reached 12.3%, versus 4.5%. The investment case depends increasingly on profitable execution in the existing store base, rather than rapid domestic unit expansion.
- International: $1,305.8 million, down 36.9%, representing 14.3%. GAAP margin increased to 19.7% from 10.8%. Much of the revenue decline and margin change reflects China’s new ownership structure, so the higher percentage margin is not a clean measure of better coffeehouse productivity.
- Channel Development: $494.4 million, down 8.9%, representing 5.4%. GAAP margin rose to 53.5%, helped by mix and joint-venture income relative to revenue. This illustrates why a high margin can coexist with a shrinking sales denominator.
Corporate and Other contributed the remaining $12.6 million, or 0.1% on the same calculated basis. Segment margins are GAAP figures and should not be mixed with management’s adjusted commentary.
Consolidated GAAP operating margin was 10.8%, compared with 2.9% a year earlier. Adjusted margin was 14.0%, up 460 basis points as reported and 450 basis points in constant currency, according to the official reconciliation. Restructuring and impairment expense fell to $272.8 million from $755.0 million, making the GAAP comparison particularly favorable. Adjusted diluted EPS increased to $0.80 from $0.52; GAAP EPS was $0.59 versus $0.12.
The China change deserves more than a footnote. Starbucks retained 40% of the venture, while Boyu-managed funds hold 60%. The official transaction accounting brief shows that consolidated net revenue includes 60% of relevant royalties, licensing fees and product sales to the venture. The ownership-related portion is eliminated from those revenue lines, while equity-investee income includes Starbucks’ share of venture earnings and the associated portion of product margin and fees.
The implication is a smaller reported revenue base with a different profit mix. Investors should follow absolute profit and cash distributions alongside margin percentages; deconsolidation alone does not establish a higher economic return on capital.
Expectations vs. Actual Results
The following comparisons use the analyst estimates reported by Investing.com, rather than combining different vendors’ consensus snapshots:
- ❌ Revenue miss: $9.1412 billion actual versus $9.22 billion consensus.
- ✅ Adjusted diluted EPS beat: $0.80 actual versus $0.71 consensus.
- Operating margin: 10.8% GAAP and 14.0% adjusted. An independent analyst-consensus margin was not verified, so a consensus margin beat cannot be established.
The EPS result is consistent with stronger sales leverage and cost execution, while the GAAP improvement also benefits from much lower restructuring charges. China’s conversion explains much of the year-over-year revenue decline, but does not, by itself, explain the precise consensus miss: analysts could already have incorporated that transaction into their forecasts.
For FY2027, management guided consolidated revenue to decline approximately 1%, North America comparable sales to grow approximately 4%, adjusted operating margin to reach 13.5%–14.0% and adjusted EPS to total $3.15–$3.25. The company also expects approximately 1,200 net new coffeehouses globally. These are forecasts, not realized results.
FY2027 contains 53 weeks. Guidance includes approximately $700 million of revenue and slightly more than $0.10 of EPS from the extra week, which falls in Q4; comparable-sales guidance uses a comparable 52-week basis. No standalone numerical consolidated Q1 revenue, EPS or margin range was provided in the reviewed release and call. Management instead discussed a more balanced quarterly comp cadence.
The stock reaction was restrained despite the EPS beat. Starbucks closed at $103.67 on October 30, down 1.74% from the $105.51 pre-release close on October 29, according to Stock Analysis historical prices. This was the first completed regular trading session after the report.
A plausible explanation is that investors require more evidence of sustained transactions and earnings growth at the existing valuation. The revenue miss, International transaction weakness and an approximately 4% North America comp outlook after FY2026’s 6.6% all warrant scrutiny. China accounting complicates the comparison, while the extra week supports next year’s EPS. These are analytical considerations, not proof that any single item caused the share-price decline.
Earnings Call Highlights
The following are verified strategic paraphrases from the full corrected transcript hosted by Starbucks Investor Relations, rather than direct quotations.
More than 80% of North America company-operated coffeehouses delivered positive comparable sales, versus less than 50% a year earlier.
💡 Reading Between the Lines: Broader improvement reduces reliance on a few successful locations. Its value depends on maintaining service and product availability as volumes rise, so that throughput converts into profitable transactions.
In discussing U.S. comps, the CFO identified approximately 200 basis points of Q4 support from coffeehouse closures and sales transfers.
💡 Reading Between the Lines: Retaining sales at neighboring stores can improve network economics, but part of the comp gain reflects redistribution within the portfolio. It should not all be treated as new category demand.
U.S. ticket growth was roughly split between pricing and delivery, and food attachment and product mix.
💡 Reading Between the Lines: A larger basket can support labor leverage, but delivery commissions and product costs determine how much reaches profit. Ticket growth is therefore different from either pure pricing power or customer-count growth.
Management expects savings to become more visible after lapping its Green Apron Service labor investments.
💡 Reading Between the Lines: The strategy requires the staffing investment to improve capacity and repeat visits. Cost discipline creates value when it preserves the service improvements that brought customers back.
FY2027 plans include approximately $1 billion in share repurchases and capital expenditure near 5% of revenue.
💡 Reading Between the Lines: Capital allocation is shifting toward both reinvestment and shareholder distributions. Renovation returns and cash conversion must support that combination without relying on recurring asset sales.
2. Deep Business Insights
Hidden Metrics That Matter
The first metric is the composition of U.S. comparable-sales growth. Using the reported transaction and ticket figures, (1 + 2.4%) × (1 + 5.2%) − 1 = approximately 7.7%, calculated from company-reported figures. This illustrates that the comp result combines more transactions with larger tickets; it is not a 7.7% increase in visits.
The closure-transfer contribution adds another qualification. It can improve surviving-store utilization while reducing the total network’s revenue growth relative to comps. Subtracting the CFO’s approximate transfer estimate to invent an official “organic comp” would overstate the precision of the available data. International company-operated transactions also declined 2.8%, showing that recovery is not uniform across the retained operating portfolio.
The second metric is internally generated cash available for capital allocation. FY2026 operating cash flow of $4,988.4 million less $1,263.6 million of additions to property, plant and equipment equals $3,724.8 million of conventional free cash flow, calculated from company-reported figures. Dividends of $2,824.7 million consumed 75.8% of that amount ($2,824.7 million ÷ $3,724.8 million), also calculated from company-reported figures.
That leaves approximately $900.1 million after those dividends on the same historical basis. The comparison is useful context for the planned $1 billion repurchase program, but is not a FY2027 cash forecast. Capital expenditure is expected to increase relative to revenue, and the operating portfolio has changed. The $2,544.2 million of FY2026 net divestiture proceeds was investing cash, not operating cash flow.
The customer proposition remains an accessible premium ritual supported by customization, convenience and a familiar place to meet or work. Execution makes that proposition economically defensible: inventory availability, order accuracy and manageable wait times determine whether customers return and accept a larger basket. Branding alone cannot offset inconsistent service or unattractive value.
Industry Chain Reactions
- ✅ Potential beneficiary — PepsiCo (PEP): the North American Coffee Partnership connects the companies in ready-to-drink Starbucks beverages. Stronger brand engagement and successful innovation could support partnership demand and distribution economics. Starbucks’ Channel Development revenue nevertheless fell this quarter, so this is a conditional benefit, not evidence of material PepsiCo earnings upside.
- ❌ Potential competitive pressure — Dutch Bros (BROS): its official business description emphasizes specialty beverages, speed and service. Better Starbucks throughput and beverage innovation could intensify competition for convenient drink occasions. That overlap does not establish Dutch Bros customer losses or a deterioration in its own reported performance.
The relevant evidence is local customer behavior and profitable repeat purchasing. A stronger Starbucks does not automatically create an equal loss for every beverage competitor.
Valuation Framework and Key Risks
At the October 30 regular-session closing price of $103.67, the stock traded at approximately 38.1 times actual FY2026 adjusted EPS ($103.67 ÷ $2.72). Against management’s FY2027 EPS range, the multiple was 31.9–32.9 times ($103.67 ÷ $3.25 to $103.67 ÷ $3.15). These multiples are calculated using the cited share price and company-reported figures.
The first is a trailing adjusted multiple; the second depends on achieving management’s forecast and includes the 53rd-week benefit. Removing exactly $0.10 would create false precision because management described the contribution as slightly greater than that amount. Investors should assess the underlying growth trajectory separately from the calendar lift.
The valuation leaves a meaningful execution burden. Sustained traffic, better labor productivity and a durable licensed profit stream could support earnings recovery. Weak transactions, renovation overruns or stronger competition would make the premium harder to defend.
- Demand quality: ticket and portfolio transfers may mask softer underlying visit growth.
- Margin comparability: restructuring, licensing and equity-investee income can improve percentages without equivalent gains in store productivity.
- Execution costs: labor, coffee inputs, technology changes and renovation spending can absorb sales leverage.
- Partner dependence: China economics now depend on joint-venture execution as well as Starbucks’ own operating decisions.
- Capital discipline: dividends, repurchases and reinvestment must be supported by sustainable cash generation.
The most informative next checks are North America transactions, reported sales relative to comps, margin delivery and operating cash generation. Those measures can establish whether the turnaround is becoming a repeatable growth model.
3. Key FAQs
Why did Starbucks revenue fall when Q4 FY2026 comparable sales rose?
Comparable sales measure eligible company-operated coffeehouses, while consolidated revenue also reflects ownership changes and the size of the operating portfolio. China moved to a licensed joint venture, reducing reported retail revenue while adding a different combination of product, licensing and equity-investee income.
Did Starbucks beat Q4 FY2026 earnings expectations?
Adjusted diluted EPS of $0.80 exceeded the cited Investing.com consensus of $0.71. Revenue of $9.1412 billion missed its cited $9.22 billion estimate. Both can be true because cost performance, business mix and non-operating items affect earnings differently from revenue.
What should investors watch in Starbucks’ FY2027 guidance?
Monitor approximately 4% North America comp growth, adjusted margin of 13.5%–14.0% and adjusted EPS of $3.15–$3.25. The EPS range includes an extra week, while China’s new structure reduces revenue comparability. Transaction growth and cash conversion provide a clearer test of recurring economics.
Sources: Starbucks’ official earnings release, official IR-hosted corrected earnings call transcript, non-GAAP reconciliation and China joint-venture accounting brief. Financial results and guidance are dated October 29, 2026; valuation uses the October 30, 2026 regular close. Research completed October 31, 2026.
Disclaimer: This article/chart is for educational and informational purposes only and does not constitute investment advice of any kind. Past performance is not indicative of future results. Investors should independently evaluate their own risks.